Market Wrap: Stocks, Bonds, Commodities
Most Asian currencies extended declines on Tuesday with the Chinese yuan hitting a one-year low, as markets assessed the impact of new U.S. export restrictions targeting China’s semiconductor industry.
The Dow Jones Industrial Average fail 128.65 points to 44,782.00, the S&P 500 gain 0.24% to 6,047.15 and the Nasdaq Composite up 185.78 points to 19,403.95.
MSCI’s index of Asia-Pacific stocks outside Japan is up 1.83% to 716.42 levels. The Australian index was higher by 0.56% to 8,495.20. Japanese Nikkei Index increase 1.84% today.
European stocks were positive on Tuesday, with the Stoxx Europe 50 Index increase 0.86% to 4,845.65 Germany’s DAX ascend 1.57% to 19,933.62, and France’s CAC higher 0.02% to 7,236.89 and U.K.’s FTSE 100 gain 0.31% to 8,312.89.
Benchmark 10-year U.S. Treasury rose as demand for safe assets slipped again, today 10-year bond yields 0.57% to 4.2170.
Oil prices nudged higher on Tuesday but remained within a narrow trading range, as traders awaited the outcome of an OPEC+ meeting later this week.
Spot Brent crude oil increase 0.46% to $72.16 per barrel. US West Texas Intermediate crude is increase 0.41% to $68.38 a barrel.
The yellow metal gold is up 0.37% to 2,668.31 dollars per ounce.
Market Wrap: Forex
The dollar was buoyant on Tuesday as political turmoil in France undermined the euro, while tariff risks and weakness in China’s economy pushed the yuan to a 13-month low.
Today, the U.S. dollar index measures the Greenback against a trade-weighted basket of six major currencies, which either descend 0.04% to 106.385.
The Euro US Dollar (EUR/USD) is a widely traded is up 0.06% today. This left the pair trading around $1.05030.
The Japanese yen was will move positive against the U.S. dollar on Tuesday. Today USD/JPY is trades pair that increase 0.27% to the 150.00 level.
Another commodity-related currency positive against the U.S dollar, AUD/USD gain 0.19% to 0.64830, and NZD/USD increase 0.03% to 0.58870 level.
EUR/USD Intraday: Trend on the downside
Our pivot point is at 1.04910
Preferable Price Action: Take sell positions below pivot level with targets at 1.04740 & 1.04600 in extension.
Alternative Price Action: Buy pivot looks for a further upside to 1.05090 & 1.05240.
Comment: RSI is below 50 levels and pairs below its 20MA & 55MA.
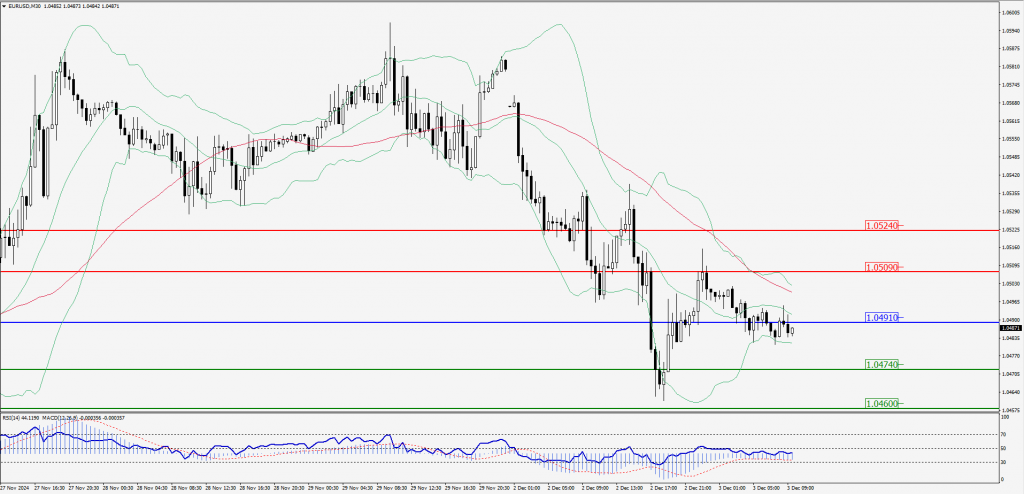
Green Lines Indicate Resistance Levels – Red Lines Indicate Support Levels
Light Blue is a Pivot Point – Black represents the price when the report was produced
GBP/USD Intraday: Trend on the downside
Our pivot point is at 1.26570
Preferable Price Action: Sell positions below pivot with targets at 1.26370 & 1.26170 in extension.
Alternative Price Action: The price above pivot would call for further upside to 1.26770 & 1.26960.
Comment: RSI is below 50 levels and pairs below its 55MA.
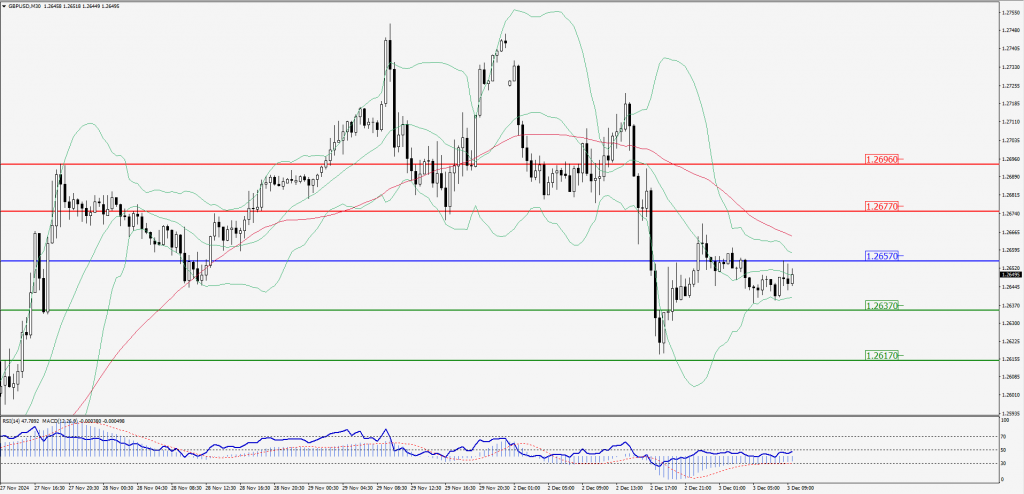
Green Lines Indicate Resistance Levels – Red Lines Indicate Support Levels
Light Blue is a Pivot Point – Black represents the price when the report was produced
USD/JPY Intraday: Trend on the upside
Our pivot point is at 149.940
Preferable Price Action: Buy position above pivot with the target at 150.330 and 150.670 in extension.
Alternative Price Action: The downside breakout of the pivot would call for 149.570 and 149.230.
Comment: MACD is above 50 levels and pairs above its 55MA.
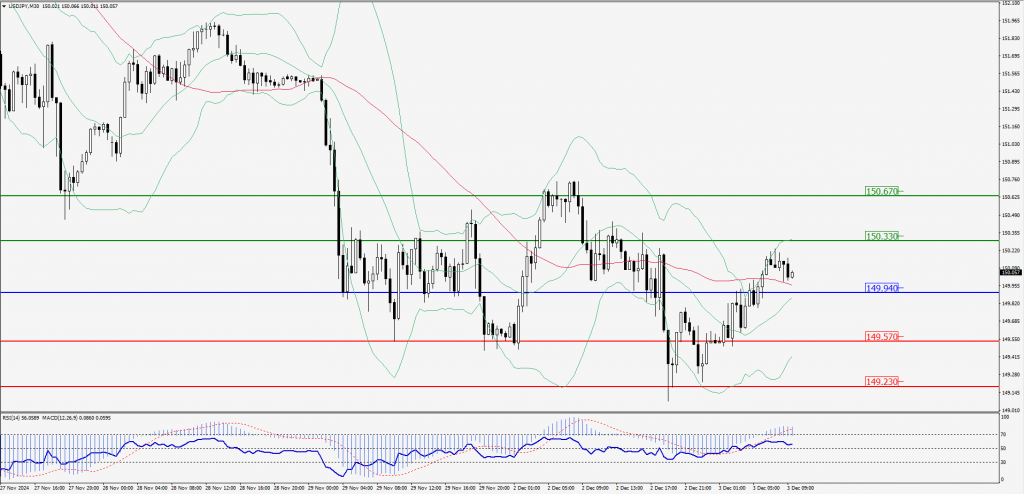
Green Lines Indicate Resistance Levels – Red Lines Indicate Support Levels
Light Blue is a Pivot Point – Black represents the price when the report was produced
AUD/USD Intraday: Trend on the downside
Our pivot point is at 0.64740
Preferable Price Action: Sell positions below pivot with targets at 0.64630 & 0.64540 in extension.
Alternative Price Action: Above pivot a further upside with 0.64840 & 0.64930 as targets.
Comment: RSI is below 50 levels and pairs below its 55MA.
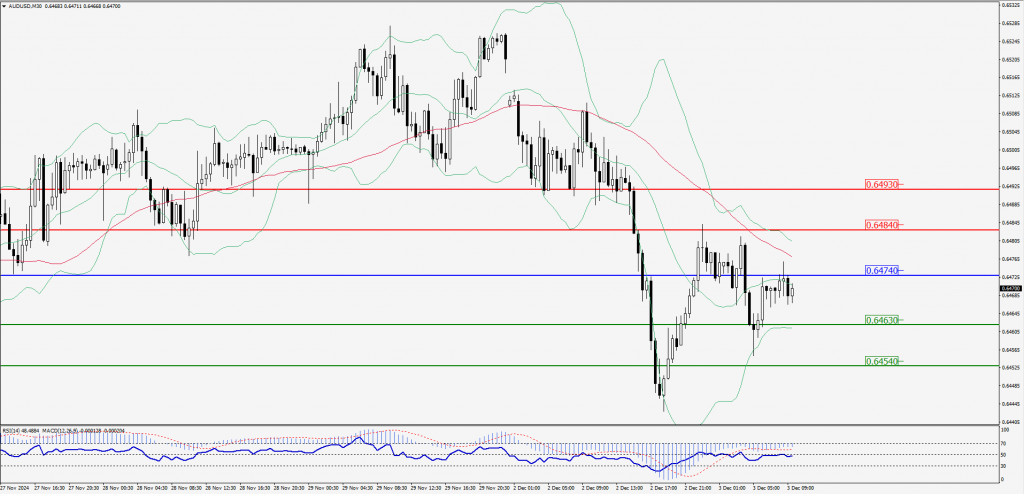
Green Lines Indicate Resistance Levels – Red Lines Indicate Support Levels
Light Blue is a Pivot Point – Black represents the price when the report was produced
CRUDEOIL Intraday: Trend on the upside
Our pivot point is at 68.15
Preferable Price Action: Above pivot buy oil with 68.41 & 68.63 as targets.
Alternative Price Action: Sell crude below pivot with targets at 67.91 & 67.71 in extension.
Comment: RSI is at above 50 levels and pairs above its 20MA.
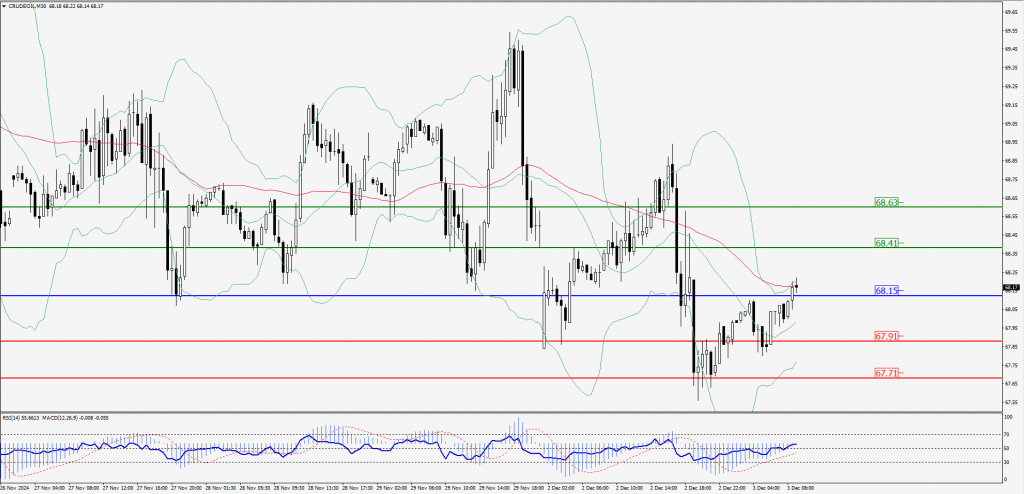
Green Lines Indicate Resistance Levels – Red Lines Indicate Support Levels
Light Blue is a Pivot Point – Black represents the price when the report was produced
XAU/USD Intraday: Trend on the upside
Our pivot point is at 2646.40
Preferable Price Action: Further upside to 2652.10 and 2657.50.
Alternative Price Action: If the price gives an downside breakout of a pivot, then the price extends to 2640.80 and 2635.40.
Comment: MACD is above 50 levels and pairs above its 55MA.
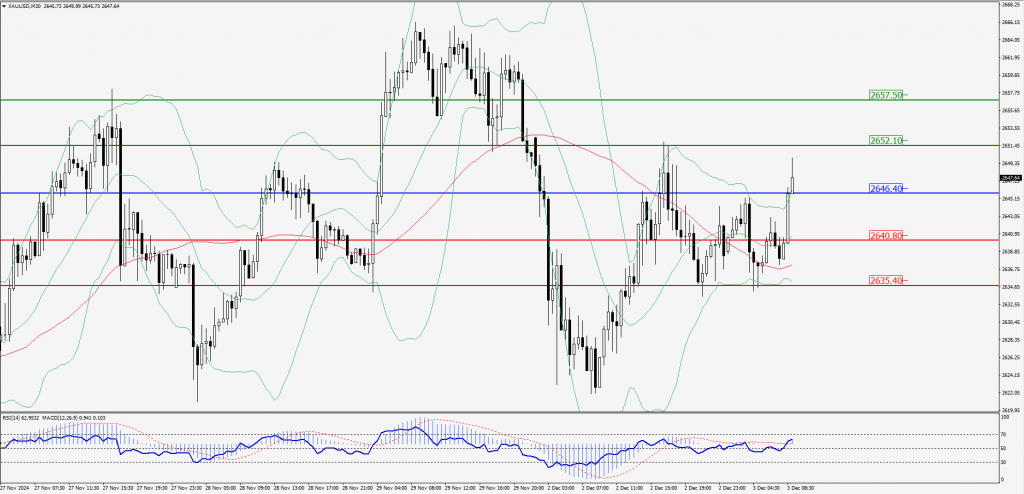
Green Lines Indicate Resistance Levels – Red Lines Indicate Support Levels
Light Blue is a Pivot Point – Black represents the price when the report was produced
Dow Jones Intraday: Trend on the downside
Our pivot point is 44,775.80
Preferable Price Action: Take sell positions below the pivot with targets at 44,729.00 & 44,688.60.
Alternative Price Action: Below 44,775.80 looks for further upside to 44,823.10 & 44,865.80.
Comment: RSI is below 50 levels and pairs below its 20MA & 55MA.
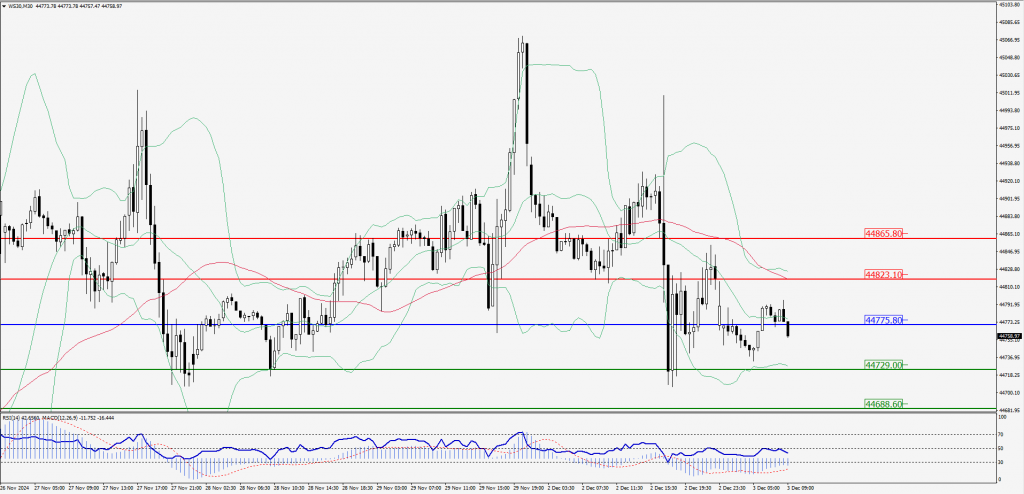
Green Lines Indicate Resistance Levels – Red Lines Indicate Support Levels
Light Blue is a Pivot Point – Black represents the price when the report was produced