Market Wrap: Stocks, Bonds, Commodities
Most Asian currencies edged lower on Thursday as the dollar steadied amid growing uncertainty over the path of U.S. interest rates, while the South Korean won fell sharply after the country’s central bank unexpectedly cut interest rates.
The Dow Jones Industrial Average fail 138.25 points to 44,722.06, the S&P 500 loss 0.38% to 5,998.70 and the Nasdaq Composite down 115.10 points to 19,060.48.
MSCI’s index of Asia-Pacific stocks outside Japan is down 0.25% to 704.15 levels. The Australian index was higher by 0.45% to 8,444.30. Japanese Nikkei Index increase 0.62% today.
European stocks were mixed on Thursday, with the Stoxx Europe 50 Index increase 0.64% to 4,763.35 Germany’s DAX ascend 0.61% to 19.378.25, and France’s CAC higher 0.35% to 7,168.35 and U.K.’s FTSE 100 loss 0.20% to 8,291.50.
Benchmark 10-year U.S. Treasury fail as demand for safe assets slipped again, today 10-year bond yields 0.16% to 4.2510.
Oil prices drifted lower on Thursday after a surprise jump in U.S. gasoline inventories, with investors focusing on the OPEC+ meeting this weekend to discuss oil output policy.
Spot Brent crude oil decrease 0.61% to $71.86 per barrel. US West Texas Intermediate crude is decrease 0.58% to $68.32 a barrel.
The yellow metal gold is down 0.10% to 2,662.01 dollars per ounce.
Market Wrap: Forex
The dollar steadied on Thursday helped by a surprise interest rate cut in South Korea, while the yen eyed its strongest week in three months on growing bets Japan hikes rates in December.
Today, the U.S. dollar index measures the Greenback against a trade-weighted basket of six major currencies, which either ascend 0.23% to 106.290.
The Euro US Dollar (EUR/USD) is a widely traded is down 0.22% today. This left the pair trading around $1.05410.
The Japanese yen was will move positive against the U.S. dollar on Thursday. Today USD/JPY is trades pair that increase 0.41% to the 151.72 level.
Another commodity-related currency negative against the U.S dollar, AUD/USD loss 0.15% to 0.64850, and NZD/USD decrease 0.08% to 0.58890 level.
EUR/USD Intraday: Trend on the downside
Our pivot point is at 1.05560
Preferable Price Action: Take sell positions below pivot level with targets at 1.05330 & 1.05120 in extension.
Alternative Price Action: Buy pivot looks for a further upside to 1.05790 & 1.06010.
Comment: RSI is below 50 levels and pairs below its 20MA.
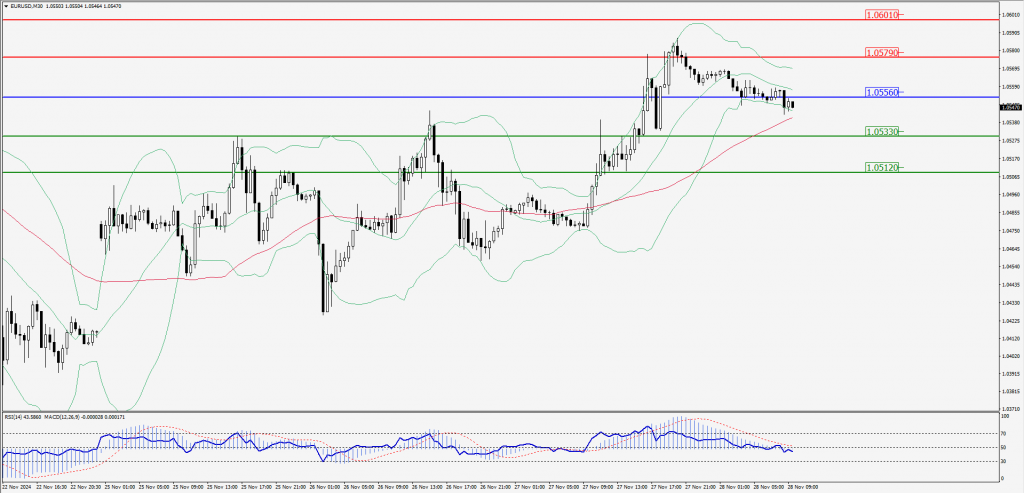
Green Lines Indicate Resistance Levels – Red Lines Indicate Support Levels
Light Blue is a Pivot Point – Black represents the price when the report was produced
GBP/USD Intraday: Trend on the downside
Our pivot point is at 1.26700
Preferable Price Action: Sell positions below pivot with targets at 1.26450 & 1.26210 in extension.
Alternative Price Action: The price above pivot would call for further upside to 1.26970 & 1.27190.
Comment: RSI is below 50 levels and pairs below its 20MA.
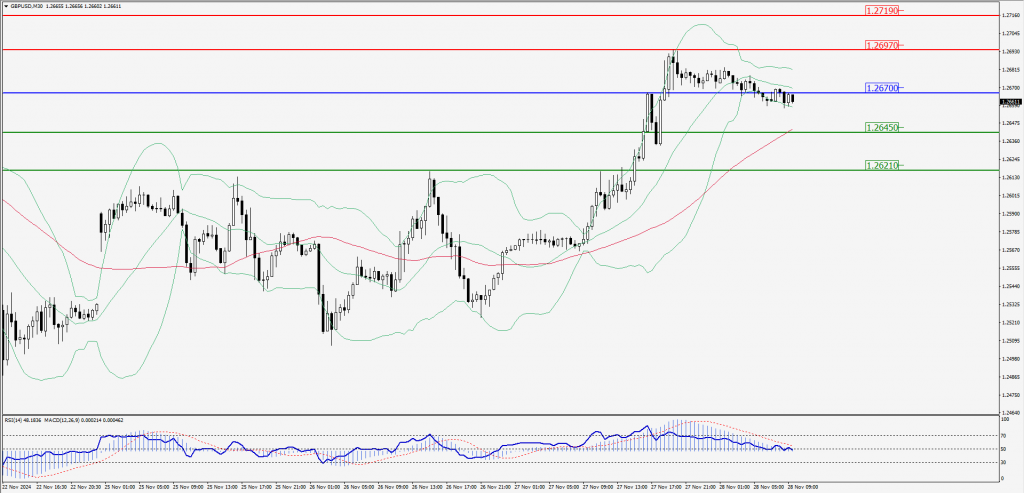
Green Lines Indicate Resistance Levels – Red Lines Indicate Support Levels
Light Blue is a Pivot Point – Black represents the price when the report was produced
USD/JPY Intraday: Trend on the upside
Our pivot point is at 151.460
Preferable Price Action: Buy position above pivot with the target at 151.950 and 152.400 in extension.
Alternative Price Action: The downside breakout of the pivot would call for 150.980 and 150.540.
Comment: MACD is above 50 levels and pairs above its 20MA.
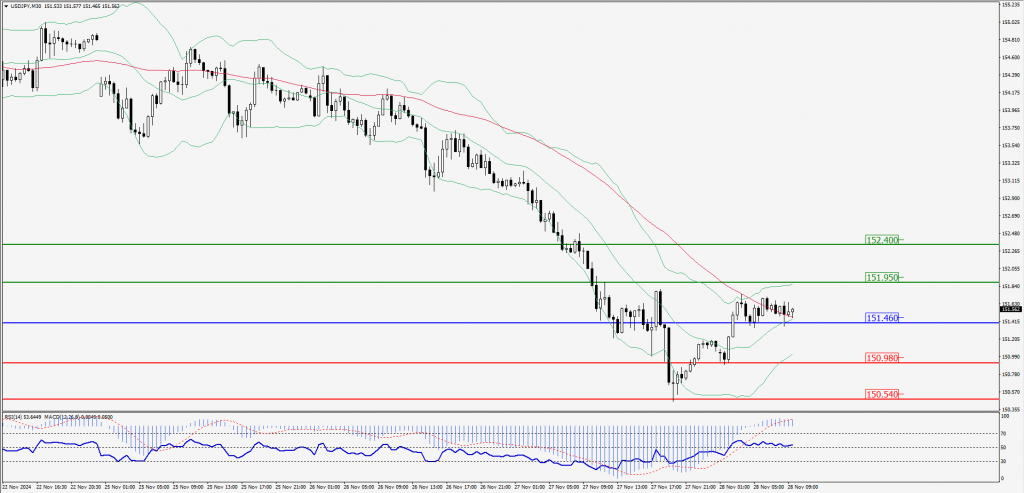
Green Lines Indicate Resistance Levels – Red Lines Indicate Support Levels
Light Blue is a Pivot Point – Black represents the price when the report was produced
AUD/USD Intraday: Trend on the downside
Our pivot point is at 0.64910
Preferable Price Action: Sell positions below pivot with targets at 0.64760 & 0.64630 in extension.
Alternative Price Action: Above pivot a further upside with 0.65050 & 0.65180 as targets.
Comment: RSI is below 50 levels and pairs below its 55MA & 20MA.
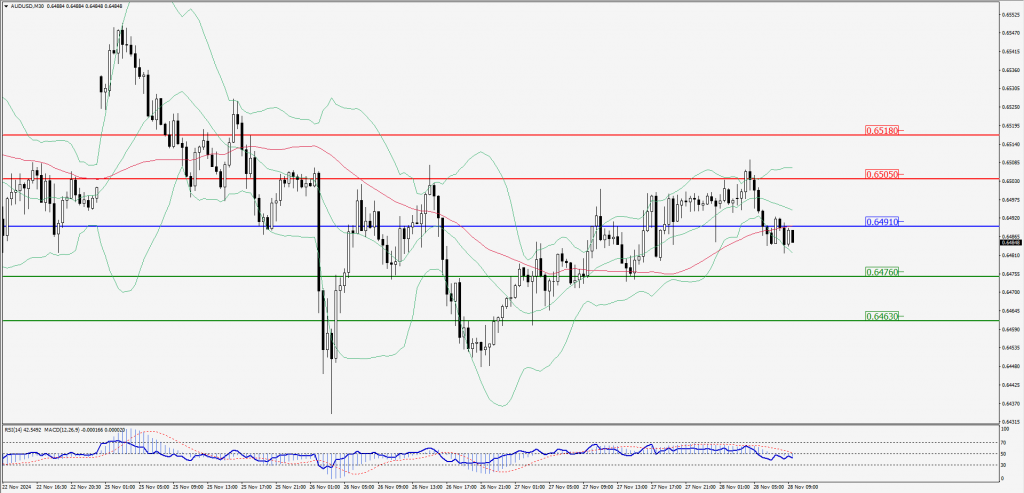
Green Lines Indicate Resistance Levels – Red Lines Indicate Support Levels
Light Blue is a Pivot Point – Black represents the price when the report was produced
CRUDEOIL Intraday: Trend on the downside
Our pivot point is at 68.73
Preferable Price Action: Below pivot sell oil with 68.33 & 67.99 as targets.
Alternative Price Action: Buy crude above pivot with targets at 69.12 & 69.48 in extension.
Comment: RSI is at below 50 levels and pairs below its 55MA.
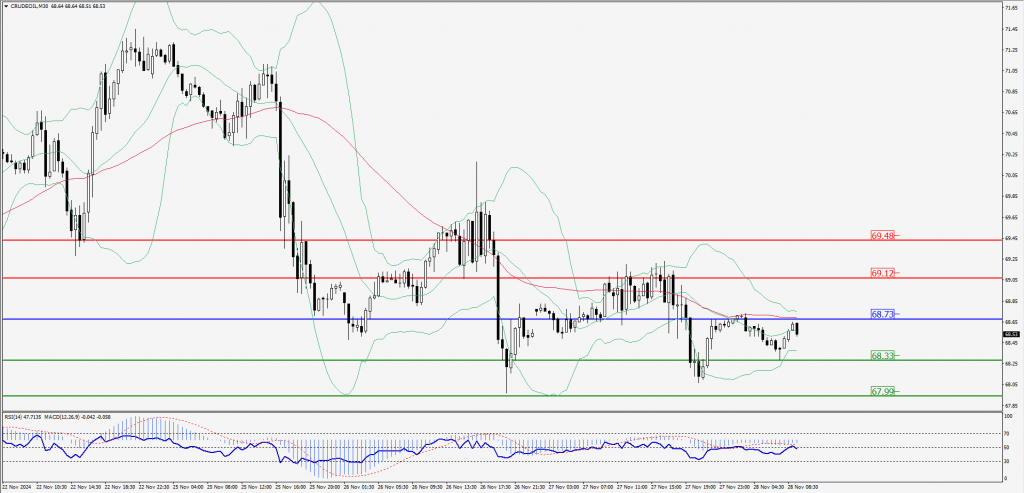
Green Lines Indicate Resistance Levels – Red Lines Indicate Support Levels
Light Blue is a Pivot Point – Black represents the price when the report was produced
XAU/USD Intraday: Trend on the upside
Our pivot point is at 2633.50
Preferable Price Action: Further upside to 2648.80 and 2660.40.
Alternative Price Action: If the price gives an downside breakout of a pivot, then the price extends to 2619.40 and 2608.80.
Comment: MACD is above 50 levels and pairs above its 20MA.
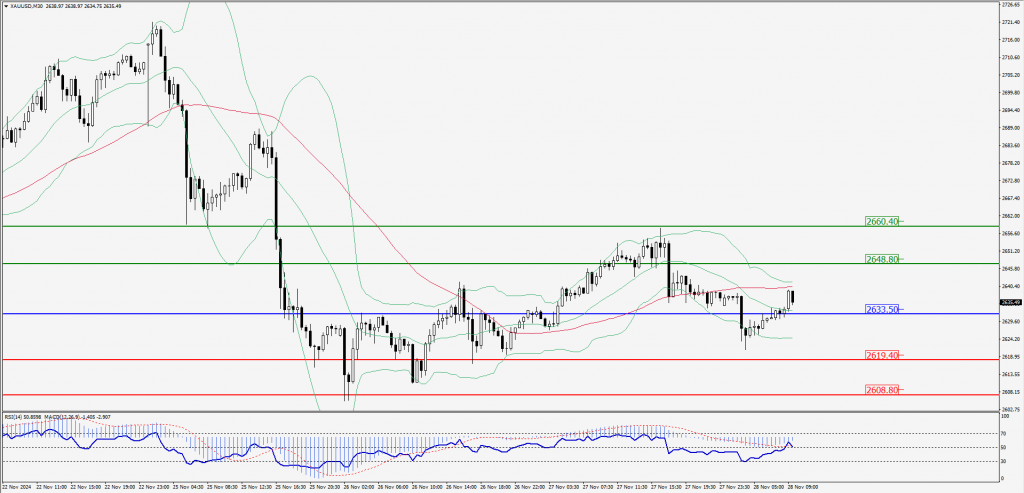
Green Lines Indicate Resistance Levels – Red Lines Indicate Support Levels
Light Blue is a Pivot Point – Black represents the price when the report was produced
Dow Jones Intraday: Trend on the downside
Our pivot point is 44,820.30
Preferable Price Action: Take sell positions below the pivot with targets at 44,699.70 & 44,588.10.
Alternative Price Action: Below 44,820.30 looks for further upside to 44,942.80 & 45,048.80.
Comment: RSI is below 50 levels and pairs below its 55MA.
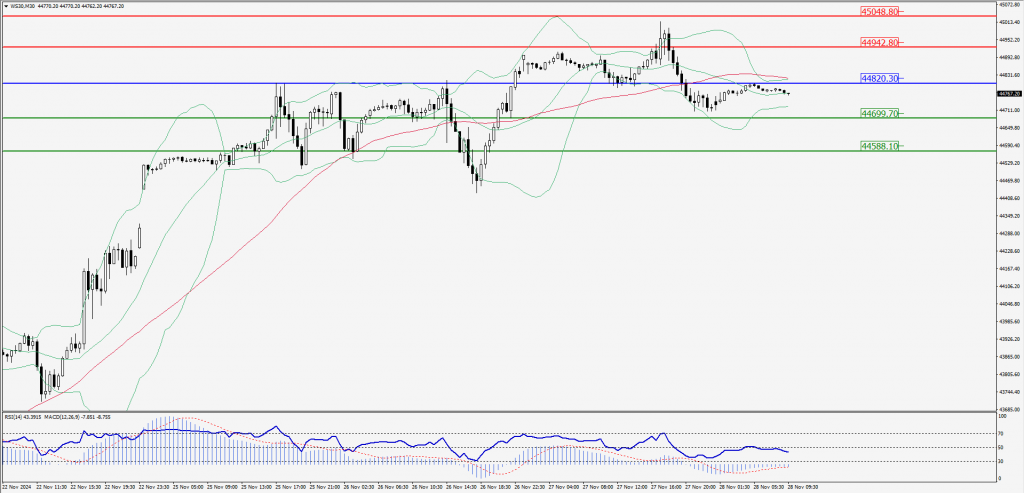
Green Lines Indicate Resistance Levels – Red Lines Indicate Support Levels
Light Blue is a Pivot Point – Black represents the price when the report was produced