Market Wrap: Stocks, Bonds, Commodities
Most Asian currencies edged lower on Tuesday, with the Chinese yuan dropping to a four-month low against a stronger dollar after U.S. President-elect Donald Trump said he will impose additional trade tariffs on China, Mexico, and Canada.
The Dow Jones Industrial Average rose 440.06 points to 44,736.57, the S&P 500 gain 0.30% to 5,987.40 and the Nasdaq Composite up 51.18 points to 19,054.84.
MSCI’s index of Asia-Pacific stocks outside Japan is up 0.06% to 706.57 levels. The Australian index was lower by 0.69% to 8,359.40. Japanese Nikkei Index decrease 0.84% today.
European stocks were mixed on Tuesday, with the Stoxx Europe 50 Index increase 0.21% to 4,799.35 Germany’s DAX ascend 0.43% to 19.405.20, and France’s CAC lower 0.03% to 7,257.47 and U.K.’s FTSE 100 gain 0.36% to 8,291.68.
Benchmark 10-year U.S. Treasury rose as demand for safe assets slipped again, today 10-year bond yields 0.52% to 4.2870.
Oil prices ticked up in early trade on Tuesday after falling in the previous session as investors took stock of a potential ceasefire between Israel and Hezbollah, weighing on oil’s risk premium.
Spot Brent crude oil increase 0.14% to $72.58 per barrel. US West Texas Intermediate crude is increase 0.20% to $69.08 a barrel.
The yellow metal gold is up 0.15% to 2,646.60 dollars per ounce.
Market Wrap: Forex
The Mexican peso, and the Canadian dollar fell sharply on Tuesday against the U.S. dollar, while the offshore Chinese yuan inched lower after the President-elect Donald Trump said he would impose a 25% tariff on all products from Mexico and Canada, and an additional 10% tariff on goods from China, citing concerns over illegal immigration and the trade of illicit drugs.
Today, the U.S. dollar index measures the Greenback against a trade-weighted basket of six major currencies, which either ascend 0.30% to 107.087.
The Euro US Dollar (EUR/USD) is a widely traded is down 0.17% today. This left the pair trading around $1.04760.
The Japanese yen was will move negative against the U.S. dollar on Tuesday. Today USD/JPY is trades pair that decrease 0.09% to the 154.06 level.
Another commodity-related currency negative against the U.S dollar, AUD/USD loss 0.30% to 0.64820, and NZD/USD decrease 0.12% to 0.58380 level.
EUR/USD Intraday: Trend on the upside
Our pivot point is at 1.04770
Preferable Price Action: Take buy positions above pivot level with targets at 1.05070 & 1.05330 in extension.
Alternative Price Action: Sell pivot looks for a further downside to 1.04460 & 1.04200.
Comment: RSI is above 50 levels and pairs above its 20MA.
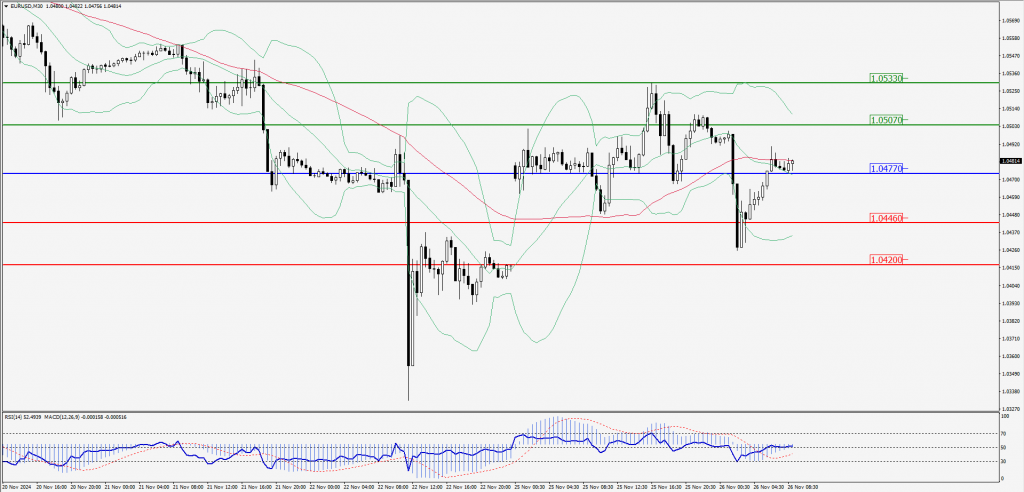
Green Lines Indicate Resistance Levels – Red Lines Indicate Support Levels
Light Blue is a Pivot Point – Black represents the price when the report was produced
GBP/USD Intraday: Trend on the downside
Our pivot point is at 1.25580
Preferable Price Action: Sell positions below pivot with targets at 1.25330 & 1.25120 in extension.
Alternative Price Action: The price above pivot would call for further upside to 1.25830 & 1.26050.
Comment: RSI is below 50 levels and pairs below its 55MA.
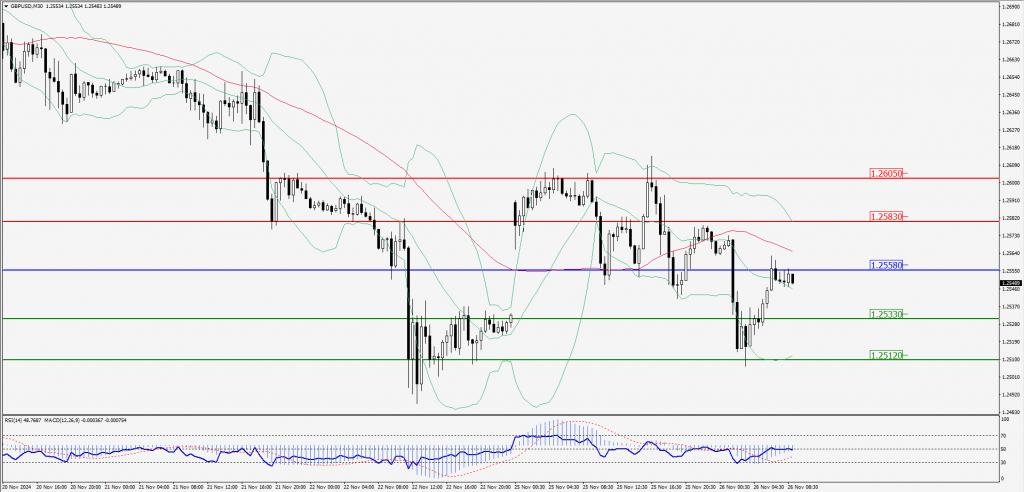
Green Lines Indicate Resistance Levels – Red Lines Indicate Support Levels
Light Blue is a Pivot Point – Black represents the price when the report was produced
USD/JPY Intraday: Trend on the downside
Our pivot point is at 154.040
Preferable Price Action: Sell position below pivot with the target at 153.770 and 153.540 in extension.
Alternative Price Action: The upside breakout of the pivot would call for 154.320 and 154.580.
Comment: MACD is below 50 levels and pairs below its 55MA & 20MA.
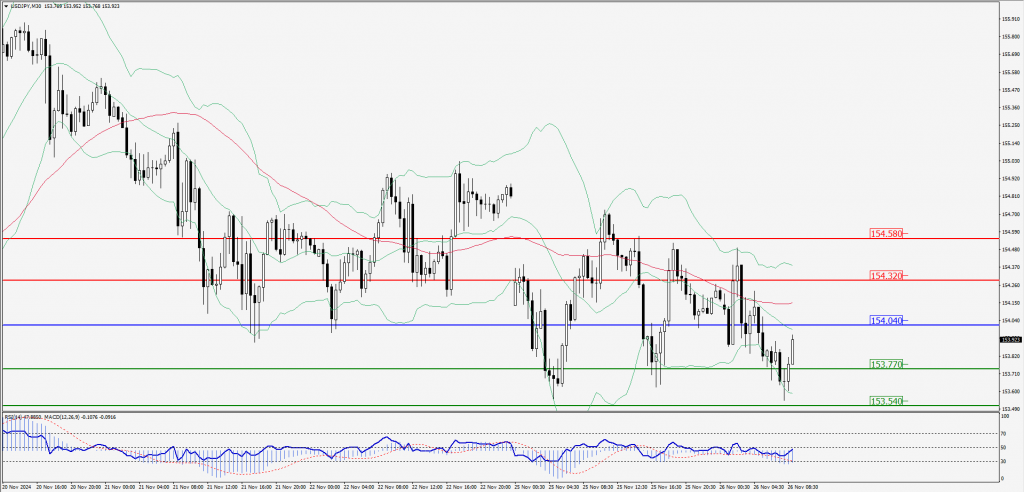
Green Lines Indicate Resistance Levels – Red Lines Indicate Support Levels
Light Blue is a Pivot Point – Black represents the price when the report was produced
AUD/USD Intraday: Trend on the downside
Our pivot point is at 0.64920
Preferable Price Action: Sell positions below pivot with targets at 0.64790 & 0.64680 in extension.
Alternative Price Action: Above pivot a further upside with 0.65050 & 0.65160 as targets.
Comment: RSI is below 50 levels and pairs below its 55MA.
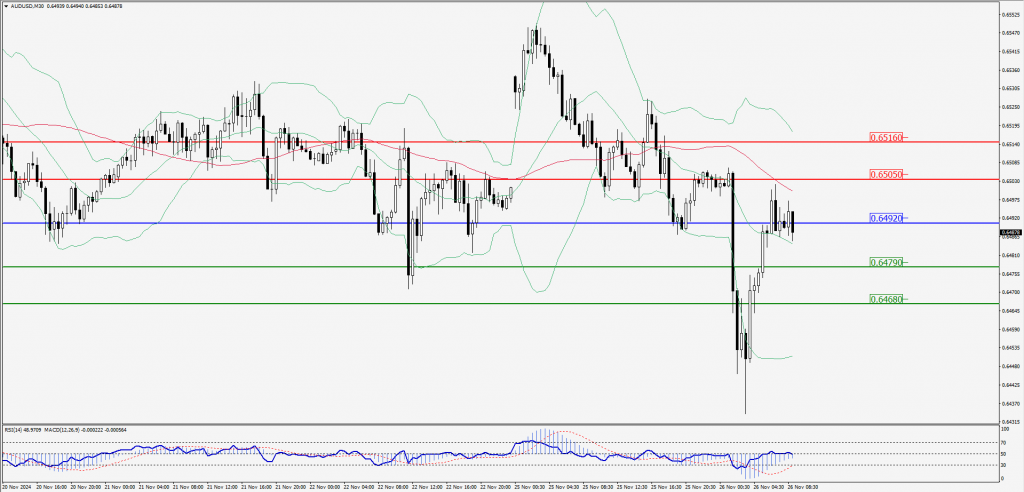
Green Lines Indicate Resistance Levels – Red Lines Indicate Support Levels
Light Blue is a Pivot Point – Black represents the price when the report was produced
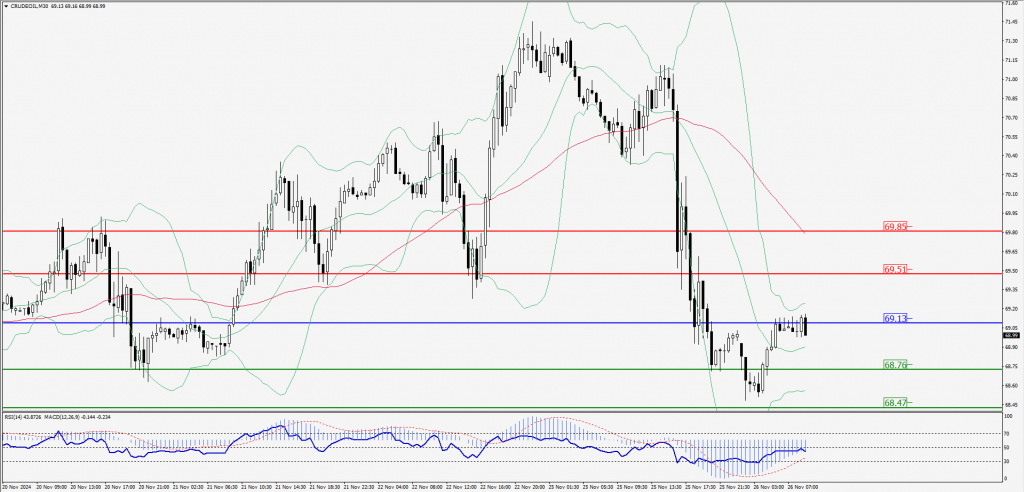
CRUDEOIL Intraday: Trend on the downside
Our pivot point is at 69.13
Preferable Price Action: Below pivot sell oil with 68.76 & 68.47 as targets.
Alternative Price Action: Buy crude above pivot with targets at 69.51 & 69.85 in extension.
Comment: RSI is at below 50 levels and pairs below its 55MA.
Green Lines Indicate Resistance Levels – Red Lines Indicate Support Levels
Light Blue is a Pivot Point – Black represents the price when the report was produced
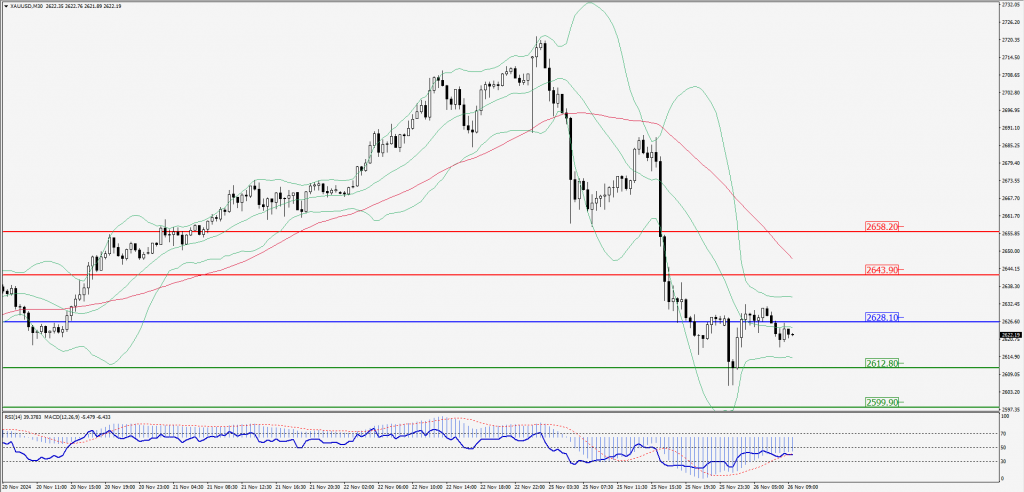
XAU/USD Intraday: Trend on the downside
Our pivot point is at 2628.10
Preferable Price Action: Further downside to 2612.80 and 2599.90.
Alternative Price Action: If the price gives an upside breakout of a pivot, then the price extends to 2643.90 and 2658.20.
Comment: MACD is below 50 levels and pairs below its 20MA & 55MA.
Green Lines Indicate Resistance Levels – Red Lines Indicate Support Levels
Light Blue is a Pivot Point – Black represents the price when the report was produced
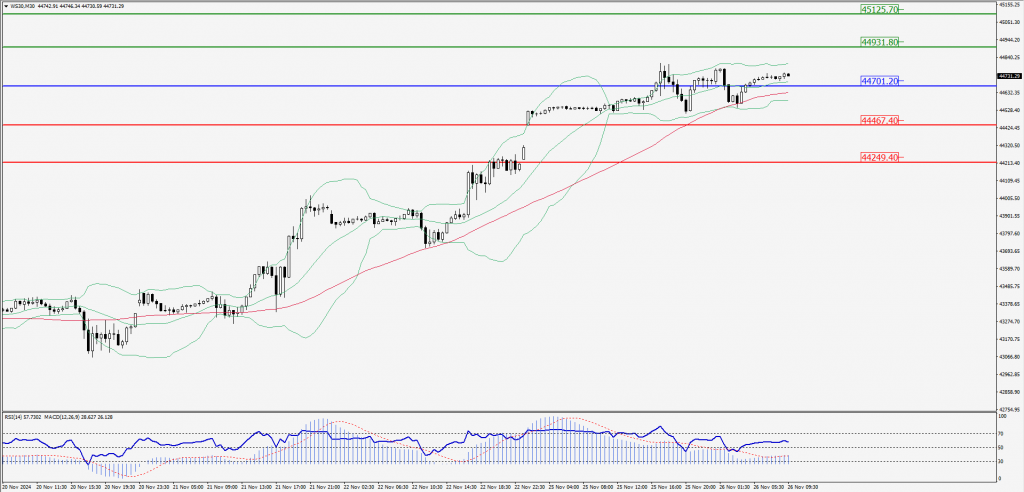
Dow Jones Intraday: Trend on the upside
Our pivot point is 44,701.20
Preferable Price Action: Take buy positions above the pivot with targets at 44,931.80 & 45,125.70.
Alternative Price Action: Below 44,701.20 looks for further downside to 44,467.40 & 44,249.40.
Comment: RSI is above 50 levels and pairs above its 55MA & 20MA.
Green Lines Indicate Resistance Levels – Red Lines Indicate Support Levels
Light Blue is a Pivot Point – Black represents the price when the report was produced