Market Wrap: Stocks, Bonds, Commodities
Indonesia’s central bank is ready to stabilize the rupiah, including through intervention if there was excessive volatility, an official said on Wednesday after the currency weakened as traders reacted to incoming U.S. election results.
The Dow Jones Industrial Average rose 427.28 points to 42,221.88, the S&P 500 gain 1.23% to 5,782.76 and the Nasdaq Composite up 259.19 points to 18,439.17.
MSCI’s index of Asia-Pacific stocks outside Japan is down 0.05% to 734.87 levels. The Australian index was higher by 0.83% to 8,199.50. Japanese Nikkei Index increase 2.16% today.
European stocks were mixed on Wednesday, with the Stoxx Europe 50 Index increase 0.39% to 4,871.25 Germany’s DAX ascend 0.57% to 19.256.27, and France’s CAC higher 0.48% to 7,407.15 and U.K.’s FTSE 100 loss 0.14% to 8,172.39.
Benchmark 10-year U.S. Treasury rose as demand for safe assets slipped again, today 10-year bond yields 3.38% to 4.4370.
Commodities from oil to metals and grains slid on Wednesday as the dollar strengthened, with investors increasingly pricing in that Donald Trump will win the U.S. presidential election.
Spot Brent crude oil decrease 1.48% to $74.41 per barrel. US West Texas Intermediate crude is decrease 1.35% to $71.02 a barrel.
The yellow metal gold is down 0.68% to 2,731.05 dollars per ounce.
Market Wrap: Forex
The dollar surged to a near four-month high on Wednesday, while Asian currencies fell across the board as early vote counting showed Donald Trump squarely in the lead in the 2024 presidential election.
Today, the U.S. dollar index measures the Greenback against a trade-weighted basket of six major currencies, which either ascend 1.60% to 105.08.
The Euro US Dollar (EUR/USD) is a widely traded is either up or down 1.75% today. This left the pair trading around $1.07390.
The Japanese yen was will move positive against the U.S. dollar on Wednesday. Today USD/JPY is trades pair that increase 1.60% to the 154.03 level.
Another commodity-related currency negative against the U.S dollar, AUD/USD loss 1.37% to 0.65440, and NZD/USD decrease 1.21% to 0.59300 level.
EUR/USD Intraday: Major trend on the downside
Our pivot point is at 1.07230
Preferable Price Action: Take sell positions below pivot level with targets at 1.06920 & 1.06670 in extension.
Alternative Price Action: Buy pivot looks for a further upside to 1.07560 & 1.07830.
Comment: RSI is below 50 levels and pairs below its 55MA & 20MA.
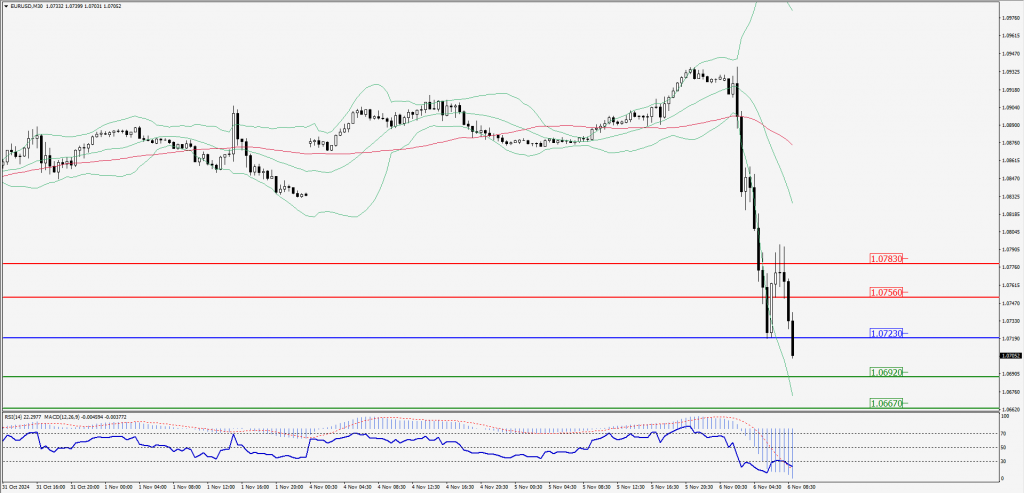
Green Lines Indicate Resistance Levels – Red Lines Indicate Support Levels
Light Blue is a Pivot Point – Black represents the price when the report was produced
GBP/USD Intraday: Major trend on the downside
Our pivot point is at 1.28690
Preferable Price Action: Sell positions below pivot with targets at 1.28470 & 1.28270 in extension.
Alternative Price Action: The price above pivot would call for further upside to 1.28920 & 1.29120.
Comment: RSI is below 50 levels and pairs below its 20MA & 55MA.
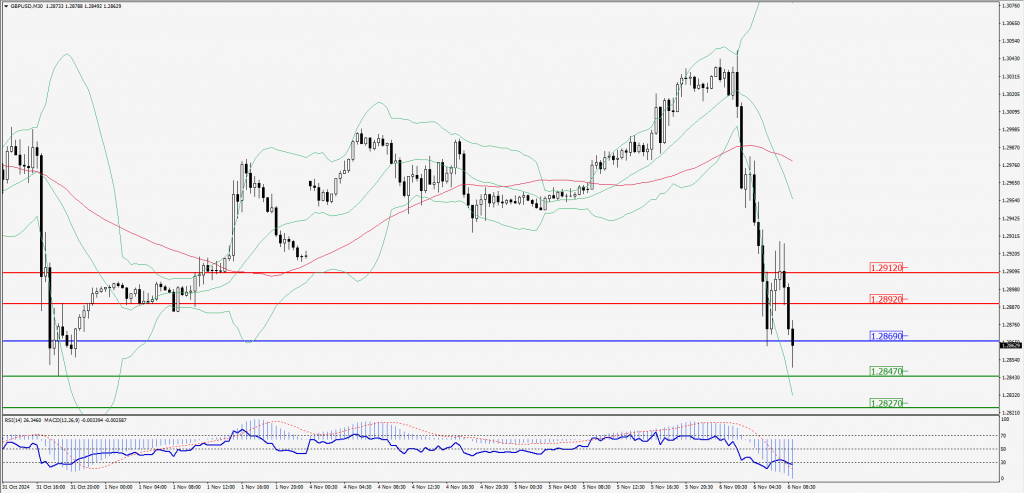
Green Lines Indicate Resistance Levels – Red Lines Indicate Support Levels
Light Blue is a Pivot Point – Black represents the price when the report was produced
USD/JPY Intraday: Major trend on the upside
Our pivot point is at 154.180
Preferable Price Action: Buy position above pivot with the target at 154.700 and 155.130 in extension.
Alternative Price Action: The downside breakout of the pivot would call for 153.680 and 153.270.
Comment: MACD is above 50 levels and pairs above its 55MA & 20MA.
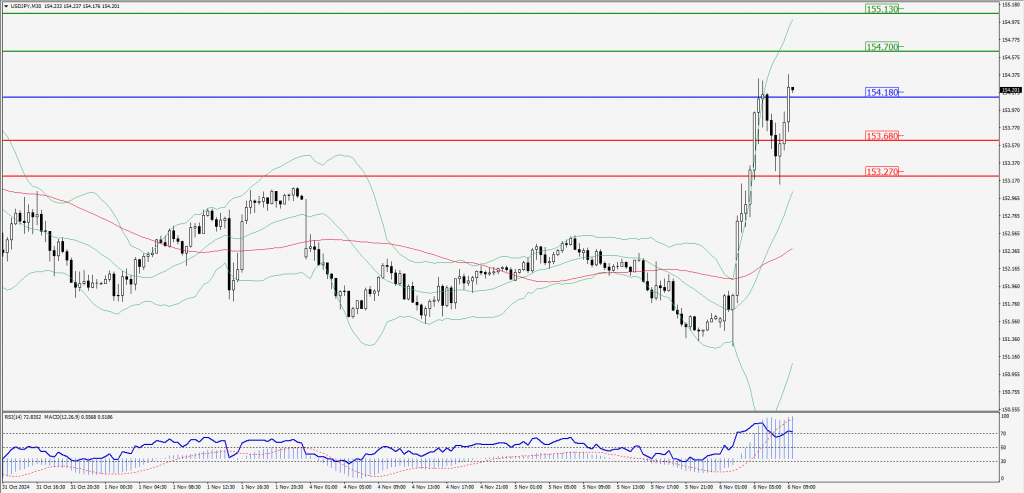
Green Lines Indicate Resistance Levels – Red Lines Indicate Support Levels
Light Blue is a Pivot Point – Black represents the price when the report was produced
AUD/USD Intraday: Major trend on the downside
Our pivot point is at 0.65340
Preferable Price Action: Sell positions below pivot with targets at 0.65200 & 0.65070 in extension.
Alternative Price Action: Above pivot a further upside with 0.65490 & 0.65620 as targets.
Comment: RSI is below 50 levels and pairs below its 55MA & 20MA.
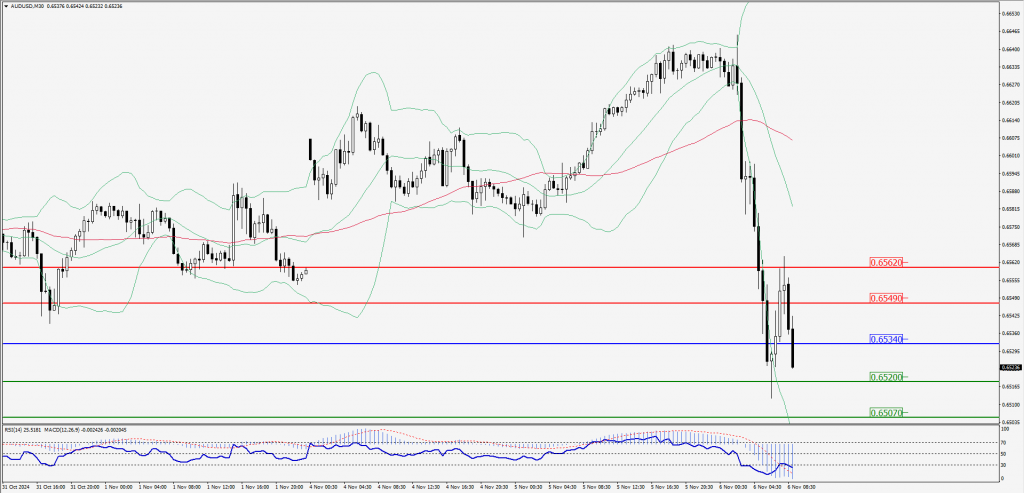
Green Lines Indicate Resistance Levels – Red Lines Indicate Support Levels
Light Blue is a Pivot Point – Black represents the price when the report was produced
CRUDEOIL Intraday: Major trend on the downside
Our pivot point is at 70.53
Preferable Price Action: Below pivot sell oil with 70.01 & 69.59 as targets.
Alternative Price Action: Buy crude above pivot with targets at 71.02 & 71.51 in extension.
Comment: RSI is at below 50 levels and pairs below its 20MA & 55MA.
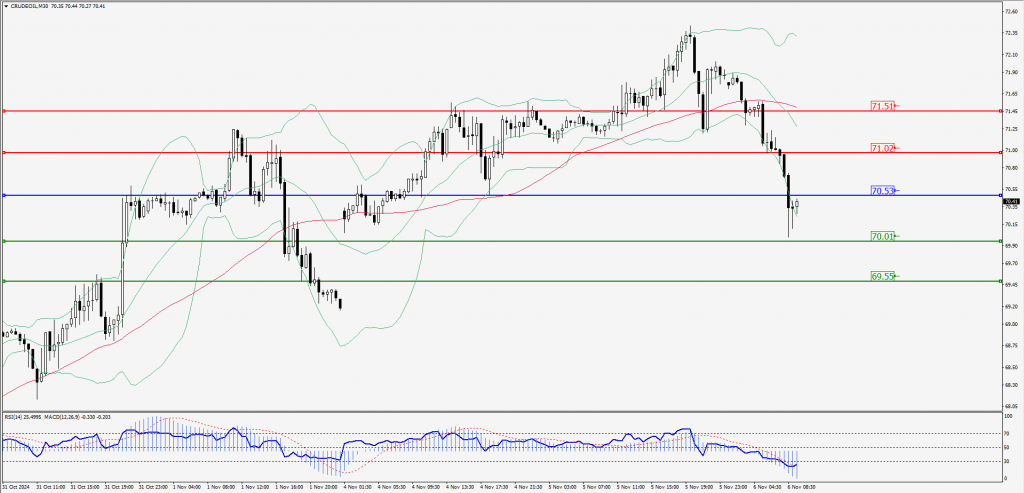
Green Lines Indicate Resistance Levels – Red Lines Indicate Support Levels
Light Blue is a Pivot Point – Black represents the price when the report was produced
XAU/USD Intraday: Major trend on the downside
Our pivot point is at 2716.00
Preferable Price Action: Further upside to 2705.30 and 2696.50.
Alternative Price Action: If the price gives an upside breakout of a pivot, then the price extends to 2727.70 and 2736.90.
Comment: MACD is below 50 levels and pairs below its 20MA & 55MA.
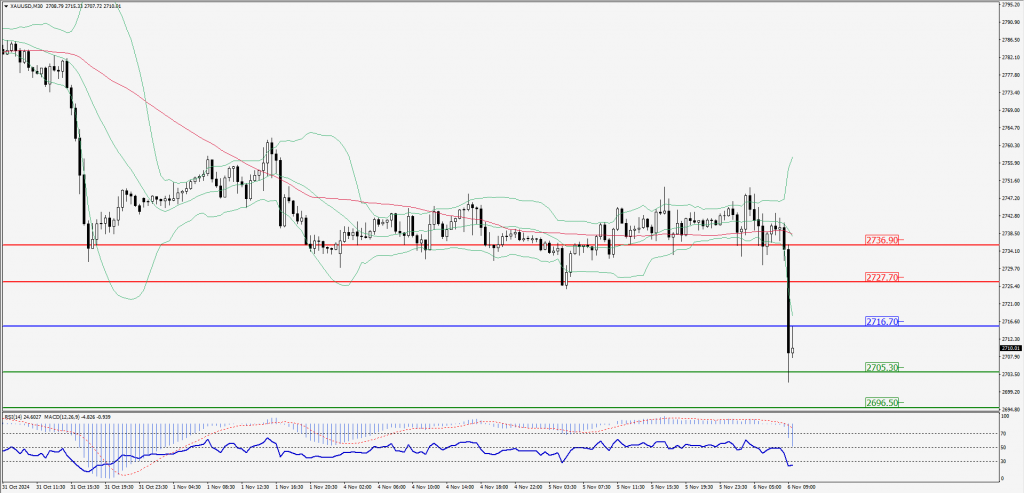
Green Lines Indicate Resistance Levels – Red Lines Indicate Support Levels
Light Blue is a Pivot Point – Black represents the price when the report was produced
Dow Jones Intraday: Major trend on the upside
Our pivot point is 42,910.80
Preferable Price Action: Take buy positions above the pivot with targets at 43,071.50 & 43,214.60.
Alternative Price Action: Below 42,910.80 looks for further downside to 42,745.40 & 42,589.50.
Comment: RSI is above 50 levels and pairs above its 20MA & 55MA.
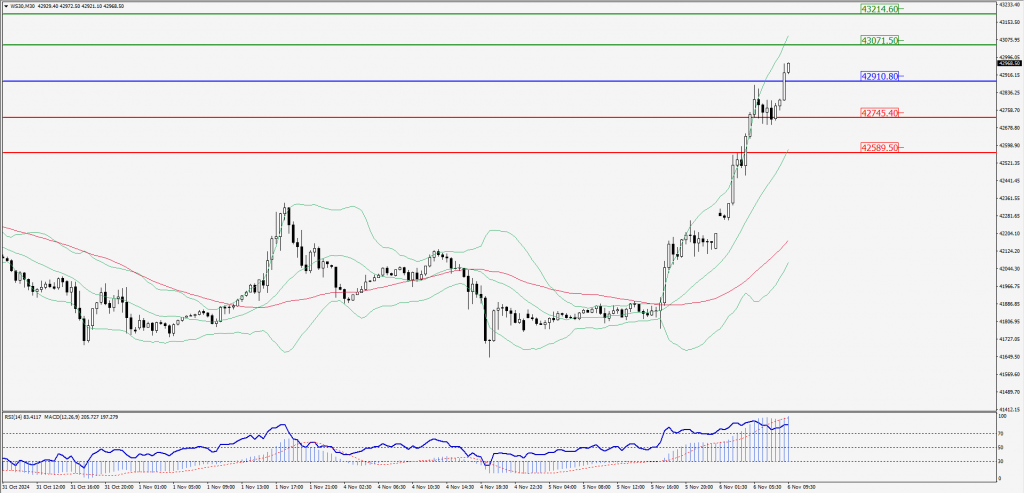
Green Lines Indicate Resistance Levels – Red Lines Indicate Support Levels
Light Blue is a Pivot Point – Black represents the price when the report was produced