Market Wrap: Stocks, Bonds, Commodities
Most Asian currencies kept to a tight range on Tuesday, while the dollar steadied from recent losses as focus remained squarely on a tight U.S. presidential race and an upcoming Federal Reserve meeting.
The Dow Jones Industrial Average fail 257.59 points to 41,794.60, the S&P 500 loss 0.28% to 5,712.69 and the Nasdaq Composite up 59.94 points to 18,179.98.
MSCI’s index of Asia-Pacific stocks outside Japan is up 1.21% to 739.51 levels. The Australian index was lower by 0.40% to 8,131.80. Japanese Nikkei Index increase 1.42% today.
European stocks were mixed on Tuesday, with the Stoxx Europe 50 Index increase 0.08% to 4,855.95 Germany’s DAX ascend 0.04% to 19.171.65, and France’s CAC higher 0.08% to 7,377.65 and U.K.’s FTSE 100 loss 0.06% to 8,179.42.
Benchmark 10-year U.S. Treasury rose as demand for safe assets slipped again, today 10-year bond yields 0.09% to 4.3180.
Oil prices traded in a narrow range on Tuesday ahead of what is expected to be an exceptionally close U.S. presidential election, after rising more than 2% in the previous session as OPEC+ delayed plans to hike production in December.
Spot Brent crude oil increase 0.28% to $75.29 per barrel. US West Texas Intermediate crude is increase 0.35% to $71.72 a barrel.
The yellow metal gold is down 0.08% to 2,743.90 dollars per ounce.
Market Wrap: Forex
The dollar softened on Tuesday as traders squared positions on the day of the U.S. presidential election, after recent polls dented some market bets on a victory for Republican Donald Trump.
Today, the U.S. dollar index measures the Greenback against a trade-weighted basket of six major currencies, which either descend 0.06% to 103.82.
The Euro US Dollar (EUR/USD) is a widely traded is either up or up 0.10% today. This left the pair trading around $1.08880.
The Japanese yen was will move positive against the U.S. dollar on Tuesday. Today USD/JPY is trades pair that increase 0.12% to the 152.31 level.
Another commodity-related currency positive against the U.S dollar, AUD/USD gain 0.40% to 0.66110, and NZD/USD increase 0.38% to 0.59950 level.
EUR/USD Intraday: Trend on the downside
Our pivot point is at 1.08840
Preferable Price Action: Take sell positions below pivot level with targets at 1.08700 & 1.08570 in extension.
Alternative Price Action: Buy pivot looks for a further upside to 1.08980 & 1.09100.
Comment: RSI is below 50 levels and pairs below its 55MA.
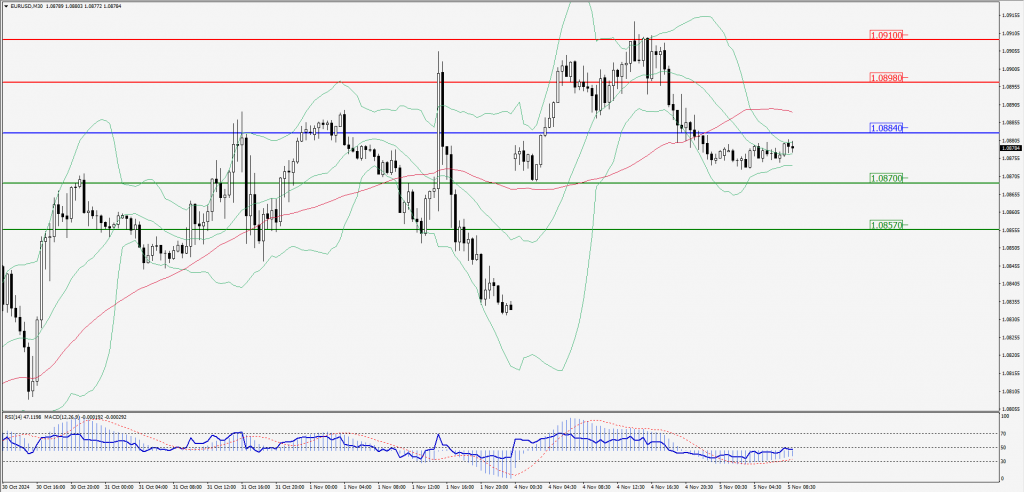
Green Lines Indicate Resistance Levels – Red Lines Indicate Support Levels
Light Blue is a Pivot Point – Black represents the price when the report was produced
GBP/USD Intraday: Trend on the upside
Our pivot point is at 1.29590
Preferable Price Action: Buy positions above pivot with targets at 1.29870 & 1.30100 in extension.
Alternative Price Action: The price below pivot would call for further downside to 1.29320 & 1.29090.
Comment: RSI is above 50 levels and pairs above its 20MA.
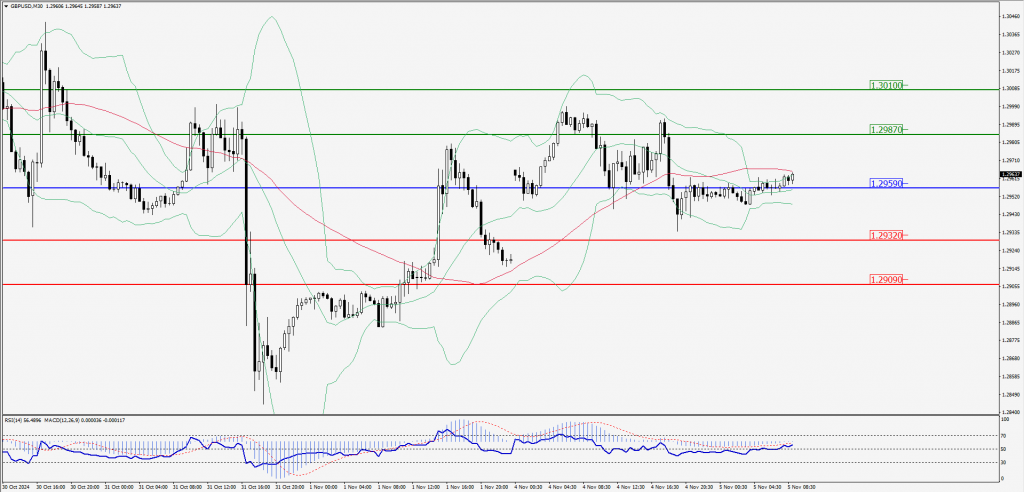
Green Lines Indicate Resistance Levels – Red Lines Indicate Support Levels
Light Blue is a Pivot Point – Black represents the price when the report was produced
USD/JPY Intraday: Trend on the upside
Our pivot point is at 152.300
Preferable Price Action: Buy position above pivot with the target at 152.580 and 152.850 in extension.
Alternative Price Action: The downside breakout of the pivot would call for 152.020 and 151.750.
Comment: MACD is above 50 levels and pairs above its 55MA & 20MA.
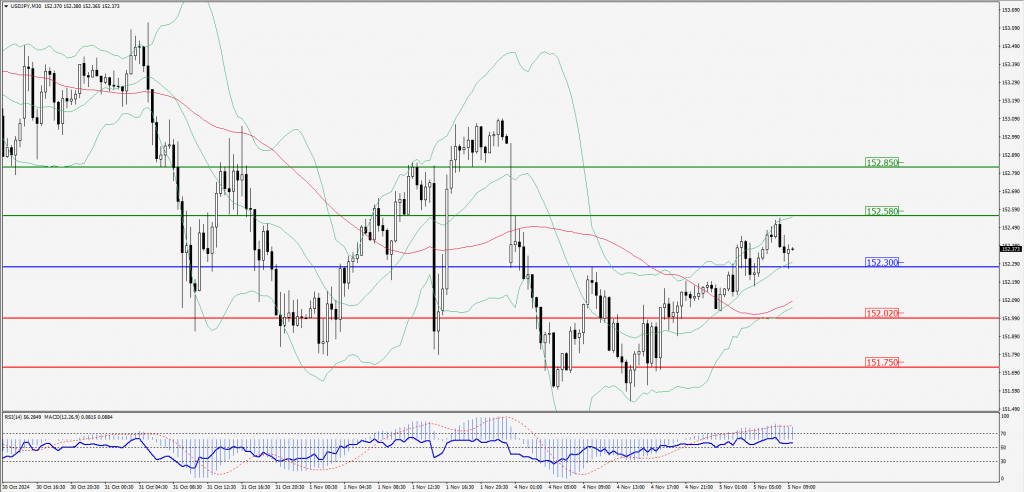
Green Lines Indicate Resistance Levels – Red Lines Indicate Support Levels
Light Blue is a Pivot Point – Black represents the price when the report was produced
AUD/USD Intraday: Trend on the upside
Our pivot point is at 0.66000
Preferable Price Action: Buy positions above pivot with targets at 0.66100 & 0.66200 in extension.
Alternative Price Action: Below pivot a further downside with 0.65900 & 0.65800 as targets.
Comment: RSI is above 50 levels and pairs above its 55MA & 20MA.
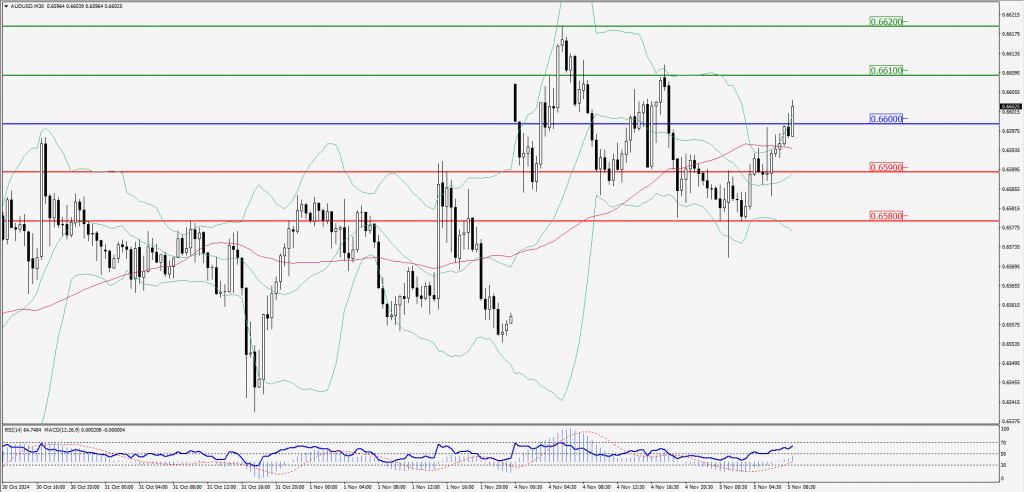
Green Lines Indicate Resistance Levels – Red Lines Indicate Support Levels
Light Blue is a Pivot Point – Black represents the price when the report was produced
CRUDEOIL Intraday: Trend on the downside
Our pivot point is at 71.36
Preferable Price Action: Below pivot sell oil with 70.89 & 70.43 as targets.
Alternative Price Action: Buy crude above pivot with targets at 71.82 & 72.27 in extension.
Comment: RSI is at below 50 levels and pairs below its 20MA.
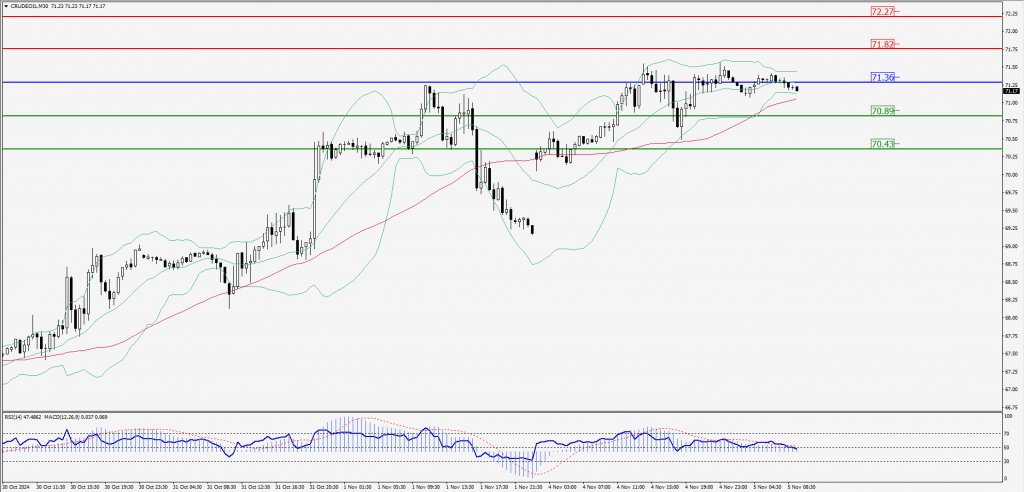
Green Lines Indicate Resistance Levels – Red Lines Indicate Support Levels
Light Blue is a Pivot Point – Black represents the price when the report was produced
XAU/USD Intraday: Trend on the upside
Our pivot point is at 2736.00
Preferable Price Action: Further upside to 2744.10 and 2751.60.
Alternative Price Action: If the price gives an downside breakout of a pivot, then the price extends to 2728.00 and 2721.00.
Comment: MACD is above 50 levels and pairs above its 20MA.
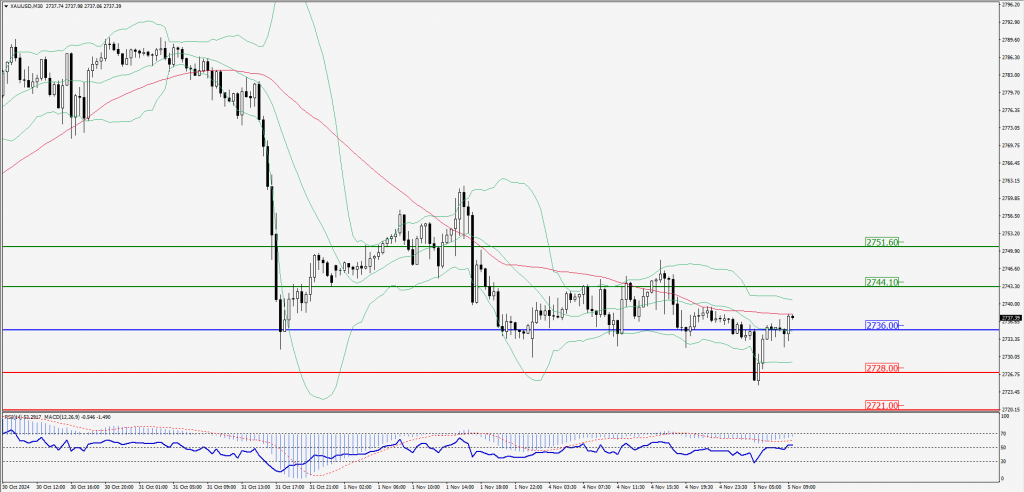
Green Lines Indicate Resistance Levels – Red Lines Indicate Support Levels
Light Blue is a Pivot Point – Black represents the price when the report was produced
Dow Jones Intraday: Trend on the upside
Our pivot point is 42,838.90
Preferable Price Action: Take buy positions above the pivot with targets at 41,951.70 & 42,051.80.
Alternative Price Action: Below 42,838.90 looks for further downside to 41,733.00 & 41,641.00.
Comment: RSI is above 50 levels and pairs above its 20MA.
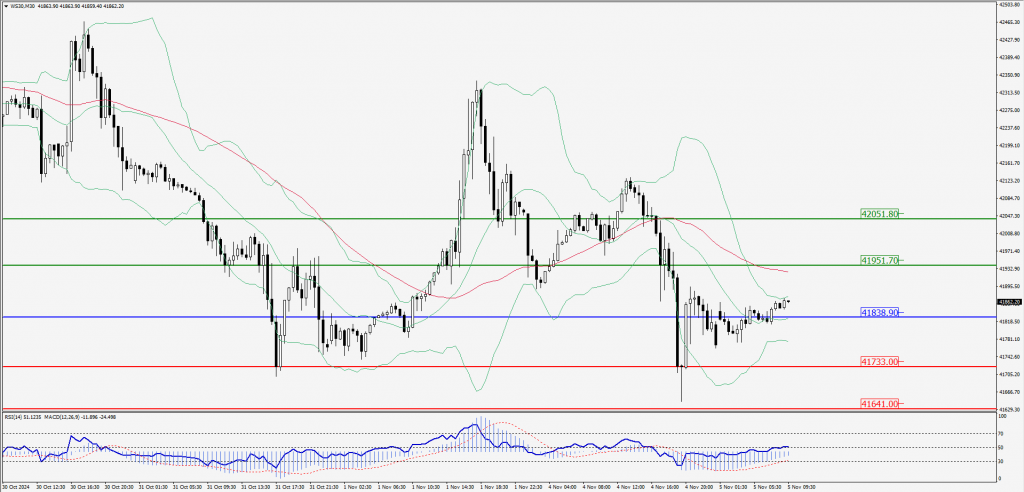
Green Lines Indicate Resistance Levels – Red Lines Indicate Support Levels
Light Blue is a Pivot Point – Black represents the price when the report was produced