Market Wrap: Stocks, Bonds, Commodities
Most Asian currencies weakened on Monday with the Japanese yen sliding to a three-month low amid bets that the loss of a parliamentary majority for Japan’s ruling party diminished the prospect of higher interest rates in the country.
The Dow Jones Industrial Average fail 259.96 points to 42,114.40, the S&P 500 loss 0.03% to 5,808.10 and the Nasdaq Composite either up or down 0.01 points to 18,518.61.
MSCI’s index of Asia-Pacific stocks outside Japan is up 0.32% to 740.74 levels. The Australian index was higher by 0.12% to 8,221.50. Japanese Nikkei Index increase 2.01% today.
European stocks were mixed on Monday, with the Stoxx Europe 50 Index increase 0.15% to 4,942.65 Germany’s DAX ascend 0.11% to 19,463.59, and France’s CAC lower 0.08% to 7,497.54 and U.K.’s FTSE 100 loss 0.25% to 8,248.84.
Benchmark 10-year U.S. Treasury rose as demand for safe assets slipped again, today 10-year bond yields 1.49% to 4.2980.
Oil prices fell sharply in early Asian trade on Monday, weighed by easing fears of a Middle East war after an Israeli strike against Iran, over the weekend, was less severe than feared.
Spot Brent crude oil decrease 4.09% to $72.54 per barrel. US West Texas Intermediate crude is decrease 4.39% to $68.62 a barrel.
The yellow metal gold is down 0.01% to 2,754.50 dollars per ounce.
Market Wrap: Forex
British business confidence sank to a four-month low in October ahead of the first budget plan from the country’s new government, a survey showed on Monday, echoing other signs of corporate nervousness about possible tax increases.
Today, the U.S. dollar index measures the Greenback against a trade-weighted basket of six major currencies, which increase 0.18% to 104.315.
The Euro US Dollar (EUR/USD) is a widely traded is up 0.01% today. This left the pair trading around $1.07950.
The Japanese yen was will move positive against the U.S. dollar on Monday. Today USD/JPY is trades pair that increase 0.78% to the 153.490 level.
Another commodity-related currency negative against the U.S dollar, AUD/USD loss 0.08% to 0.65980, and NZD/USD decrease 0.12% to 0.59700 level.
EUR/USD Intraday: Trend on the downside
Our pivot point is at 1.07970
Preferable Price Action: Take sell positions below pivot level with targets at 1.07850 & 1.07760 in extension.
Alternative Price Action: Buy pivot looks for a further upside to 1.08090 & 1.08190.
Comment: RSI is below 50 levels and pairs below its 55MA.
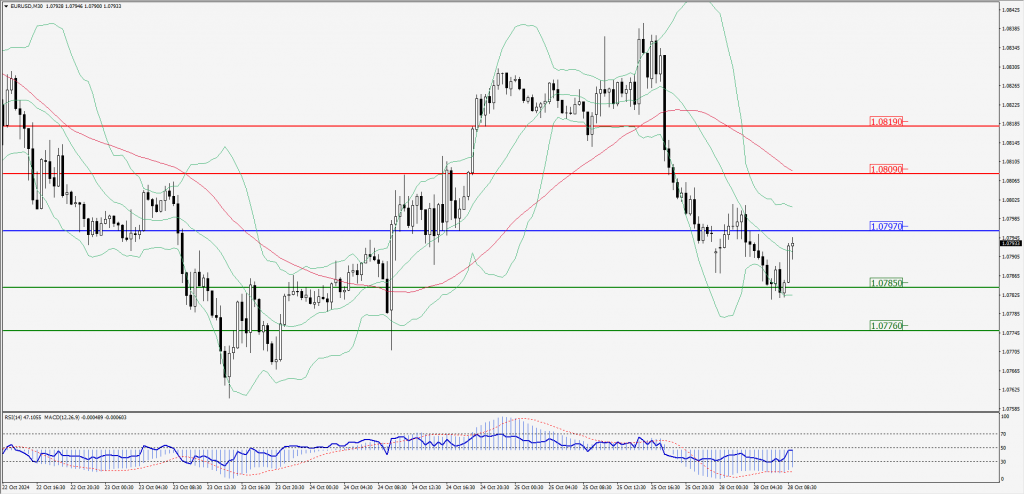
Green Lines Indicate Resistance Levels – Red Lines Indicate Support Levels
Light Blue is a Pivot Point – Black represents the price when the report was produced
GBP/USD Intraday: Trend on the downside
Our pivot point is at 1.29550
Preferable Price Action: Sell positions below pivot with targets at 1.29420 & 1.29310 in extension.
Alternative Price Action: The price above pivot would call for further upside to 1.29680 & 1.29790.
Comment: RSI is below 50 levels and pairs below its 55MA.
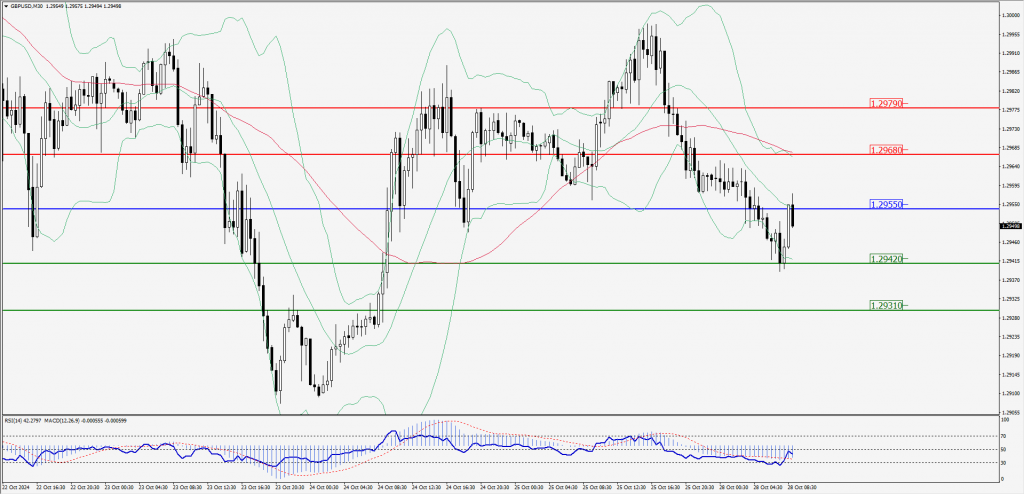
Green Lines Indicate Resistance Levels – Red Lines Indicate Support Levels
Light Blue is a Pivot Point – Black represents the price when the report was produced
USD/JPY Intraday: Trend on the upside
Our pivot point is at 153.240
Preferable Price Action: Buy position above pivot with the target at 153.630 and 154.000 in extension.
Alternative Price Action: The downside breakout of the pivot would call for 152.860 and 152.510.
Comment: MACD is above 50 levels and pairs above its 55MA.
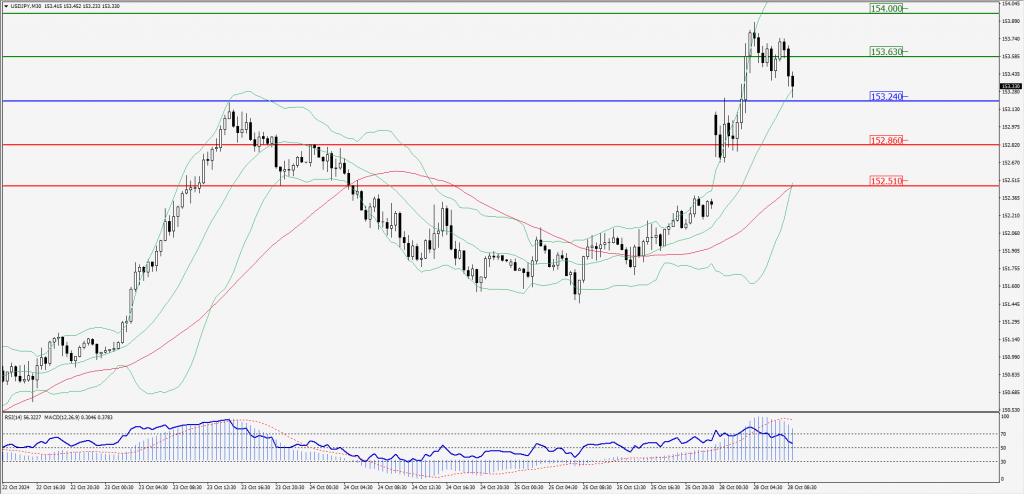
Green Lines Indicate Resistance Levels – Red Lines Indicate Support Levels
Light Blue is a Pivot Point – Black represents the price when the report was produced
AUD/USD Intraday: Trend on the downside
Our pivot point is at 0.65990
Preferable Price Action: Sell positions below pivot with targets at 0.65830 & 0.65690 in extension.
Alternative Price Action: Above pivot a further upside with 0.66160 & 0.66310 as targets.
Comment: RSI is below 50 levels and pairs below its 55MA & 20MA.
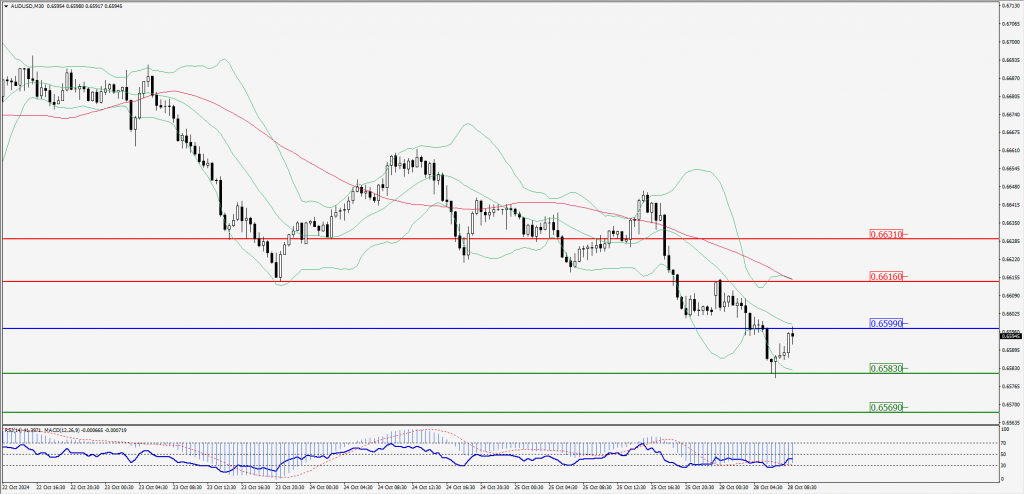
Green Lines Indicate Resistance Levels – Red Lines Indicate Support Levels
Light Blue is a Pivot Point – Black represents the price when the report was produced
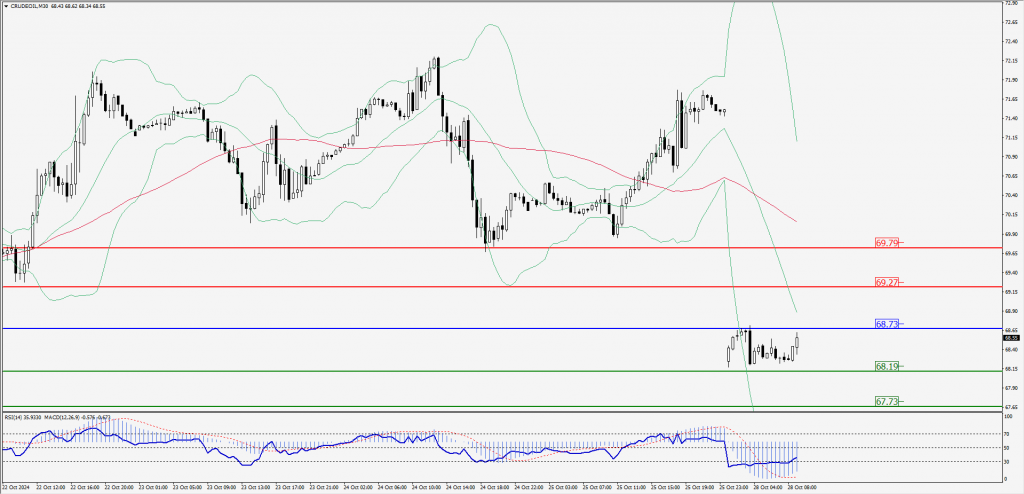
CRUDEOIL Intraday: Trend on the downside
Our pivot point is at 68.73
Preferable Price Action: Below pivot sell oil with 68.19 & 67.73 as targets.
Alternative Price Action: Buy crude above pivot with targets at 69.27 & 69.79 in extension.
Comment: RSI is at below 50 levels and pairs below its 55MA & 20MA.
Green Lines Indicate Resistance Levels – Red Lines Indicate Support Levels
Light Blue is a Pivot Point – Black represents the price when the report was produced
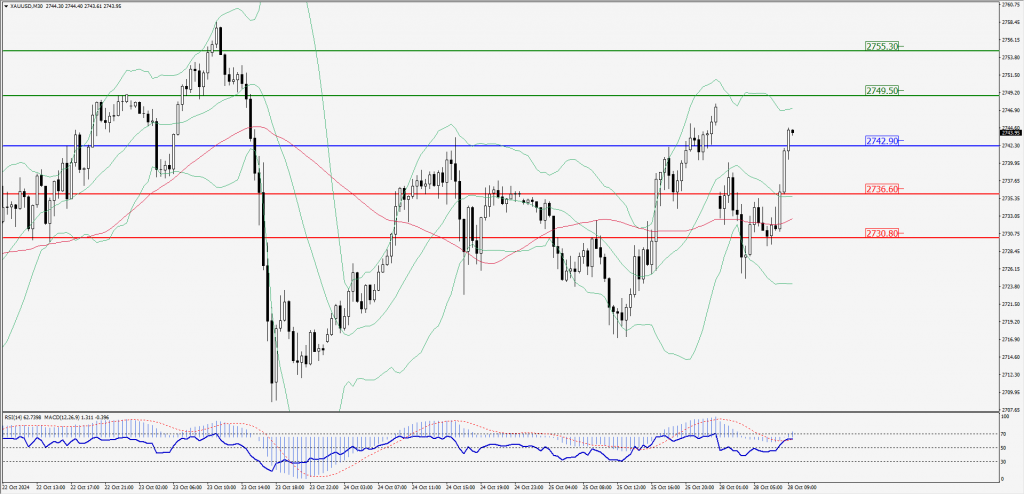
XAU/USD Intraday: Trend on the upside
Our pivot point is at 2742.90
Preferable Price Action: Further upside to 2749.50 and 2755.30.
Alternative Price Action: If the price gives an downside breakout of a pivot, then the price extends to 2736.60 and 2730.80.
Comment: MACD is above 50 levels and pairs above its 55MA & 20MA.
Green Lines Indicate Resistance Levels – Red Lines Indicate Support Levels
Light Blue is a Pivot Point – Black represents the price when the report was produced
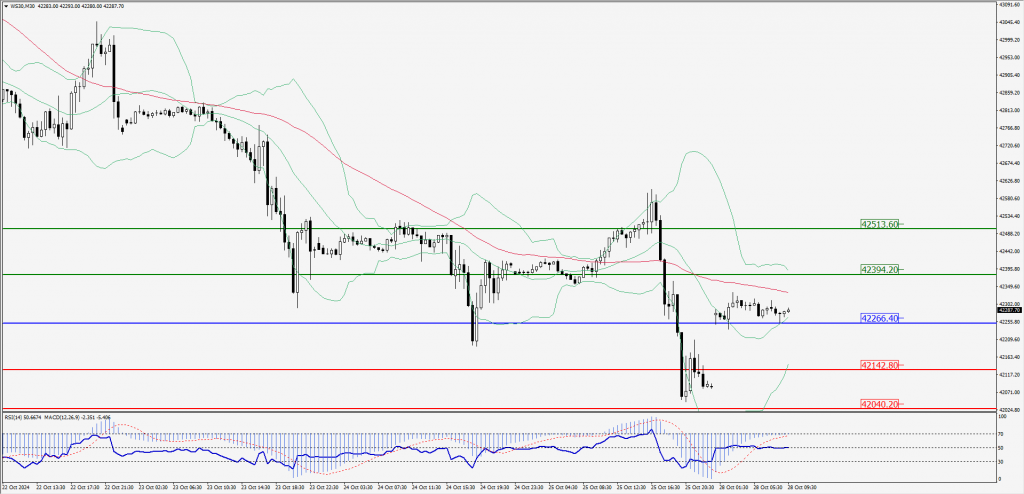
Dow Jones Intraday: Trend on the upside
Our pivot point is 42,266.40
Preferable Price Action: Take buy positions above the pivot with targets at 42,394.20 & 42,513.60.
Alternative Price Action: Below 42,266.40 looks for further downside to 42,142.80 & 42,040.20.
Comment: RSI is above 50 levels and pairs above its 20MA.
Green Lines Indicate Resistance Levels – Red Lines Indicate Support Levels
Light Blue is a Pivot Point – Black represents the price when the report was produced