Market Wrap: Stocks, Bonds, Commodities
Most Asian currencies weakened slightly on Friday as the dollar retained a bulk of its weekly gains on expectations of a slower pace of interest rate cuts by the Federal Reserve.
The Dow Jones Industrial Average fail 140.59 points to 42,374.36, the S&P 500 gain 0.21% to 5,809.90 and the Nasdaq Composite ascend 138.84 points to 18,415.49.
MSCI’s index of Asia-Pacific stocks outside Japan is down 0.90% to 737.98 levels. The Australian index was higher by 0.06% to 8,211.30. Japanese Nikkei Index decrease 0.76% today.
European stocks were mixed on Friday, with the Stoxx Europe 50 Index decrease 0.09% to 4,931.25 Germany’s DAX descend 0.10% to 19,433.55, and France’s CAC lower 0.20% to 7,488.32 and U.K.’s FTSE 100 gain 0.01% to 8,269.96.
Benchmark 10-year U.S. Treasury fail as demand for safe assets slipped again, today 10-year bond yields 0.26% to 4.1900.
Oil prices nudged higher on Friday and are on track for a weekly gain of more than 1%, as tensions in the world’s top oil-producing region, the Middle East, and a restart in Gaza ceasefire talks in the coming days kept traders on edge.
Spot Brent crude oil increase 0.40% to $74.68 per barrel. US West Texas Intermediate crude is increase 0.40% to $70.47 a barrel.
The yellow metal gold is down 0.26% to 2,741.85 dollars per ounce.
Market Wrap: Forex
South Korea plans to start regulating cross-border transactions of virtual assets such as cryptocurrency, bringing in registration and reporting requirements from the second half of 2025, the finance ministry said on Friday.
Today, the U.S. dollar index measures the Greenback against a trade-weighted basket of six major currencies, which increase 0.06% to 103.985.
The Euro US Dollar (EUR/USD) is a widely traded is down 0.09% today. This left the pair trading around $1.08170.
The Japanese yen was will move positive against the U.S. dollar on Friday. Today USD/JPY is trades pair that increase 0.11% to the 151.990 level.
Another commodity-related currency negative against the U.S dollar, AUD/USD loss 0.22% to 0.66250, and NZD/USD decrease 0.29% to 0.59970 level.
EUR/USD Intraday: Trend on the downside
Our pivot point is at 1.08220
Preferable Price Action: Take sell positions below pivot level with targets at 1.08080 & 1.07960 in extension.
Alternative Price Action: Buy pivot looks for a further upside to 1.08360 & 1.08480.
Comment: RSI is below 50 levels and pairs below its 20MA.
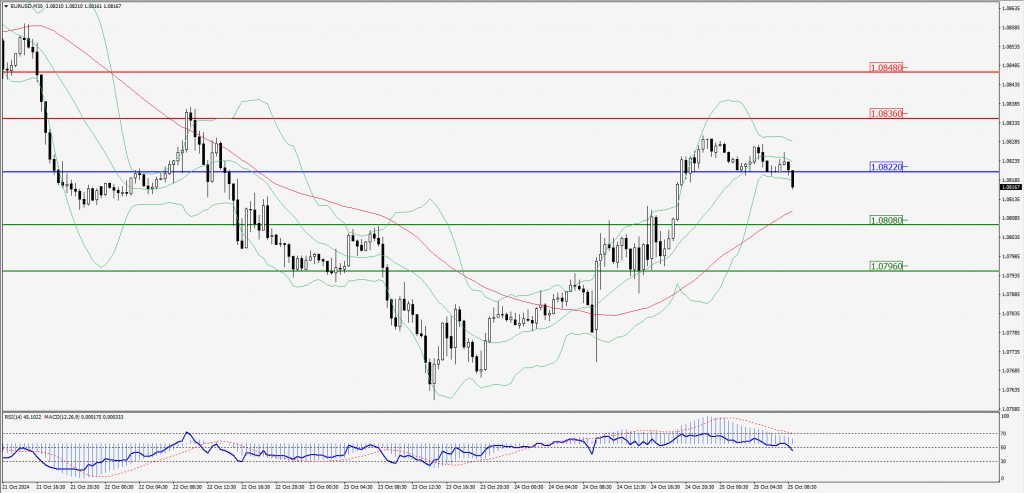
Green Lines Indicate Resistance Levels – Red Lines Indicate Support Levels
Light Blue is a Pivot Point – Black represents the price when the report was produced
GBP/USD Intraday: Trend on the downside
Our pivot point is at 1.29690
Preferable Price Action: Sell positions below pivot with targets at 1.29510 & 1.29360 in extension.
Alternative Price Action: The price below pivot would call for further downside to 1.29880 & 1.30040.
Comment: RSI is below 50 levels and pairs below its 20MA.
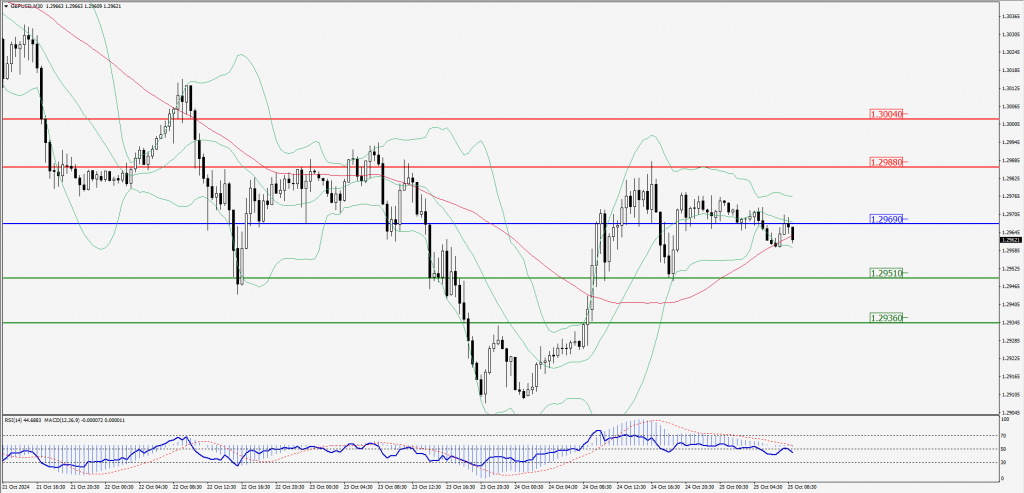
Green Lines Indicate Resistance Levels – Red Lines Indicate Support Levels
Light Blue is a Pivot Point – Black represents the price when the report was produced
USD/JPY Intraday: Trend on the upside
Our pivot point is at 151.910
Preferable Price Action: Buy position above pivot with the target at 152.350 and 152.760 in extension.
Alternative Price Action: The downside breakout of the pivot would call for 151.440 and 151.020.
Comment: MACD is above 50 levels and pairs above its 20MA.
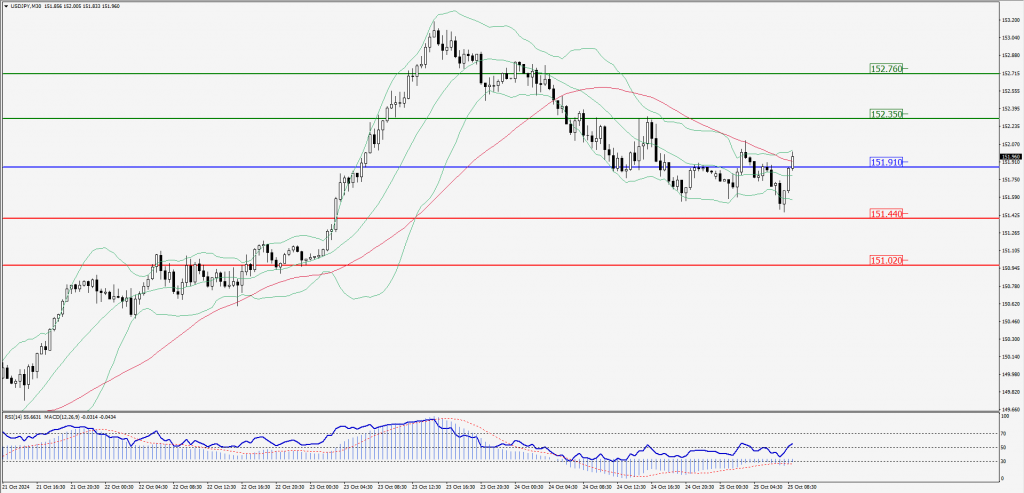
Green Lines Indicate Resistance Levels – Red Lines Indicate Support Levels
Light Blue is a Pivot Point – Black represents the price when the report was produced
AUD/USD Intraday: Trend on the downside
Our pivot point is at 0.66290
Preferable Price Action: Sell positions below pivot with targets at 0.66170 & 0.66080 in extension.
Alternative Price Action: Above pivot a further upside with 0.66420 & 0.66520 as targets.
Comment: RSI is below 50 levels and pairs below its 55MA & 20MA.
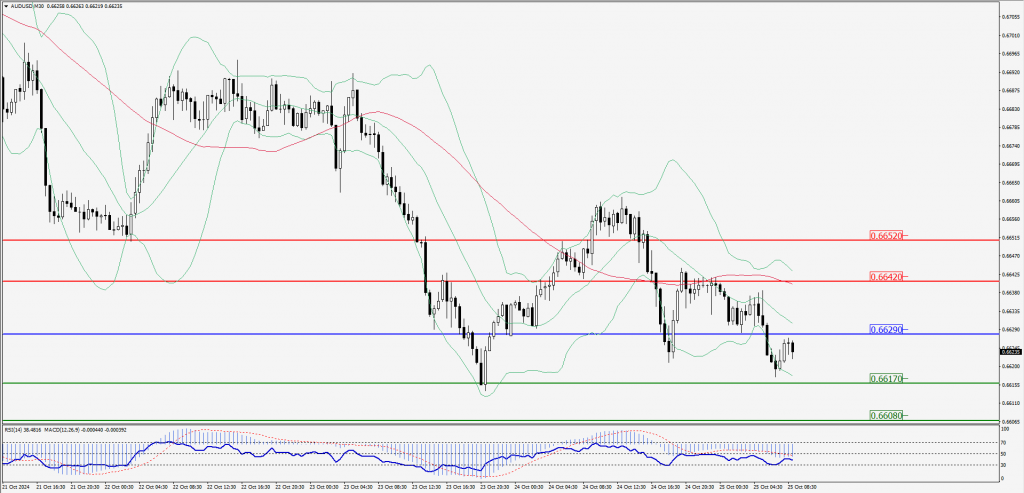
Green Lines Indicate Resistance Levels – Red Lines Indicate Support Levels
Light Blue is a Pivot Point – Black represents the price when the report was produced
CRUDEOIL Intraday: Trend on the downside
Our pivot point is at 70.51
Preferable Price Action: Below pivot sell oil with 70.17 & 69.73 as targets.
Alternative Price Action: Buy crude above pivot with targets at 70.89 & 71.27 in extension.
Comment: RSI is at below 50 levels and pairs below its 55MA.
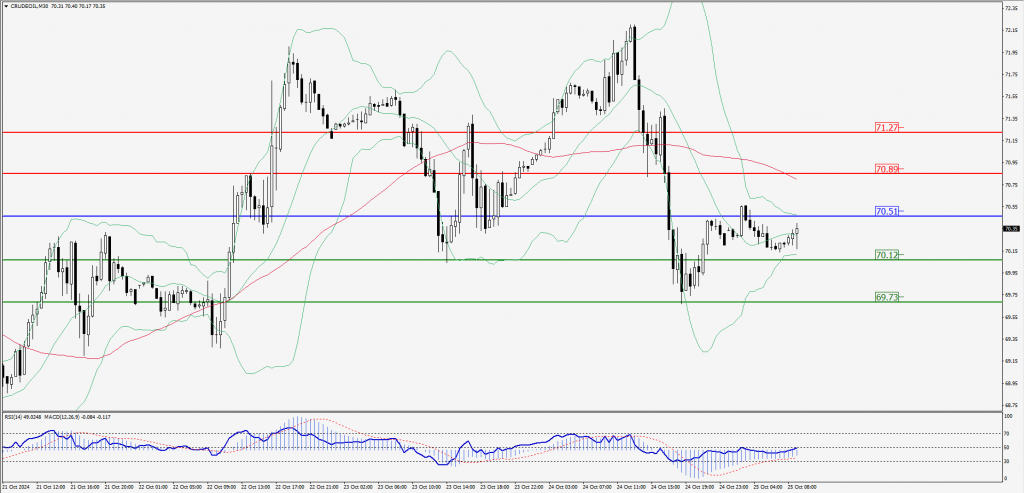
Green Lines Indicate Resistance Levels – Red Lines Indicate Support Levels
Light Blue is a Pivot Point – Black represents the price when the report was produced
XAU/USD Intraday: Trend on the downside
Our pivot point is at 2732.30
Preferable Price Action: Further downside to 2725.20 and 2719.00.
Alternative Price Action: If the price gives an upside breakout of a pivot, then the price extends to 2739.50 and 2745.50.
Comment: MACD is below 50 levels and pairs below its 55MA.
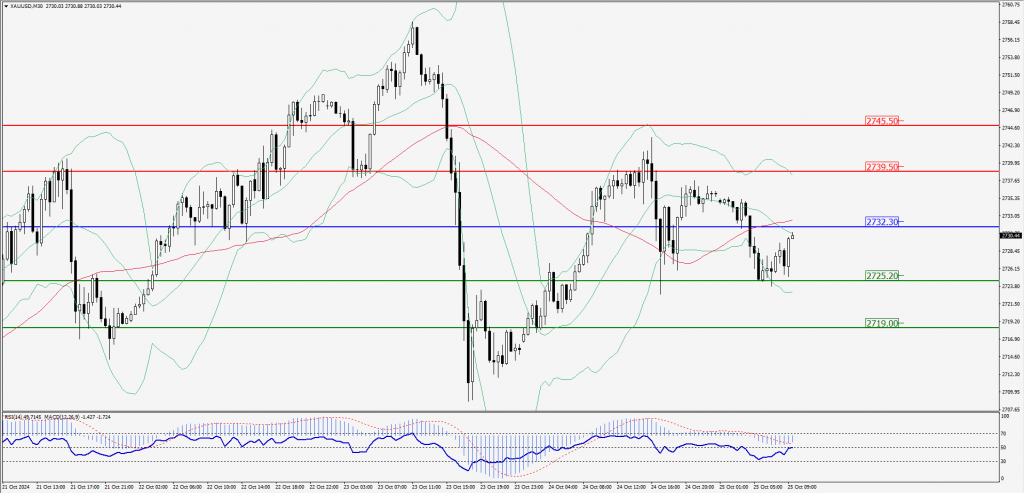
Green Lines Indicate Resistance Levels – Red Lines Indicate Support Levels
Light Blue is a Pivot Point – Black represents the price when the report was produced
Dow Jones Intraday: Trend on the upside
Our pivot point is 42,372.20
Preferable Price Action: Take buy positions above the pivot with targets at 42,492.40 & 42,610.90.
Alternative Price Action: Below 42,372.20 looks for further downside to 42,255.40 & 42,138.60.
Comment: RSI is above 50 levels.
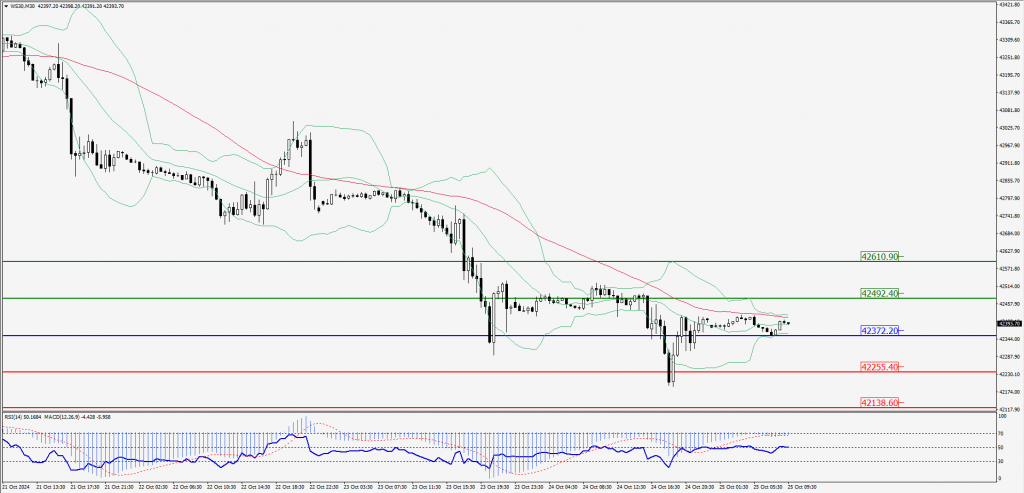
Green Lines Indicate Resistance Levels – Red Lines Indicate Support Levels
Light Blue is a Pivot Point – Black represents the price when the report was produced