Market Wrap: Stocks, Bonds, Commodities
Most Asian currencies moved in a tight range on Monday, with the yuan steady after the People’s Bank cut interest rates slightly more than expected, while the dollar remained near recent peaks.
The Dow Jones Industrial Average rose 36.86 points to 43,275.91, the S&P 500 gain 0.40% to 5,864.67 and the Nasdaq Composite ascend 115.94 points to 18,489.55.
MSCI’s index of Asia-Pacific stocks outside Japan is up 1.38% to 748.24 levels. The Australian index was higher by 0.74% to 8,344.40. Japanese Nikkei Index increase 0.11% today.
European stocks were mixed on Monday, with the Stoxx Europe 50 Index decrease 0.11% to 4,980.55 Germany’s DAX descend 0.22% to 19,614.95, and France’s CAC lower 0.17% to 7,599.74 and U.K.’s FTSE 100 gain 0.24% to 8,378.25.
Benchmark 10-year U.S. Treasury rose as demand for safe assets slipped again, today 10-year bond yields 0.47% to 4.0950.
Oil prices edged up in Asian trading on Monday, following a more than 7% drop last week on worries about demand in China, the world’s top oil importer, and an easing of concerns about potential supply disruptions in the Middle East.
Spot Brent crude oil increase 0.68% to $73.56 per barrel. US West Texas Intermediate crude is increase 0.86% to $69.28 a barrel.
The yellow metal gold is up 0.59% to 2,746.05 dollars per ounce.
Market Wrap: Forex
The dollar has enjoyed a boost from the return of the “Trump trade” as Republican presidential candidate Donald Trump’s chances of returning to the White House appear to be on the up, but UBS believes stronger rallies should be sold as Trump isn’t an outright positive for the greenback.
Today, the U.S. dollar index measures the Greenback against a trade-weighted basket of six major currencies, which increase 0.12% to 103.435.
The Euro US Dollar (EUR/USD) is a widely traded is down 0.11% today. This left the pair trading around $1.08530.
The Japanese yen was will move positive against the U.S. dollar on Monday. Today USD/JPY is trades pair that increase 0.16% to the 149.750 level.
Another commodity-related currency negative against the U.S dollar, AUD/USD loss 0.23% to 0.66910, and NZD/USD decrease 0.15% to 0.60610 level.
EUR/USD Intraday: Trend on the downside
Our pivot point is at 1.08620
Preferable Price Action: Take sell positions below pivot level with targets at 1.08460 & 1.08320 in extension.
Alternative Price Action: Buy pivot looks for a further upside to 1.08780 & 1.08920.
Comment: RSI is below 50 levels.
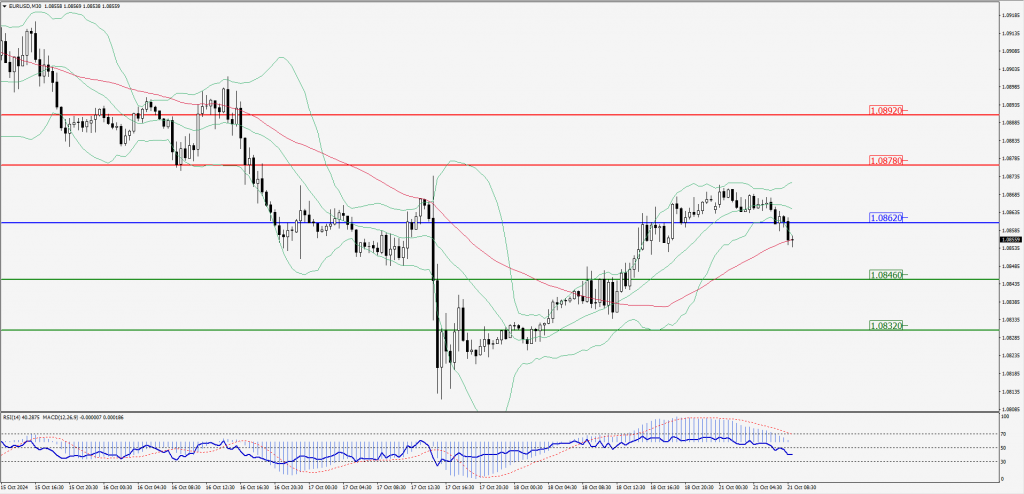
Green Lines Indicate Resistance Levels – Red Lines Indicate Support Levels
Light Blue is a Pivot Point – Black represents the price when the report was produced
GBP/USD Intraday: Trend on the downside
Our pivot point is at 1.30430
Preferable Price Action: Sell positions below pivot with targets at 1.30270 & 1.30120 in extension.
Alternative Price Action: The price above pivot would call for further upside to 1.30590 & 1.30730.
Comment: RSI is below 50 levels and pairs below its 20MA & 55MA.
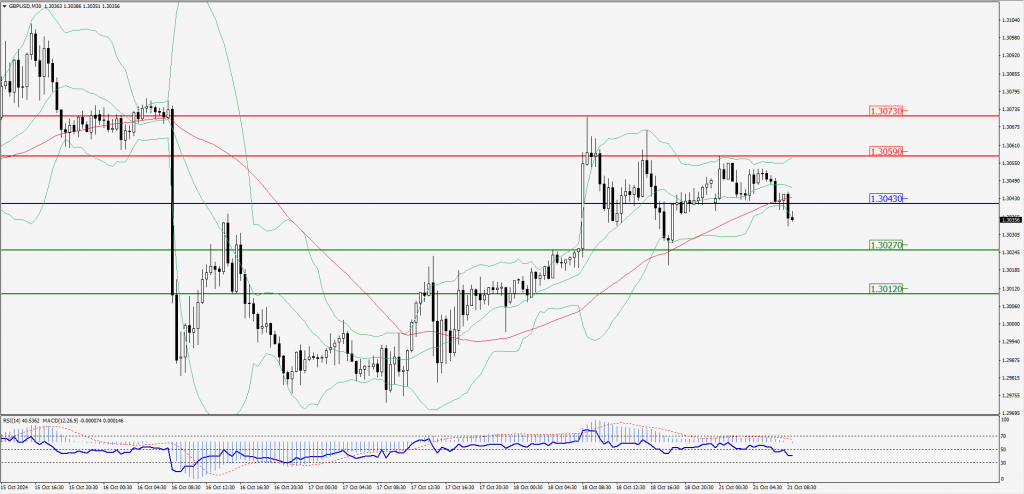
Green Lines Indicate Resistance Levels – Red Lines Indicate Support Levels
Light Blue is a Pivot Point – Black represents the price when the report was produced
USD/JPY Intraday: Trend on the upside
Our pivot point is at 149.510
Preferable Price Action: Buy position above pivot with the target at 149.710 and 149.880 in extension.
Alternative Price Action: The downside breakout of the pivot would call for 149.300 and 149.140.
Comment: MACD is above 50 levels and pairs above its 20MA.
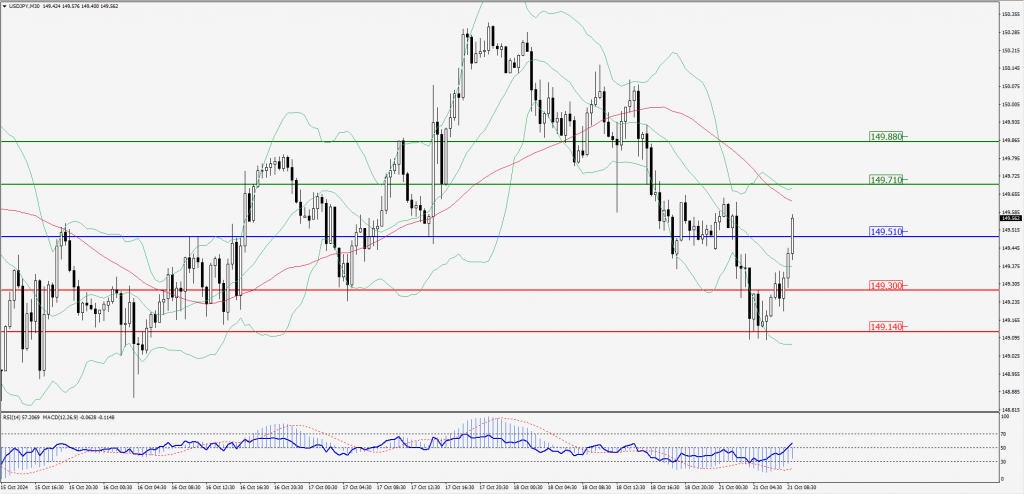
Green Lines Indicate Resistance Levels – Red Lines Indicate Support Levels
Light Blue is a Pivot Point – Black represents the price when the report was produced
AUD/USD Intraday: Major trend on the downside
Our pivot point is at 0.66920
Preferable Price Action: Buy positions above pivot with targets at 0.66820 & 0.66730 in extension.
Alternative Price Action: Below pivot a further downside with 0.67020 & 0.67100 as targets.
Comment: RSI is below 50 levels and pairs below its 55MA & 20MA.
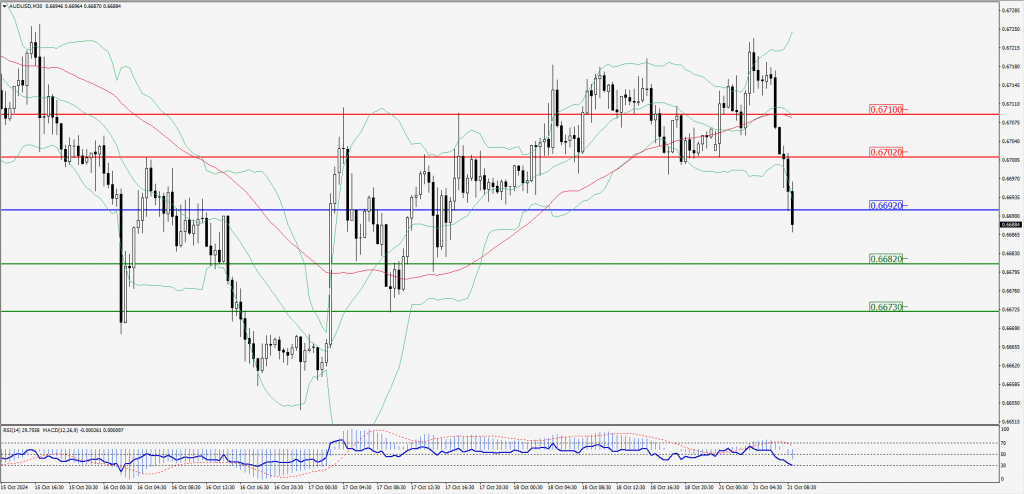
Green Lines Indicate Resistance Levels – Red Lines Indicate Support Levels
Light Blue is a Pivot Point – Black represents the price when the report was produced
CRUDEOIL Intraday: Trend on the upside
Our pivot point is at 68.88
Preferable Price Action: Above pivot buy oil with 69.25 & 69.25 as targets.
Alternative Price Action: Sell crude below pivot with targets at 68.51 & 68.18 in extension.
Comment: RSI is at above 50 levels and pairs above its 20MA.
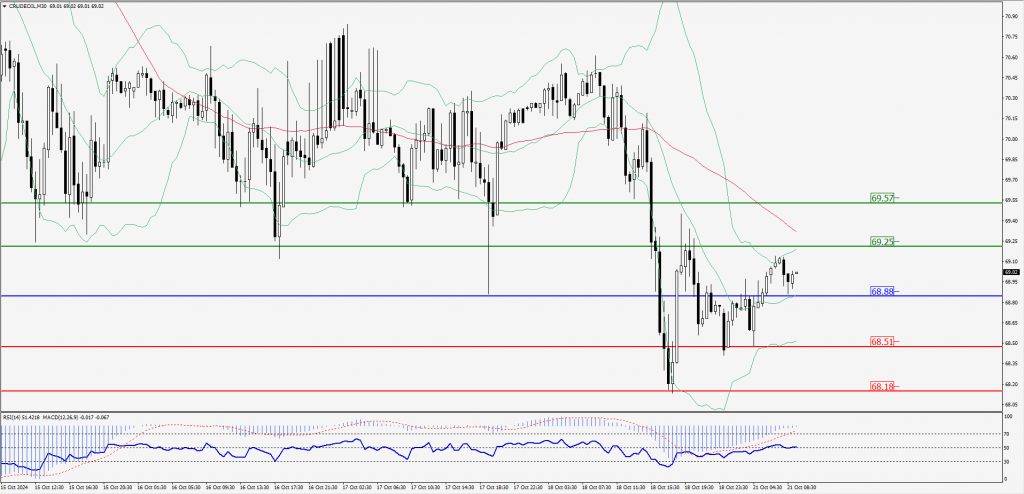
Green Lines Indicate Resistance Levels – Red Lines Indicate Support Levels
Light Blue is a Pivot Point – Black represents the price when the report was produced
XAU/USD Intraday: Trend on the upside
Our pivot point is at 2726.80
Preferable Price Action: Further upside to 2736.90 and 2721.00.
Alternative Price Action: If the price gives an upside breakout of a pivot, then the price extends to 2715.70 and 2705.20.
Comment: MACD is above 50 levels and pairs above its 55MA & 20MA.
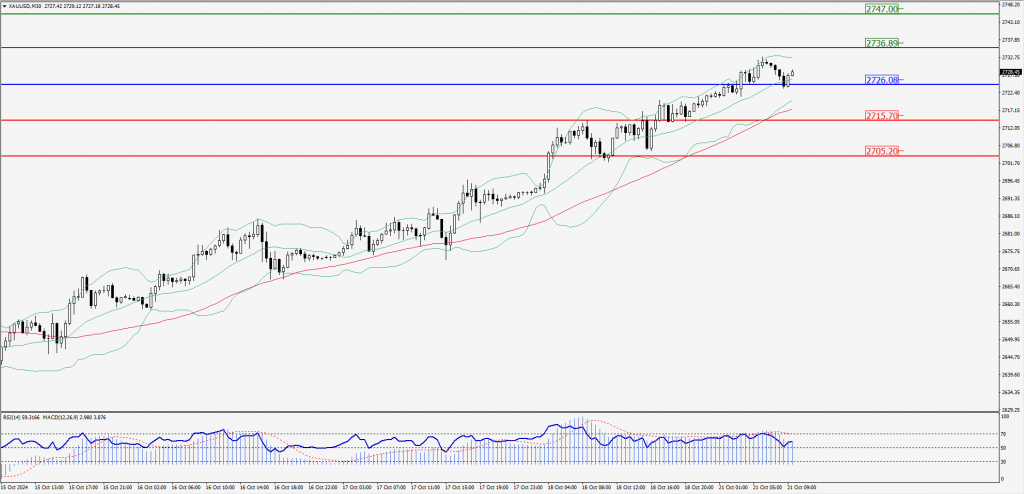
Green Lines Indicate Resistance Levels – Red Lines Indicate Support Levels
Light Blue is a Pivot Point – Black represents the price when the report was produced
Dow Jones Intraday: Trend on the upside
Our pivot point is 43,265.90
Preferable Price Action: Take buy positions above the pivot with targets at 43,354.70 & 43,088.40.
Alternative Price Action: Below 43,265.90 looks for further downside to 43,175.90 & 43,100.70.
Comment: RSI is above 50 levels and pairs above its 20MA.
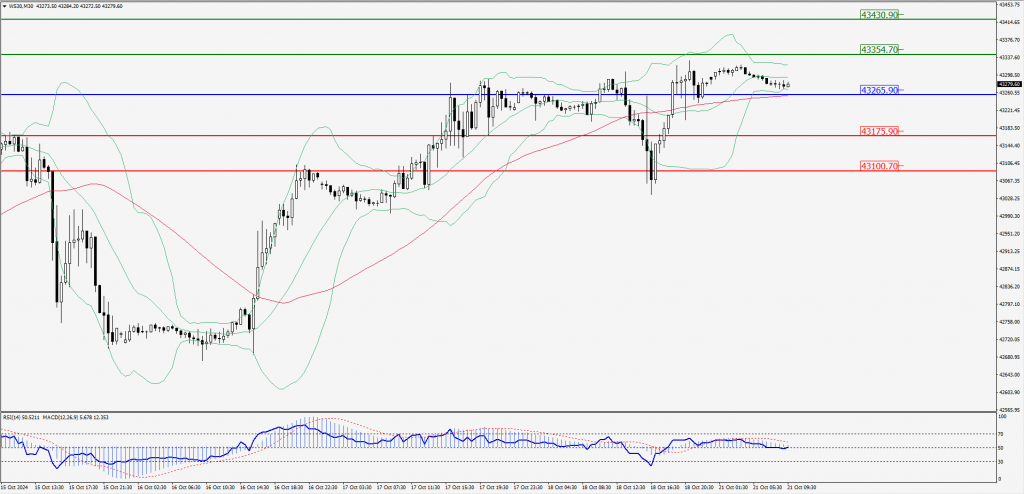
Green Lines Indicate Resistance Levels – Red Lines Indicate Support Levels
Light Blue is a Pivot Point – Black represents the price when the report was produced