Market Wrap: Stocks, Bonds, Commodities
Most Asian currencies moved in a tight range on Wednesday as traders digested a recent round of stimulus from China, while the dollar hovered near two-month highs on bets of smaller interest rate cuts.
The Dow Jones Industrial Average fail 324.80 points to 42,740.42, the S&P 500 loss 0.76% to 5,815.26 and the Nasdaq Composite ascend 187.10 points to 18,315.59.
MSCI’s index of Asia-Pacific stocks outside Japan is down 0.61% to 744.69 levels. The Australian index was lower by 0.41% to 8,284.70. Japanese Nikkei Index decrease 1.87% today.
European stocks were mixed on Wednesday, with the Stoxx Europe 50 Index decrease 0.74% to 4,909.95 Germany’s DAX descend 0.33% to 19,456.35, and France’s CAC lower 0.67% to 7,471.77 and U.K.’s FTSE 100 gain 0.63% to 8,301.66.
Benchmark 10-year U.S. Treasury fail as demand for safe assets slipped again, today 10-year bond yields 0.45% to 4.0170.
Oil prices rose slightly in Asian trade on Wednesday, steadying after logging bruising losses over the past week as the prospect of a less severe escalation in the Middle East and weak demand weighed.
Spot Brent crude oil increase 0.30% to $74.47 per barrel. US West Texas Intermediate crude is increase 0.35% to $70.83 a barrel.
The yellow metal gold is up 0.52% to 2,692.90 dollars per ounce.
Market Wrap: Forex
Sterling tumbled to its lowest in two months on Wednesday after softer than expected British inflation data offered scope for the Bank of England to cut rates more forcefully, while the euro was at a 10-week low ahead of a European Central Bank meeting.
Today, the U.S. dollar index measures the Greenback against a trade-weighted basket of six major currencies, which increase 0.13% to 103.187.
The Euro US Dollar (EUR/USD) is a widely traded is up 0.10% today. This left the pair trading around $1.08800.
The Japanese yen was will move positive against the U.S. dollar on Wednesday. Today USD/JPY is trades pair that increase 0.13% to the 149.380 level.
Another commodity-related currency negative against the U.S dollar, AUD/USD loss 0.23% to 0.66860, and NZD/USD decrease 0.27% to 0.60660 level.
EUR/USD Intraday: Trend on the downside
Our pivot point is at 1.08850
Preferable Price Action: Take sell positions below pivot level with targets at 1.08720 & 1.08600 in extension.
Alternative Price Action: Buy pivot looks for a further upside to 1.08980 & 1.09100.
Comment: RSI is below 50 levels and pairs below its 55MA & 20MA.
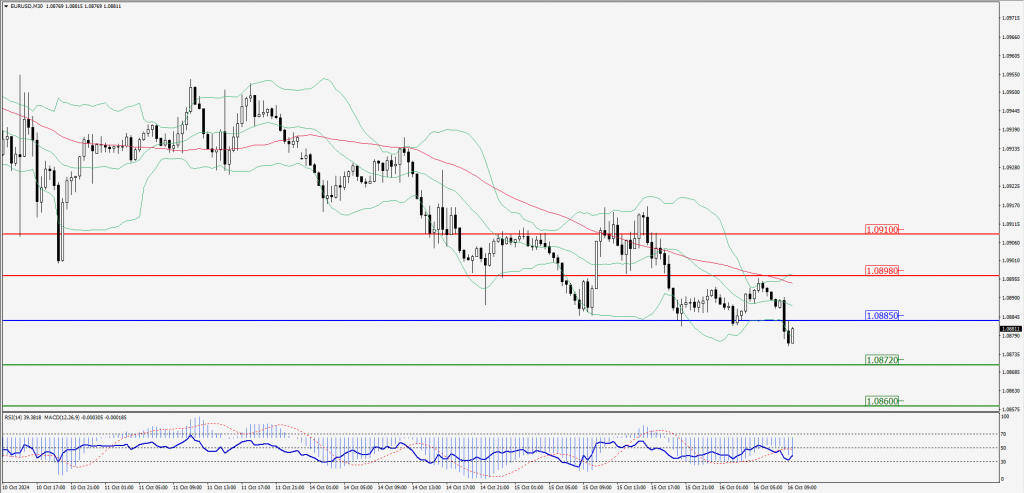
Green Lines Indicate Resistance Levels – Red Lines Indicate Support Levels
Light Blue is a Pivot Point – Black represents the price when the report was produced
GBP/USD Intraday: Major trend on the downside
Our pivot point is at 1.29980
Preferable Price Action: Sell positions below pivot with targets at 1.29790 & 1.29650 in extension.
Alternative Price Action: The price above pivot would call for further upside to 1.30160 & 1.30320.
Comment: RSI is below 50 levels and pairs below its 20MA & 55MA.
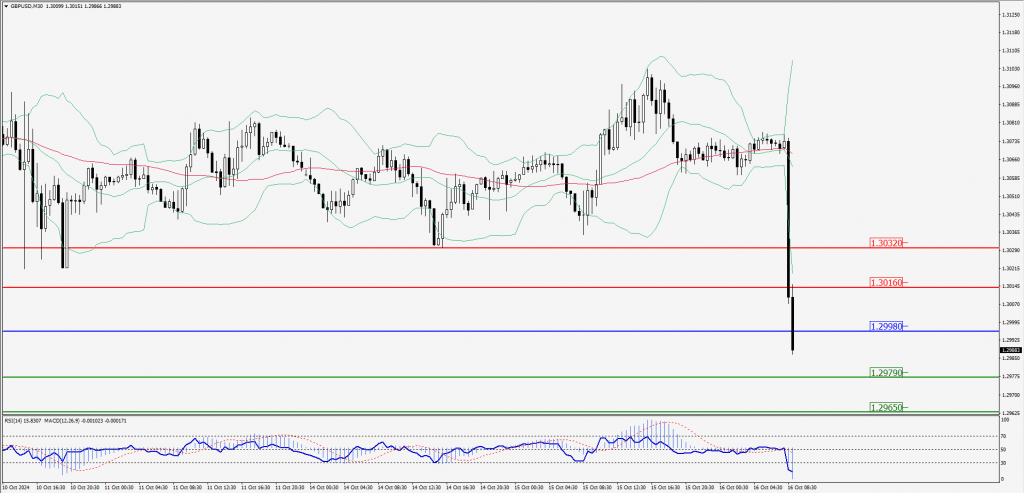
Green Lines Indicate Resistance Levels – Red Lines Indicate Support Levels
Light Blue is a Pivot Point – Black represents the price when the report was produced
USD/JPY Intraday: Trend on the upside
Our pivot point is at 149.210
Preferable Price Action: Buy position above pivot with the target at 149.440 and 149.650 in extension.
Alternative Price Action: The downside breakout of the pivot would call for 148.980 and 148.760.
Comment: MACD is above 50 levels and pairs above its 20MA.
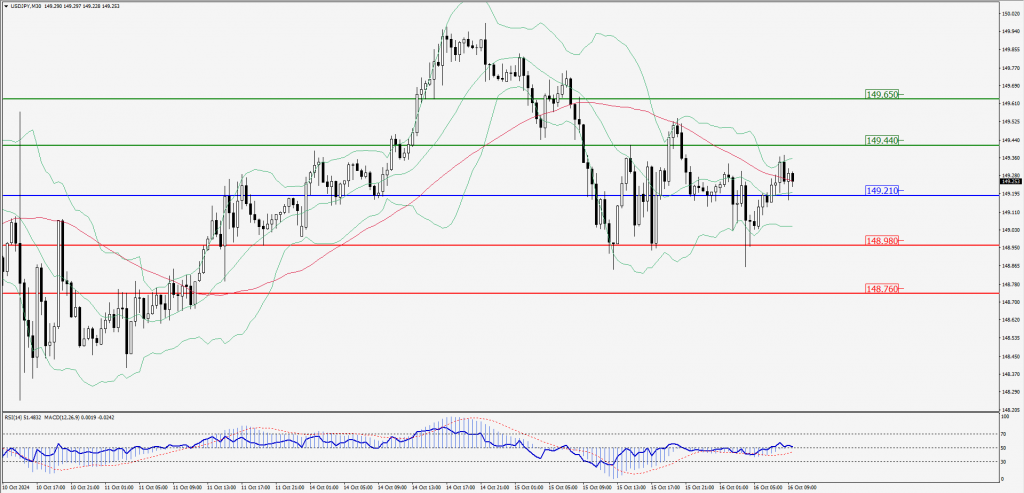
Green Lines Indicate Resistance Levels – Red Lines Indicate Support Levels
Light Blue is a Pivot Point – Black represents the price when the report was produced
AUD/USD Intraday: Trend on the downside
Our pivot point is at 0.66940
Preferable Price Action: Sell positions below pivot with targets at 0.66820 & 0.66720 in extension.
Alternative Price Action: Above pivot a further upside with 0.67070 & 0.67160 as targets.
Comment: RSI is below 50 levels and pairs below its 55MA.
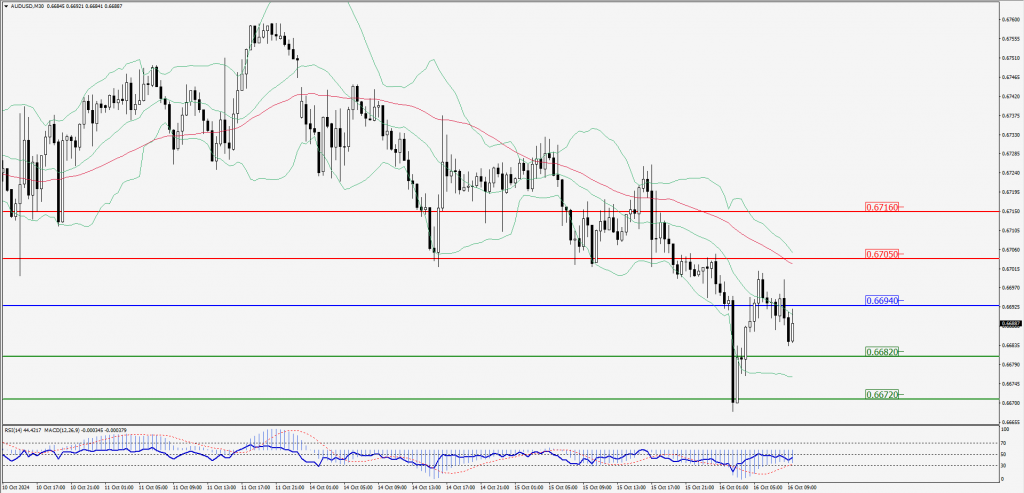
Green Lines Indicate Resistance Levels – Red Lines Indicate Support Levels
Light Blue is a Pivot Point – Black represents the price when the report was produced
CRUDEOIL Intraday: Trend on the downside
Our pivot point is at 70.54
Preferable Price Action: Below pivot sell oil with 69.79 & 69.13 as targets.
Alternative Price Action: Buy crude above pivot with targets at 71.28 & 71.99 in extension.
Comment: RSI is at below 50 levels and pairs below its 20MA.
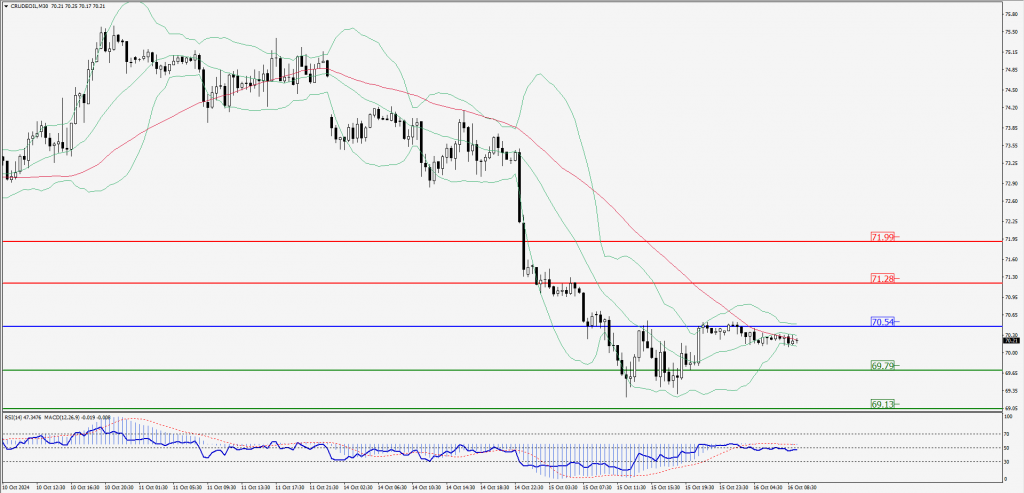
Green Lines Indicate Resistance Levels – Red Lines Indicate Support Levels
Light Blue is a Pivot Point – Black represents the price when the report was produced
XAU/USD Intraday: Major trend on the upside
Our pivot point is at 2675.50
Preferable Price Action: Further upside to 2685.90 and 2696.00.
Alternative Price Action: If the price gives an downside breakout of a pivot, then the price extends to 2664.80 and 2654.60.
Comment: MACD is above 50 levels and pairs above its 55MA & 20MA.
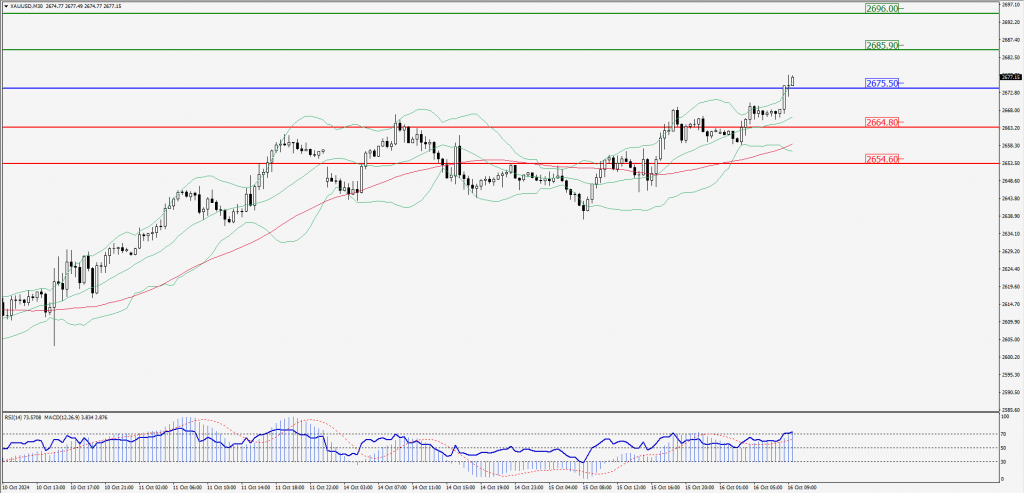
Green Lines Indicate Resistance Levels – Red Lines Indicate Support Levels
Light Blue is a Pivot Point – Black represents the price when the report was produced
Dow Jones Intraday: Trend on the downside
Our pivot point is 42,772.60
Preferable Price Action: Take sell positions below the pivot with targets at 42,656.40 & 42,551.30.
Alternative Price Action: Above 42,772.60 looks for further upside to 42,889.90 & 43,000.00.
Comment: RSI is below 50 levels and pairs below its 55MA.
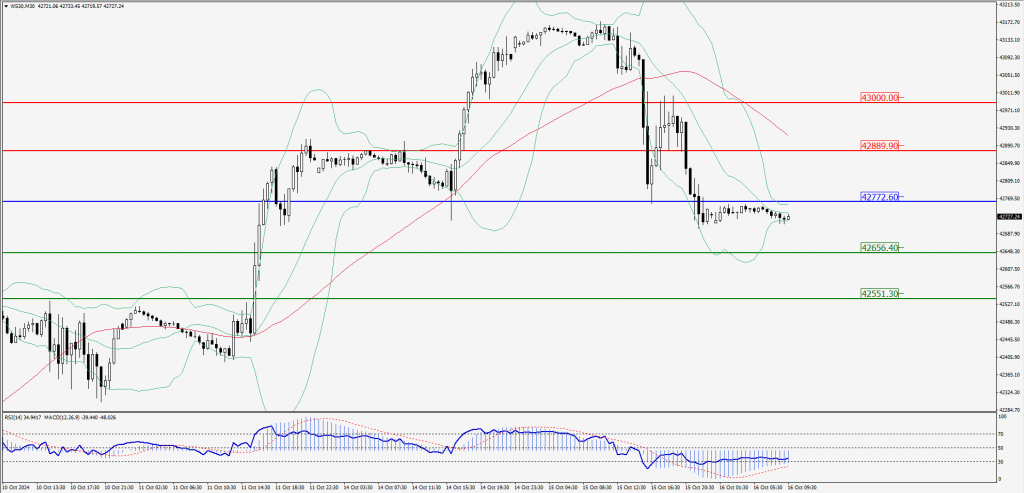
Green Lines Indicate Resistance Levels – Red Lines Indicate Support Levels
Light Blue is a Pivot Point – Black represents the price when the report was produced