Market Wrap: Stocks, Bonds, Commodities
The S&P 500 scored a record closing high and the Dow and Nasdaq rose on Thursday, as Micron Technology shares rallied and a strong U.S. jobless claims report eased labor market concerns.
The Dow Jones Industrial Average rose 260.36 points to 42,175.11, the S&P 500 gain 0.40% to 5,745.40 and the Nasdaq Composite ascend 108.08 points to 18,190.29.
MSCI’s index of Asia-Pacific stocks outside Japan is up 3.75% to 760.04 levels. The Australian index was higher by 0.10% to 8,212.20. Japanese Nikkei Index increase 2.57% today.
European stocks were positive on Friday, with the Stoxx Europe 50 Index increase 0.16% to 5,040.45 Germany’s DAX ascend 0.33% to 19,283.95, and France’s CAC higher 0.26% to 7,762.35 and U.K.’s FTSE 100 gain 0.05% to 8,288.84.
Benchmark 10-year U.S. Treasury fail as demand for safe assets slipped again, today 10-year bond yields 0.43% to 3.7790.
Oil slid further as Saudi Arabia was reportedly committed to increasing output in December, while Libya named its new central bank governor, opening the way to reviving some crude production.
Spot Brent crude oil decrease 0.01% to $71.08 per barrel. US West Texas Intermediate crude is decrease 0.01% to $67.67 a barrel.
The yellow metal gold is down 0.25% to 2,688.25 dollars per ounce.
Market Wrap: Forex
The dollar steadied on Friday after falling in its previous session, while 10-year US Treasury yields were mostly flat.
Today, the U.S. dollar index measures the Greenback against a trade-weighted basket of six major currencies, which increase 0.10% to 100.630.
The Euro US Dollar (EUR/USD) is a widely traded is down 0.37% today. This left the pair trading around $1.11340.
The Japanese yen was will move positive against the U.S. dollar on Friday. Today USD/JPY is trades pair that decrease 1.11% to the 143.190 level.
Another commodity-related currency negative against the U.S dollar, AUD/USD loss 0.24% to 0.68780, and NZD/USD decrease 0.37% to 0.63030 level.
EUR/USD Intraday: Trend on the upside
Our pivot point is at 1.11700
Preferable Price Action: Take buy positions above pivot level with targets at 1.11830 & 1.11960 in extension.
Alternative Price Action: Sell pivot looks for a further downside to 1.11550 & 1.11430.
Comment: RSI is above 50 levels.
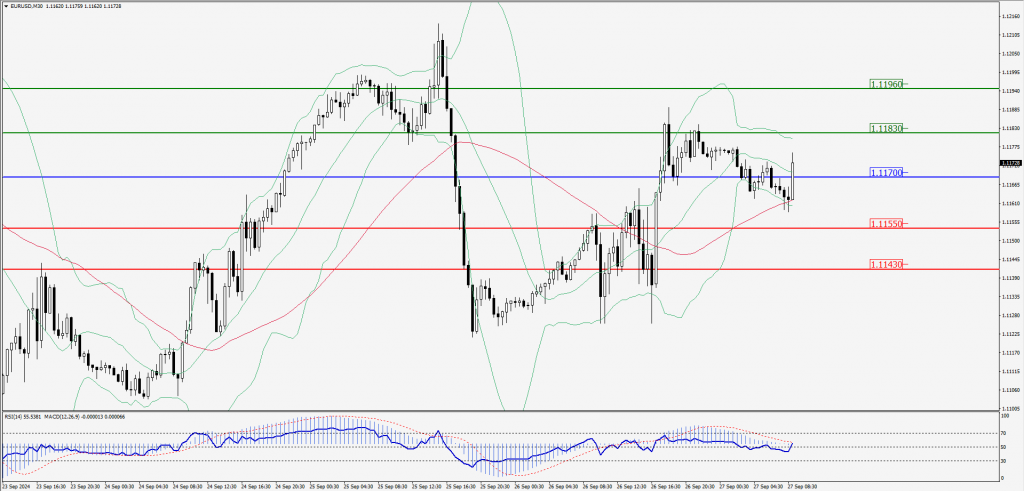
Green Lines Indicate Resistance Levels – Red Lines Indicate Support Levels
Light Blue is a Pivot Point – Black represents the price when the report was produced
GBP/USD Intraday: Trend on the downside
Our pivot point is at 1.33890
Preferable Price Action: Sell positions below pivot with targets at 1.33680 & 1.33500 in extension.
Alternative Price Action: The price above pivot would call for further upside to 1.34090 & 1.34270.
Comment: RSI is below 50 levels and Pairs below its 20MA.
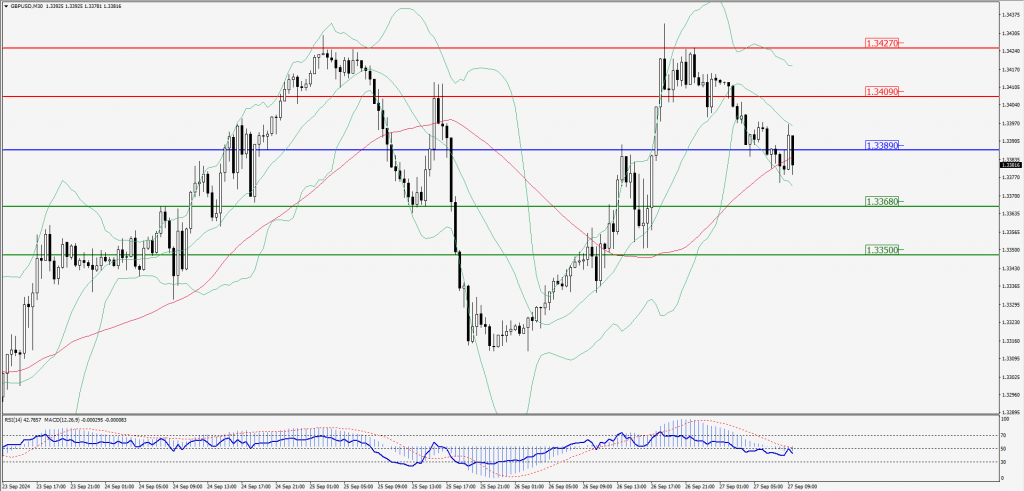
Green Lines Indicate Resistance Levels – Red Lines Indicate Support Levels
Light Blue is a Pivot Point – Black represents the price when the report was produced
USD/JPY Intraday: Trend on the downside
Our pivot point is at 144.030
Preferable Price Action: Sell position below pivot with the target at 143.560 and 143.170 in extension.
Alternative Price Action: The upside breakout of the pivot would call for 144.470 and 144.870.
Comment: MACD is below 50 levels.
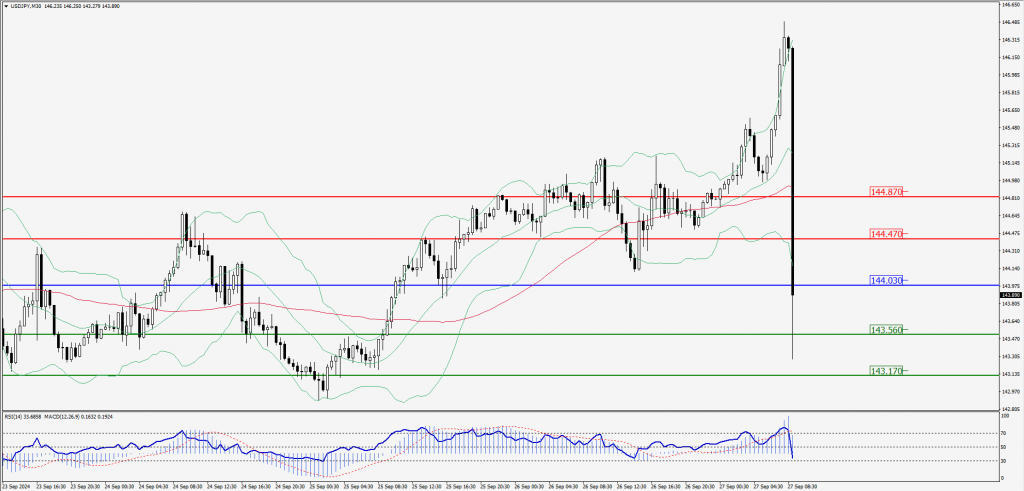
Green Lines Indicate Resistance Levels – Red Lines Indicate Support Levels
Light Blue is a Pivot Point – Black represents the price when the report was produced
AUD/USD Intraday: Trend on the downside
Our pivot point is at 0.68800
Preferable Price Action: Sell positions below pivot with targets at 0.68680 & 0.68560 in extension.
Alternative Price Action: Above pivot a further upside with 0.69030 & 0.68920 as targets.
Comment: RSI is below 50 levels and pairs below its 20MA.
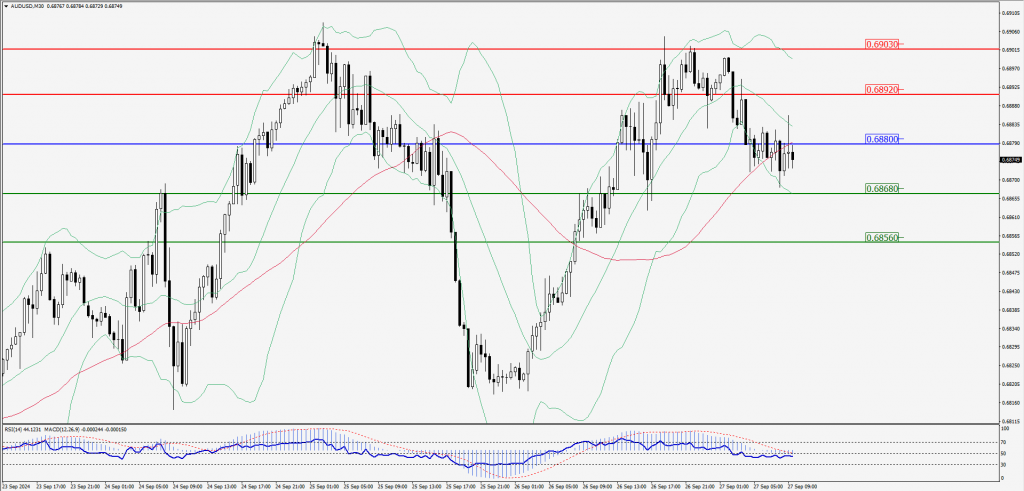
Green Lines Indicate Resistance Levels – Red Lines Indicate Support Levels
Light Blue is a Pivot Point – Black represents the price when the report was produced
CRUDEOIL Intraday: Trend on the upside
Our pivot point is at 67.58
Preferable Price Action: Above pivot buy oil with 68.35 & 69.09 as targets.
Alternative Price Action: Sell crude below pivot with targets at 66.81 and 66.19 in extension.
Comment: RSI is at above 50 levels and pairs above its 20MA.
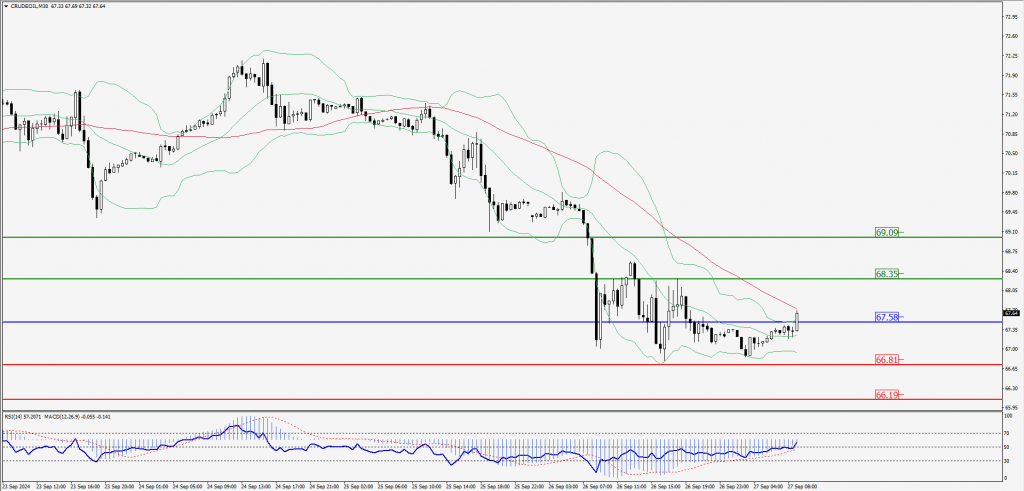
Green Lines Indicate Resistance Levels – Red Lines Indicate Support Levels
Light Blue is a Pivot Point – Black represents the price when the report was produced
XAU/USD Intraday: Trend on the downside
Our pivot point is at 2669.50
Preferable Price Action: Further downside to 2660.10 and 2651.90.
Alternative Price Action: If the price gives an upside breakout of a pivot, then the price extends to 2678.40 and 2686.50.
Comment: MACD is below 50 levels and pairs below its 20MA.
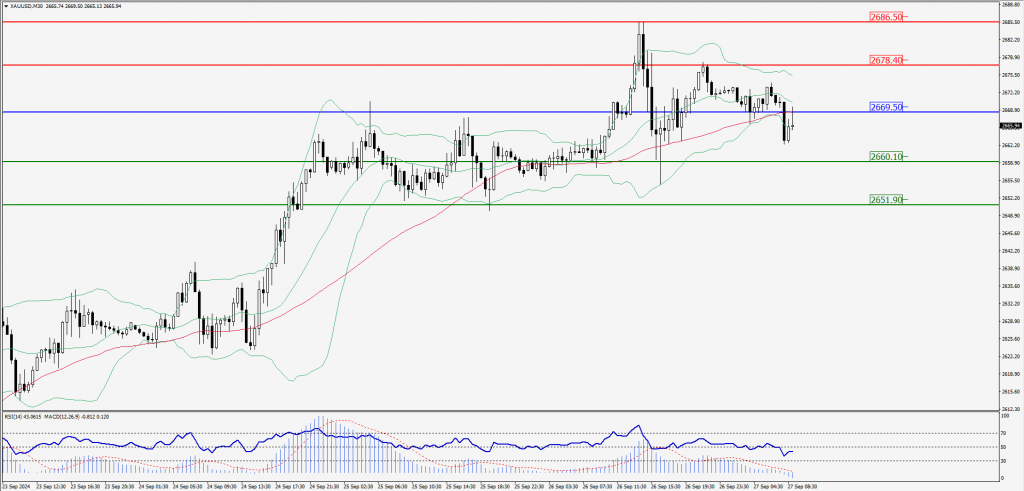
Green Lines Indicate Resistance Levels – Red Lines Indicate Support Levels
Light Blue is a Pivot Point – Black represents the price when the report was produced
Dow Jones Intraday: Support level at 42,166.10
Our pivot point is 42,166.10
Preferable Price Action: Take buy positions above the pivot with targets at 42,228.60 & 42,284.70.
Alternative Price Action: Below 42,166.10 looks for further downside to 42,100.90 & 42,044.90.
Comment: RSI is above 50 levels and pairs above its 55MA.
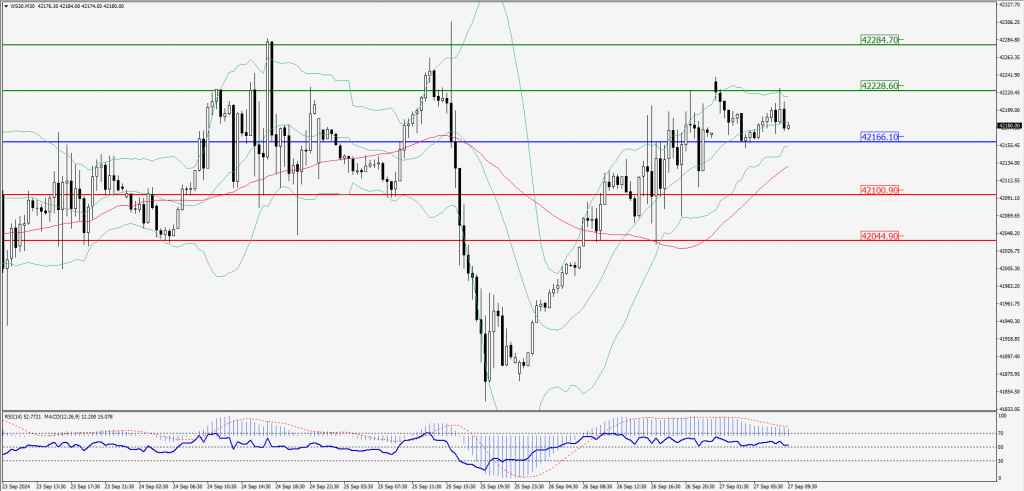
Green Lines Indicate Resistance Levels – Red Lines Indicate Support Levels
Light Blue is a Pivot Point – Black represents the price when the report was produced