Market Wrap: Stocks, Bonds, Commodities
The dollar held firm on Thursday following its sharpest rally since early June as traders looked ahead to speeches from key Federal Reserve policymakers later in the day for clues on the pace of interest rate cuts.
The Dow Jones Industrial Average fail 293.47 points to 41,914.75, the S&P 500 loss 0.19% to 5,722.26 and the Nasdaq Composite ascend 7.69 points to 18,082.21.
MSCI’s index of Asia-Pacific stocks outside Japan is up 2.58% to 747.89 levels. The Australian index was higher by 0.95% to 8,203.70. Japanese Nikkei Index increase 2.41% today.
European stocks were positive on Thursday, with the Stoxx Europe 50 Index increase 1.74% to 5,002.55 Germany’s DAX ascend 1.15% to 19,140.25, and France’s CAC higher 1.70% to 7,694.59 and U.K.’s FTSE 100 gain 0.56% to 8,315.25.
Benchmark 10-year U.S. Treasury fail as demand for safe assets slipped again, today 10-year bond yields 0.08% to 3.7880.
Oil prices dropped on Thursday, reversing earlier gains, as news of top exporter Saudi Arabia giving up its crude oil price target in preparation for expanded production weighed on the market.
Spot Brent crude oil decrease 2.03% to $71.42 per barrel. US West Texas Intermediate crude is decrease 2.11% to $68.22 a barrel.
The yellow metal gold is up 0.14% to 2,688.50 dollars per ounce.
Market Wrap: Forex
Most Asian currencies firmed on Thursday while the dollar steadied before more cues on interest rates, especially from an address by Federal Reserve Chair Jerome Powell later in the day.
Today, the U.S. dollar index measures the Greenback against a trade-weighted basket of six major currencies, which increase 0.03% to 100.94.
The Euro US Dollar (EUR/USD) is a widely traded is up 0.02% today. This left the pair trading around $1.11340.
The Japanese yen was will move positive against the U.S. dollar on Thursday. Today USD/JPY is trades pair that increase 0.30% to the 145.190 level.
Another commodity-related currency positive against the U.S dollar, AUD/USD gain 0.54% to 0.68580, and NZD/USD increase 0.26% to 0.62780 level.
EUR/USD Intraday: Trend on the upside
Our pivot point is at 1.11490
Preferable Price Action: Take buy positions above pivot level with targets at 1.11680 & 1.11840 in extension.
Alternative Price Action: Sell pivot looks for a further downside to 1.11320 & 1.11140.
Comment: RSI is above 50 levels and Pairs above its 20MA.
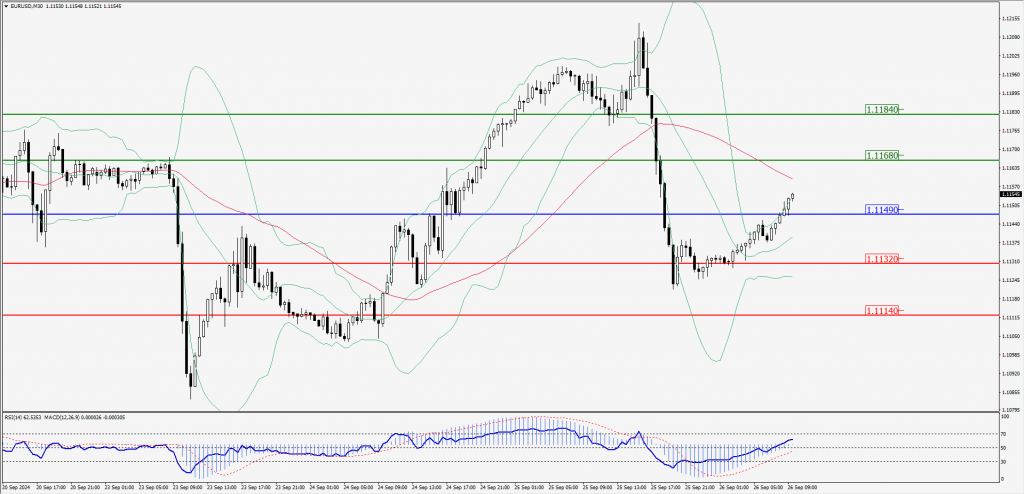
Green Lines Indicate Resistance Levels – Red Lines Indicate Support Levels
Light Blue is a Pivot Point – Black represents the price when the report was produced
GBP/USD Intraday: Trend on the upside
Our pivot point is at 1.33430
Preferable Price Action: Buy positions above pivot with targets at 1.33660 & 1.33890 in extension.
Alternative Price Action: The price below pivot would call for further downside to 1.33220 & 1.32990.
Comment: RSI is above 50 levels and Pairs above its 20MA.
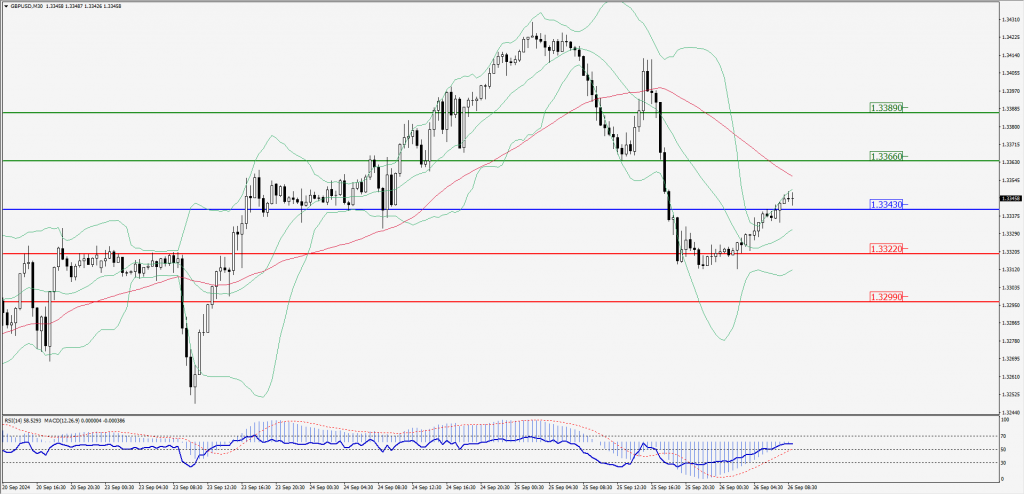
Green Lines Indicate Resistance Levels – Red Lines Indicate Support Levels
Light Blue is a Pivot Point – Black represents the price when the report was produced
USD/JPY Intraday: Trend on the upside
Our pivot point is at 144.690
Preferable Price Action: Buy position above pivot with the target at 144.930 and 145.160 in extension.
Alternative Price Action: The downside breakout of the pivot would call for 144.450 and 144.220.
Comment: MACD is above 50 levels and Pairs above its 55MA.
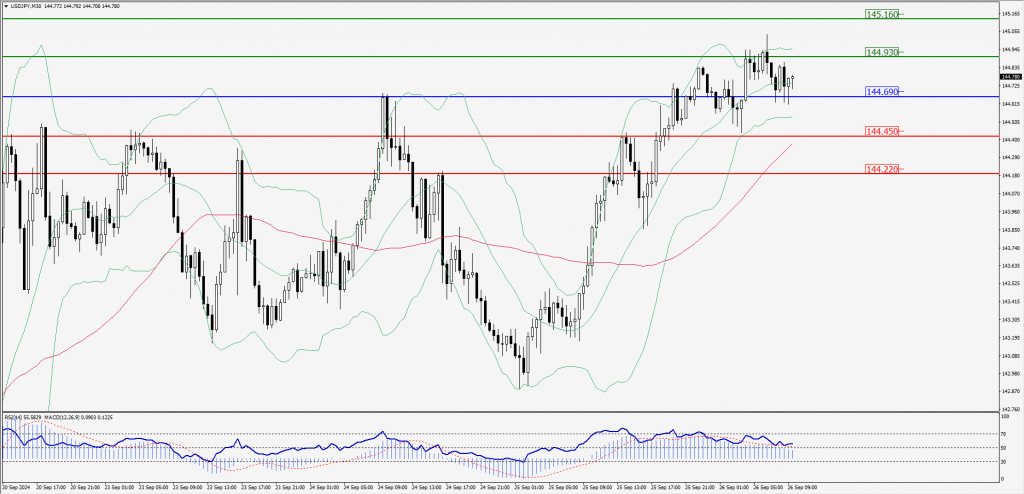
Green Lines Indicate Resistance Levels – Red Lines Indicate Support Levels
Light Blue is a Pivot Point – Black represents the price when the report was produced
AUD/USD Intraday: Major trend on the upside
Our pivot point is at 0.68610
Preferable Price Action: Buy positions above pivot with targets at 0.68770 & 0.68910 in extension.
Alternative Price Action: Below pivot a further downside with 0.68450 & 0.68320 as targets.
Comment: RSI is above 50 levels and pairs above its 20MA & 55MA.
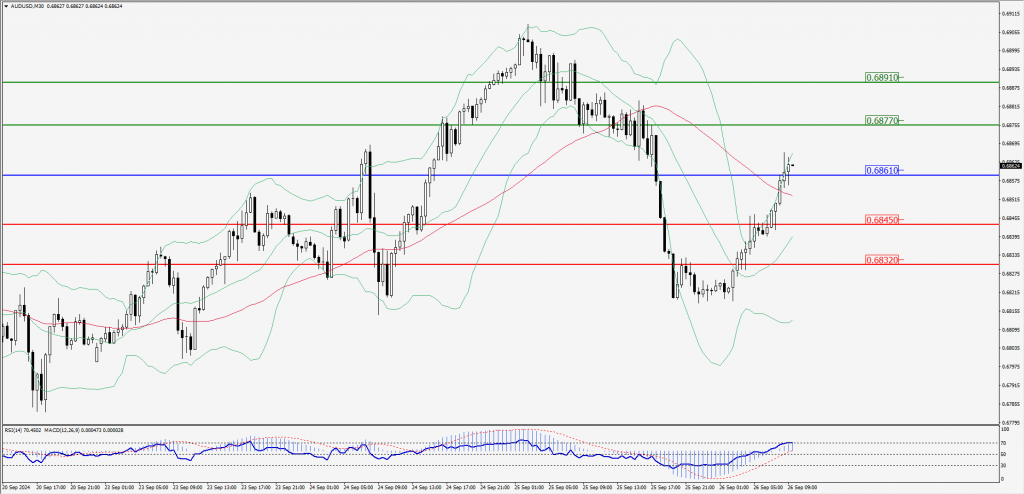
Green Lines Indicate Resistance Levels – Red Lines Indicate Support Levels
Light Blue is a Pivot Point – Black represents the price when the report was produced
CRUDEOIL Intraday: Trend on the downside
Our pivot point is at 68.18
Preferable Price Action: Below pivot sell oil with 67.56 & 66.93 as targets.
Alternative Price Action: Buy crude above pivot with targets at 68.79 and 69.35 in extension.
Comment: RSI is at below 50 levels and pairs below its 20MA & 55MA.
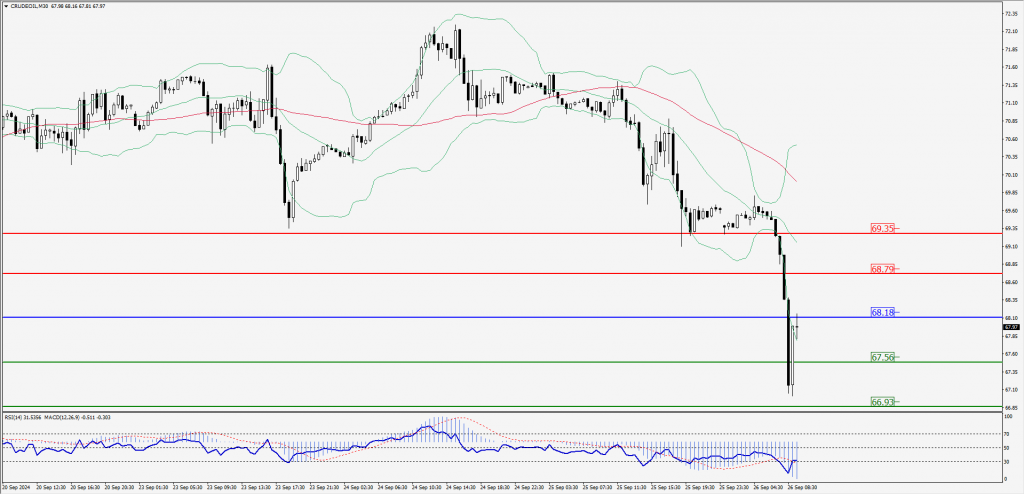
Green Lines Indicate Resistance Levels – Red Lines Indicate Support Levels
Light Blue is a Pivot Point – Black represents the price when the report was produced
XAU/USD Intraday: Trend on the upside
Our pivot point is at 2661.20
Preferable Price Action: Further upside to 2670.60 and 2679.80.
Alternative Price Action: If the price gives an downside breakout of a pivot, then the price extends to 2651.40 and 2642.80.
Comment: MACD is above 50 levels and pairs above its 55MA.
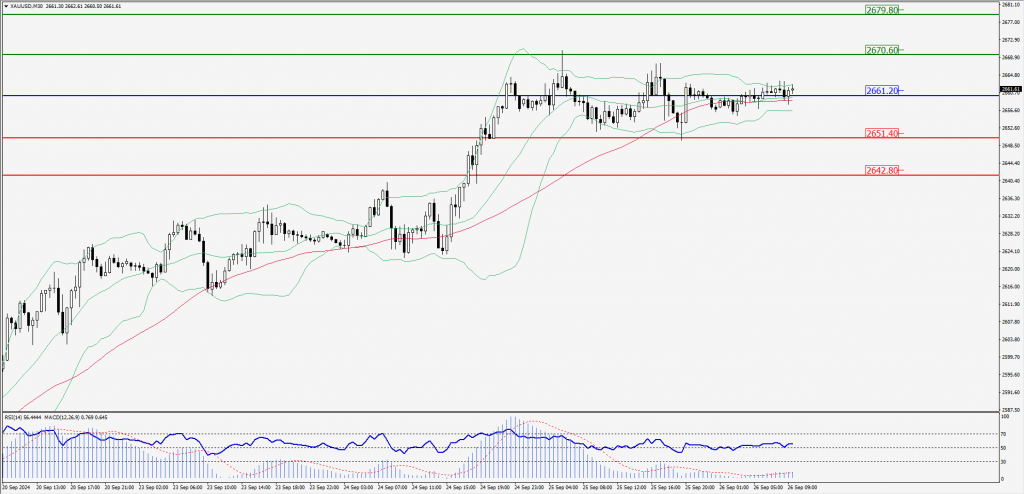
Green Lines Indicate Resistance Levels – Red Lines Indicate Support Levels
Light Blue is a Pivot Point – Black represents the price when the report was produced
Dow Jones Intraday: Trend on the upside
Our pivot point is 42,062.40
Preferable Price Action: Take buy positions above the pivot with targets at 42,122.40 & 41,175.80.
Alternative Price Action: Below 42,128.60 looks for further downside to 42,006.40 & 41,953.60.
Comment: RSI is above 50 levels and pairs above its 55MA & 20MA.
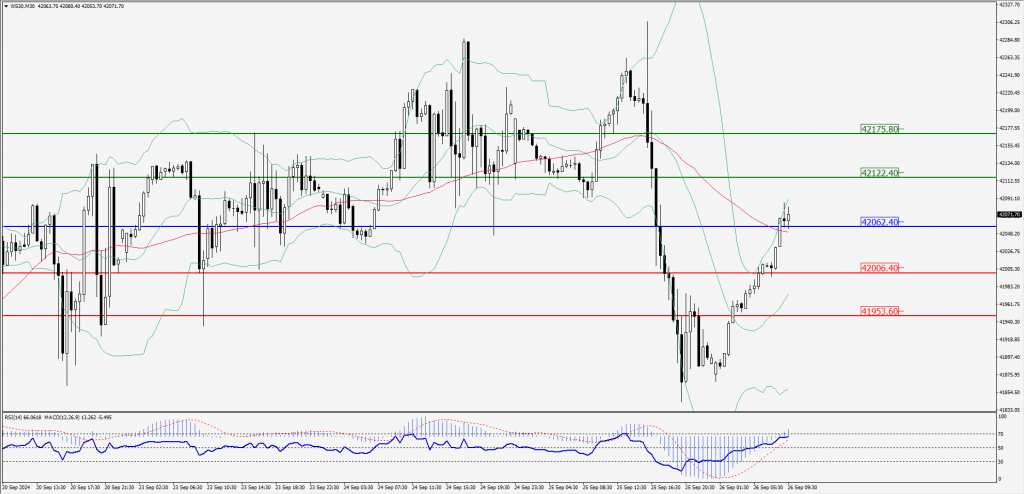
Green Lines Indicate Resistance Levels – Red Lines Indicate Support Levels
Light Blue is a Pivot Point – Black represents the price when the report was produced