Market Wrap: Stocks, Bonds, Commodities
The Australian dollar rose to its highest level this year on Tuesday as the central bank reiterated its determination to tame stubborn inflation, while the yuan climbed to a 16-month peak after fresh stimulus steps from China.
The Dow Jones Industrial Average rose 61.29 points to 42,124.65, the S&P 500 gain 0.28% to 5,718.57 and the Nasdaq Composite ascend 25.95 points to 17,974.27.
MSCI’s index of Asia-Pacific stocks outside Japan is up 1.94% to 725.99 levels. The Australian index was lower by 0.13% to 8,142.00. Japanese Nikkei Index increase 0.75% today.
European stocks were positive on Monday, with the Stoxx Europe 50 Index increase 1.16% to 4,942.15 Germany’s DAX ascend 0.90% to 18,997.75, and France’s CAC higher 1.31% to 7,606.10 and U.K.’s FTSE 100 gain 0.47% to 8,298.41.
Benchmark 10-year U.S. Treasury rose as demand for safe assets slipped again, today 10-year bond yields 0.89% to 3.7730.
Oil prices rose on Tuesday on news of monetary stimulus from top importer China and concerns that tensions in the Middle East could hit regional supply, while a major hurricane loomed over the United States, the world’s biggest crude producer.
Spot Brent crude oil increase 1.23% to $74.11 per barrel. US West Texas Intermediate crude is increase 1.41% to $71.36 a barrel.
The yellow metal gold is up 0.03% to 2,653.25 dollars per ounce.
Market Wrap: Forex
Most Asian currencies advanced on Tuesday with the Chinese yuan supported by Beijing announcing more stimulus measures, while the Australian dollar rose in anticipation of hawkish signals from the Reserve Bank.
Today, the U.S. dollar index measures the Greenback against a trade-weighted basket of six major currencies, which increase 0.14% to 101.000.
The Euro US Dollar (EUR/USD) is a widely traded is up 0.10% today. This left the pair trading around $1.11230.
The Japanese yen was will move positive against the U.S. dollar on Monday. Today USD/JPY is trades pair that increase 0.73% to the 144.660 level.
Another commodity-related currency mixed against the U.S dollar, AUD/USD loss 0.07% to 0.68340, and NZD/USD increase 0.11% to 0.62720 level.
EUR/USD Intraday: Trend on the downside
Our pivot point is at 1.11170
Preferable Price Action: Take sell positions below pivot level with targets at 1.11020 & 1.11020 in extension.
Alternative Price Action: Buy pivot looks for a further upside to 1.11330 & 1.11470.
Comment: RSI is below 50 levels and Pairs below its 55MA.
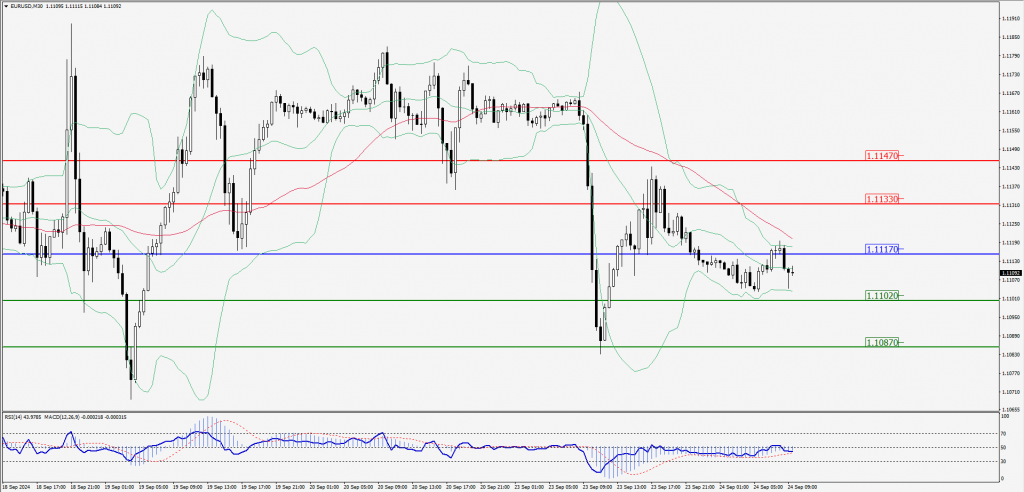
Green Lines Indicate Resistance Levels – Red Lines Indicate Support Levels
Light Blue is a Pivot Point – Black represents the price when the report was produced
GBP/USD Intraday: Trend on the downside
Our pivot point is at 1.33520
Preferable Price Action: Sell positions below pivot with targets at 1.33200 & 1.32970 in extension.
Alternative Price Action: The price above pivot would call for further upside to 1.33820 & 1.34060.
Comment: RSI is below 50 levels and Pairs below its 55MA.
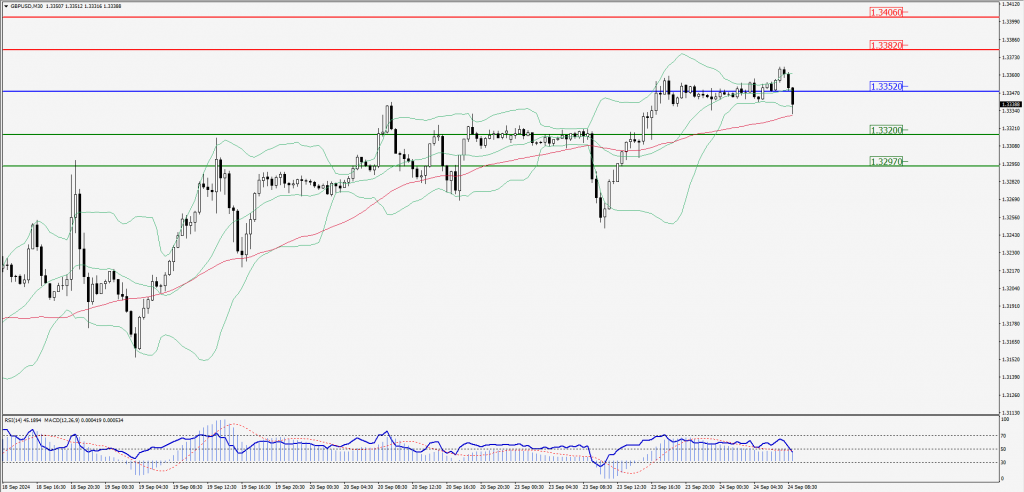
Green Lines Indicate Resistance Levels – Red Lines Indicate Support Levels
Light Blue is a Pivot Point – Black represents the price when the report was produced
USD/JPY Intraday: Trend on the upside
Our pivot point is at 144.200
Preferable Price Action: Buy position above pivot with the target at 144.860 and 145.400 in extension.
Alternative Price Action: The downside breakout of the pivot would call for 143.540 and 142.950.
Comment: MACD is above 50 levels and Pairs above its 20MA & 55MA.
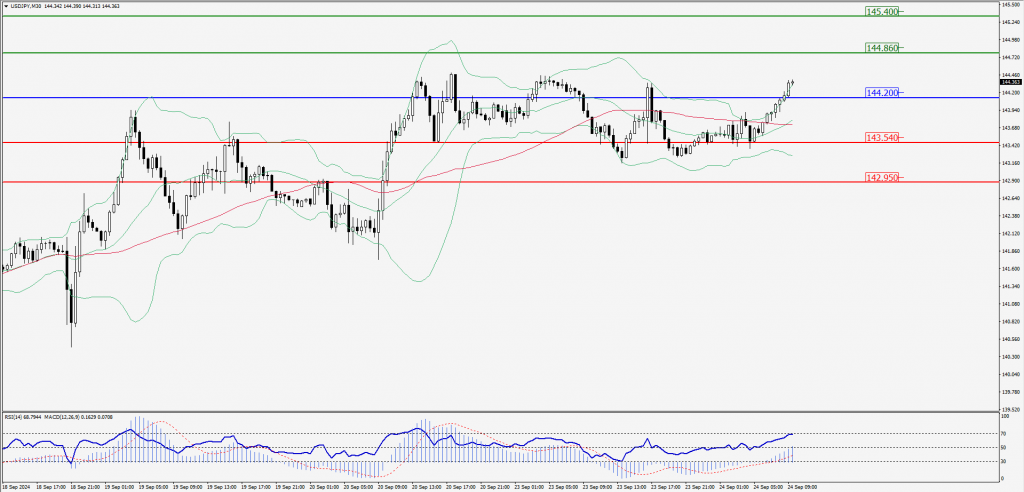
Green Lines Indicate Resistance Levels – Red Lines Indicate Support Levels
Light Blue is a Pivot Point – Black represents the price when the report was produced
AUD/USD Intraday: Trend on the upside
Our pivot point is at 0.68310
Preferable Price Action: Buy positions above pivot with targets at 0.68480 & 0.68630 in extension.
Alternative Price Action: Below pivot a further downside with 0.68150 & 0.68010 as targets.
Comment: RSI is above 50 levels.
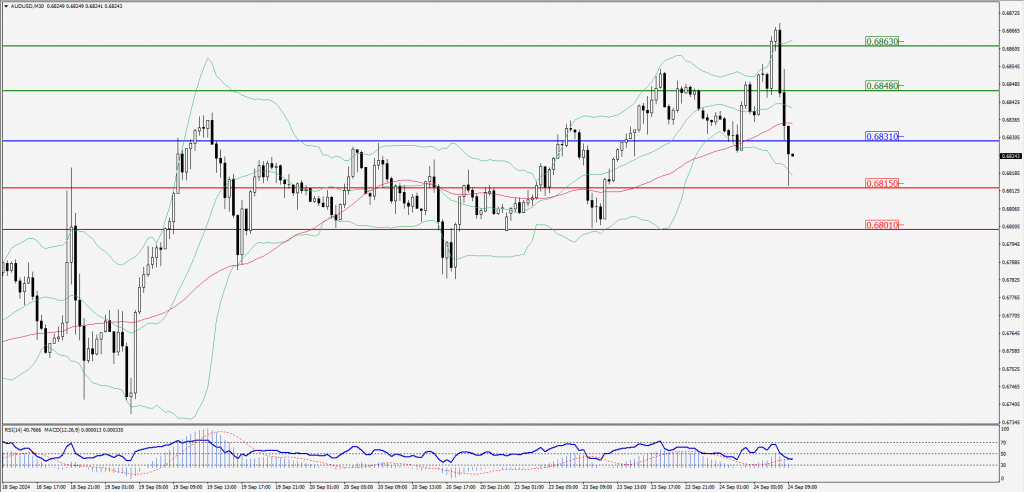
Green Lines Indicate Resistance Levels – Red Lines Indicate Support Levels
Light Blue is a Pivot Point – Black represents the price when the report was produced
CRUDEOIL Intraday: Trend on the upside
Our pivot point is at 71.01
Preferable Price Action: Above pivot buy oil with 71.37 & 71.68 as targets.
Alternative Price Action: Sell crude below pivot with targets at 70.64 and 70.32 in extension.
Comment: RSI is at above 50 levels and pairs above its 20MA & 55MA.
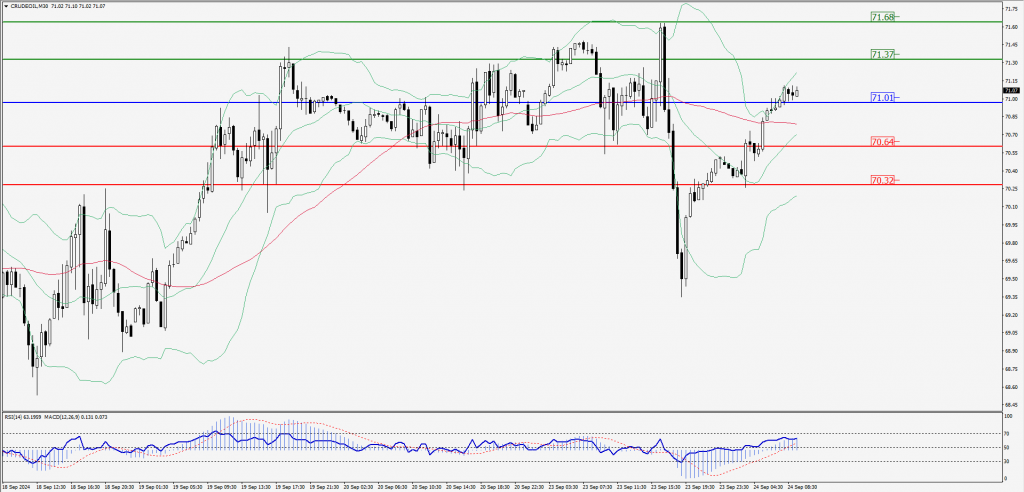
Green Lines Indicate Resistance Levels – Red Lines Indicate Support Levels
Light Blue is a Pivot Point – Black represents the price when the report was produced
XAU/USD Intraday: Trend on the downside
Our pivot point is at 2633.50
Preferable Price Action: Further downside to 2622.80 and 2612.60.
Alternative Price Action: If the price gives an upside breakout of a pivot, then the price extends to 2643.40 and 2653.90.
Comment: MACD is below 50 levels.
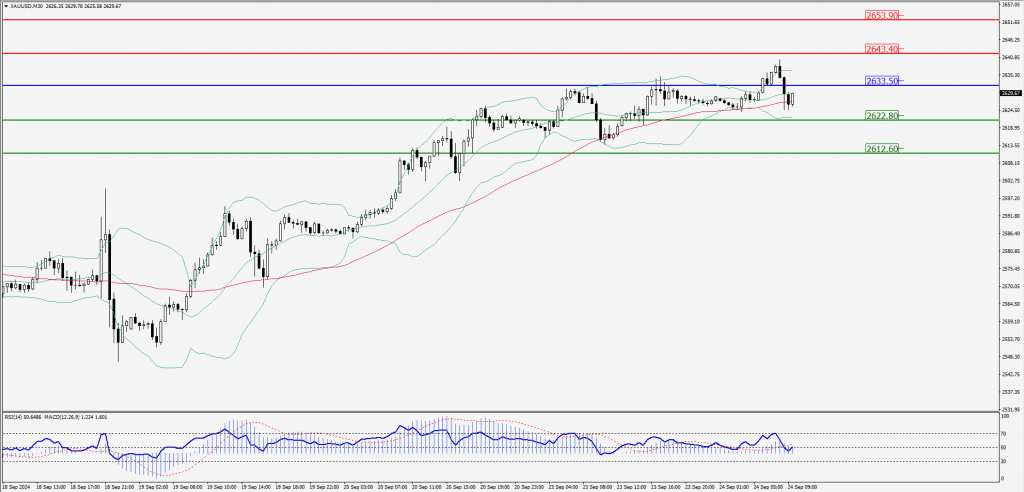
Green Lines Indicate Resistance Levels – Red Lines Indicate Support Levels
Light Blue is a Pivot Point – Black represents the price when the report was produced
Dow Jones Intraday: Trend on the upside
Our pivot point is 42,123.30
Preferable Price Action: Take buy positions above the pivot with targets at 42,225.90 & 42,306.90.
Alternative Price Action: Below 42,123.30 looks for further downside to 42,013.90 & 41,927.50.
Comment: RSI is above 50 levels and pairs above its 55MA & 20MA.
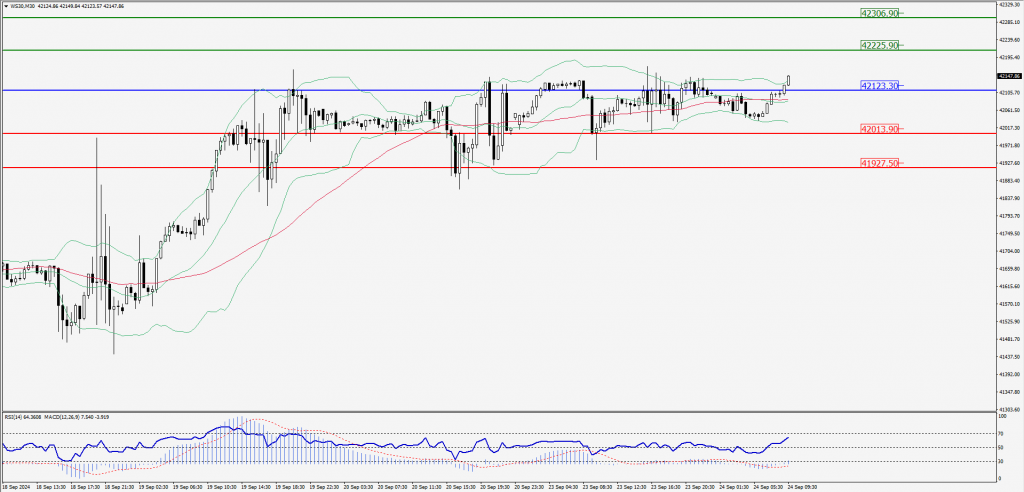
Green Lines Indicate Resistance Levels – Red Lines Indicate Support Levels
Light Blue is a Pivot Point – Black represents the price when the report was produced