Market Wrap: Stocks, Bonds, Commodities
Wall Street’s main indexes closed higher on Friday as investors honed in on the chance of a bigger interest rate cut by the Federal Reserve next week, with rate-sensitive small cap stocks outperforming.
The Dow Jones Industrial Average rose 297.01 points to 41,393.78, the S&P 500 gain 0.54% to 5,626.00 and the Nasdaq Composite ascend 114.30 points to 17,683.98.
MSCI’s index of Asia-Pacific stocks outside Japan is up 0.82% to 695.81 levels. The Australian index was higher by 0.27% to 8,121.60. Japanese Nikkei Index decrease 0.68% today.
European stocks were negative on Monday, with the Stoxx Europe 50 Index decrease 0.01% to 4,843.65 Germany’s DAX descend 0.18% to 18,654.35, and France’s CAC lower 0.07% to 7,460.24 and U.K.’s FTSE 100 loss 0.13% to 8,262.25.
Benchmark 10-year U.S. Treasury fail as demand for safe assets slipped again, today 10-year bond yields 0.33% to 3.6350.
Oil prices edged up in early trade on Monday amid expectations of a U.S. interest rate cut this week, though gains were capped by U.S. supply resumptions following Hurricane Francine and weaker China data.
Spot Brent crude oil increase 0.59% to $72.03 per barrel. US West Texas Intermediate crude is increase 0.71% to $68.23 a barrel.
The yellow metal gold is down 0.02% to 2,610.20 dollars per ounce.
Market Wrap: Forex
The yen hit its highest levels in more than a year on Monday in trading thinned by a holiday in Japan, as market participants increasingly expected an oversized rate cut by the Federal Reserve later this week.
Today, the U.S. dollar index measures the Greenback against a trade-weighted basket of six major currencies, which decrease 0.36% to 100.75.
The Euro US Dollar (EUR/USD) is a widely traded is up 0.32% today. This left the pair trading around $1.11110.
The Japanese yen was will move negative against the U.S. dollar on Monday. Today USD/JPY is trades pair that decrease 0.68% to the 139.870 level.
Another commodity-related currency positive against the U.S dollar, AUD/USD gain 0.29% to 0.67230, and NZD/USD increase 0.34% to 0.61770 level.
EUR/USD Intraday: Trend on the upside
Our pivot point is at 1.11050
Preferable Price Action: Take buy positions above pivot level with targets at 1.11220 & 1.11350 in extension.
Alternative Price Action: Sell pivot looks for a further downside to 1.10880 & 1.10750.
Comment: RSI is above 50 levels and Pairs above its 55MA & 20MA.
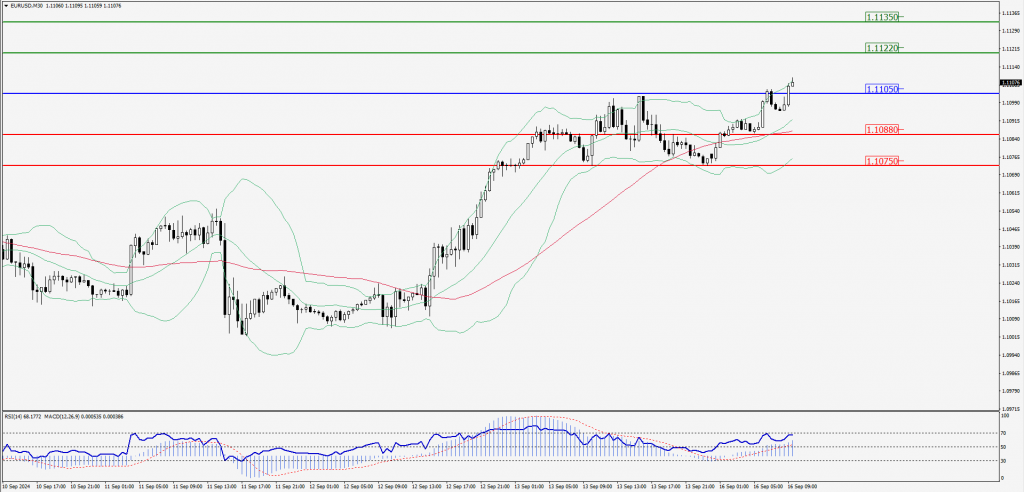
Green Lines Indicate Resistance Levels – Red Lines Indicate Support Levels
Light Blue is a Pivot Point – Black represents the price when the report was produced
GBP/USD Intraday: Trend on the upside
Our pivot point is at 1.31580
Preferable Price Action: Buy positions above pivot with targets at 1.31870 & 1.32110 in extension.
Alternative Price Action: The price below pivot would call for further downside to 1.31320 & 1.31060.
Comment: RSI is above 50 levels and Pairs above its 55MA & 20MA.
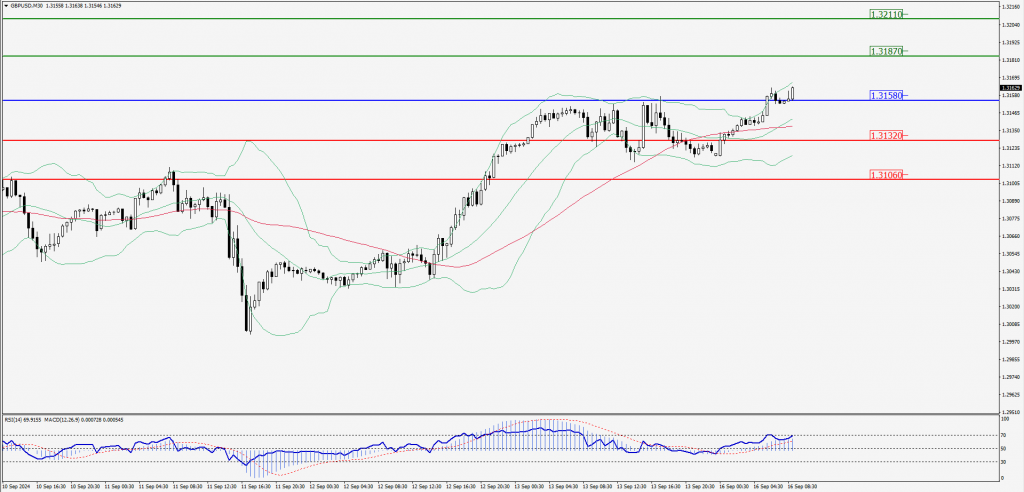
Green Lines Indicate Resistance Levels – Red Lines Indicate Support Levels
Light Blue is a Pivot Point – Black represents the price when the report was produced
USD/JPY Intraday: Trend on the downside
Our pivot point is at 140.110
Preferable Price Action: Sell position below pivot with the target at 139.560 and 139.150 in extension.
Alternative Price Action: The upside breakout of the pivot would call for 140.670 and 141.100.
Comment: MACD is below 50 levels and Pairs below its 55MA & 20MA.
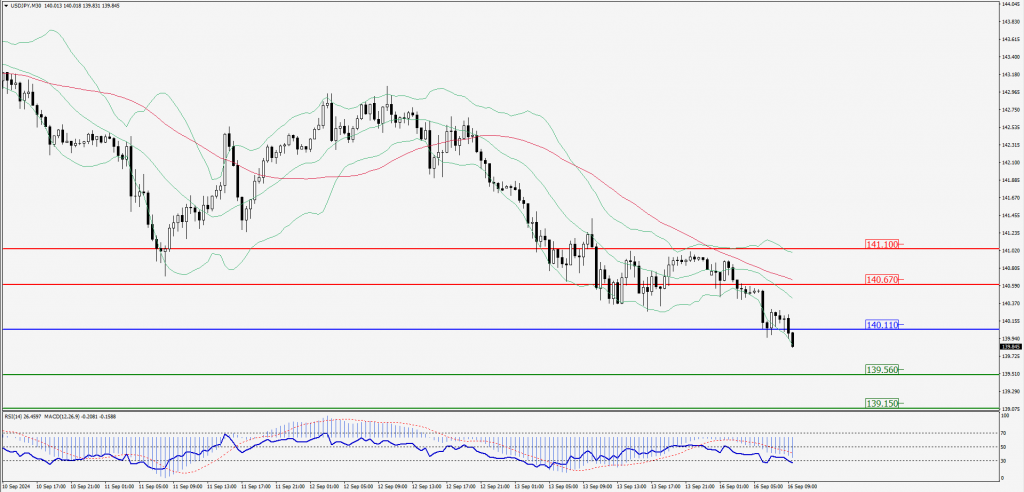
Green Lines Indicate Resistance Levels – Red Lines Indicate Support Levels
Light Blue is a Pivot Point – Black represents the price when the report was produced
AUD/USD Intraday: Trend on the upside
Our pivot point is at 0.67230
Preferable Price Action: Buy positions above pivot with targets at 0.67390 & 0.67540 in extension.
Alternative Price Action: Below pivot a further downside with 0.67060 & 0.66900 as targets.
Comment: RSI is above 50 levels and pairs above its 20MA & 55MA.
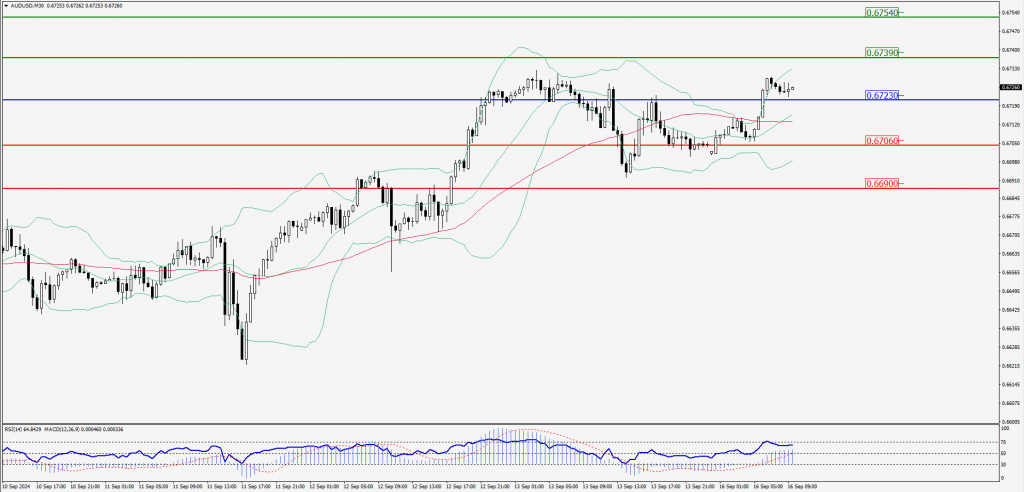
Green Lines Indicate Resistance Levels – Red Lines Indicate Support Levels
Light Blue is a Pivot Point – Black represents the price when the report was produced
CRUDEOIL Intraday: Trend on the upside
Our pivot point is at 68.01
Preferable Price Action: Above pivot buy oil with 68.59 & 69.13 as targets.
Alternative Price Action: Sell crude below pivot with targets at 67.42 and 66.89 in extension.
Comment: RSI is at above 50 levels and pairs above its 20MA.
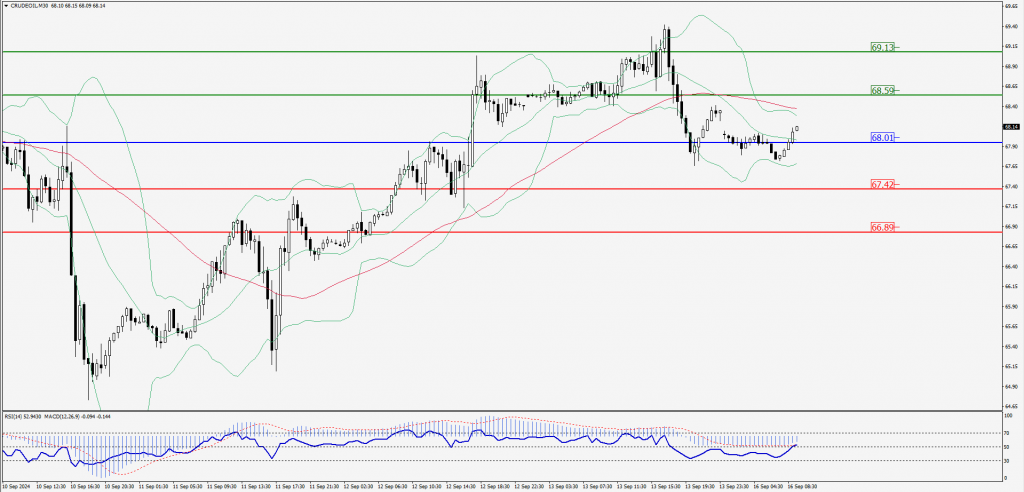
Green Lines Indicate Resistance Levels – Red Lines Indicate Support Levels
Light Blue is a Pivot Point – Black represents the price when the report was produced
XAU/USD Intraday: Trend on the upside
Our pivot point is at 2585.00
Preferable Price Action: Further upside to 2598.80 and 2612.30.
Alternative Price Action: If the price gives an downside breakout of a pivot, then the price extends to 2569.10 and 2556.30.
Comment: MACD is above 50 levels and pairs above its 20MA & 55MA.
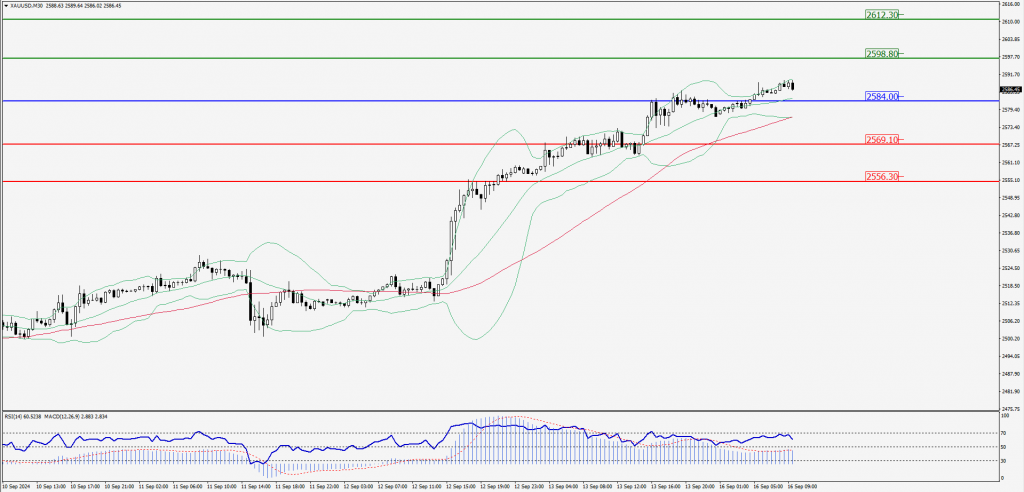
Green Lines Indicate Resistance Levels – Red Lines Indicate Support Levels
Light Blue is a Pivot Point – Black represents the price when the report was produced
Dow Jones Intraday: Trend on the downside
Our pivot point is 41,446.60
Preferable Price Action: Take sell positions below the pivot with targets at 41,238.40 & 41,041.90.
Alternative Price Action: Above 41,446.60 looks for further upside to 41,640.20 & 41,833.70.
Comment: RSI is below 50 levels and pairs below its 20MA.
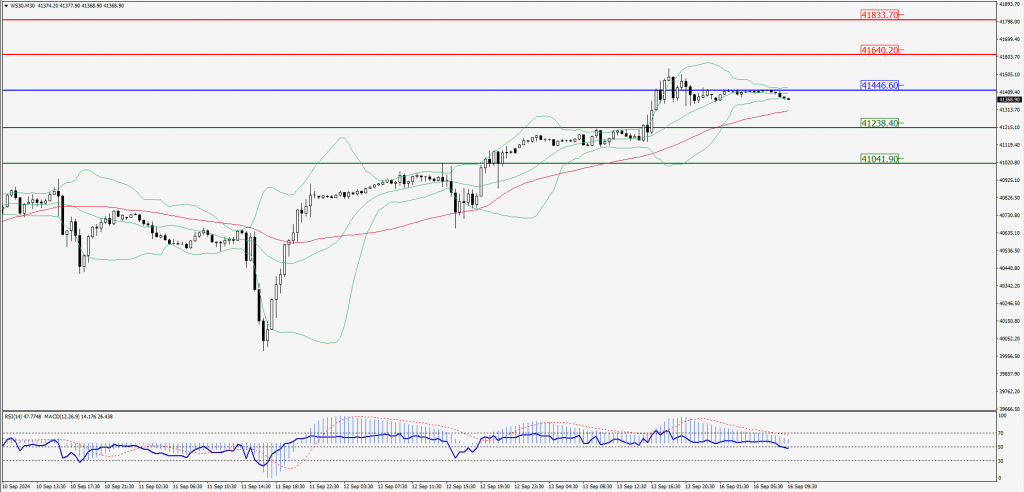
Green Lines Indicate Resistance Levels – Red Lines Indicate Support Levels
Light Blue is a Pivot Point – Black represents the price when the report was produced