Market Wrap: Stocks, Bonds, Commodities
Wall Street’s main indexes closed higher on Thursday after the latest inflation data reinforced expectations for a 25-basis point rate cut by the Federal Reserve, while Modena’s weak revenue forecast made it the S&P 500’s biggest percentage loser.
The Dow Jones Industrial Average rose 235.06 points to 41,096.77, the S&P 500 gain 0.75% to 5,595.76 and the Nasdaq Composite ascend 174.15 points to 17,569.68.
MSCI’s index of Asia-Pacific stocks outside Japan is up 2.24% to 693.77 levels. The Australian index was higher by 0.30% to 8,099.90. Japanese Nikkei Index decrease 0.78% today.
European stocks were mixed on Friday, with the Stoxx Europe 50 Index increase 0.28% to 4,827.65 Germany’s DAX ascend 0.45% to 18,590.15, and France’s CAC higher 0.30% to 7,457.31 and U.K.’s FTSE 100 loss 0.03% to 8,238.26.
Benchmark 10-year U.S. Treasury fail as demand for safe assets slipped again, today 10-year bond yields 1.08% to 3.6370.
Oil prices rose on Friday, extending a rally sparked by output disruptions in the US Gulf of Mexico, where Hurricane Francine forced producers to evacuate platforms before it hit the coast of Louisiana.
Spot Brent crude oil increase 0.69% to $72.47 per barrel. US West Texas Intermediate crude is increase 0.70% to $69.45 a barrel.
The yellow metal gold is up 0.53% to 2,594.20 dollars per ounce.
Market Wrap: Forex
Investors on Friday ratcheted up bets for a super-sized Federal Reserve interest rate cut next week, after media reports suggested the decision would be a closer call for officials than previously thought.
Today, the U.S. dollar index measures the Greenback against a trade-weighted basket of six major currencies, which decrease 0.37% to 100.99.
The Euro US Dollar (EUR/USD) is a widely traded is up 0.14% today. This left the pair trading around $1.10900.
The Japanese yen was will move negative against the U.S. dollar on Friday. Today USD/JPY is trades pair that decrease 0.67% to the 140.840 level.
Another commodity-related currency mixed against the U.S dollar, AUD/USD loss 0.11% to 0.67140, and NZD/USD increase 0.02% to 0.61830 level.
EUR/USD Intraday: Trend on the upside
Our pivot point is at 1.10750
Preferable Price Action: Take buy positions above pivot level with targets at 1.10850 & 1.10920 in extension.
Alternative Price Action: Sell pivot looks for a further downside to 1.10660 & 1.10580.
Comment: RSI is above 50 levels and Pairs above its 55MA.
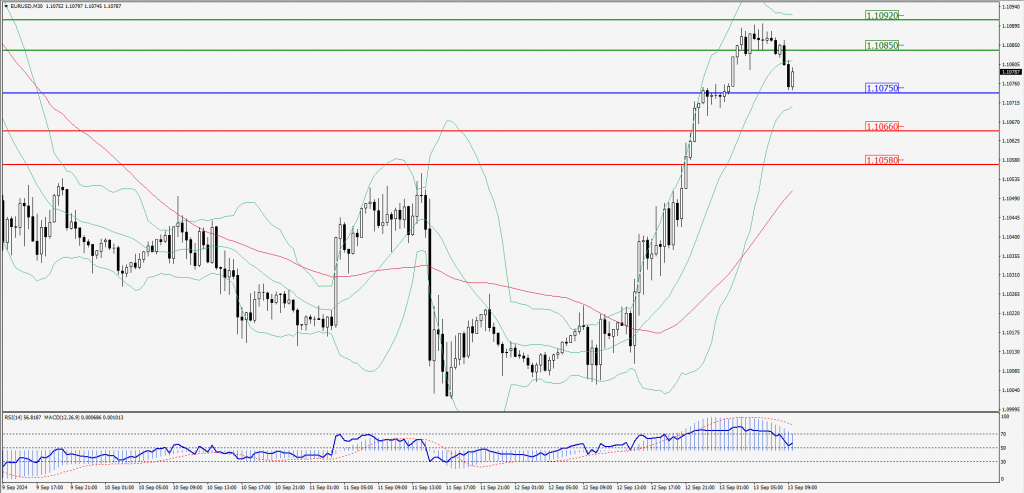
Green Lines Indicate Resistance Levels – Red Lines Indicate Support Levels
Light Blue is a Pivot Point – Black represents the price when the report was produced
GBP/USD Intraday: Trend on the upside
Our pivot point is at 1.31300
Preferable Price Action: Buy positions above pivot with targets at 1.31490 & 1.31670 in extension.
Alternative Price Action: The price below pivot would call for further downside to 1.31100 & 1.30920.
Comment: RSI is above 50 levels and Pairs above its 55MA.
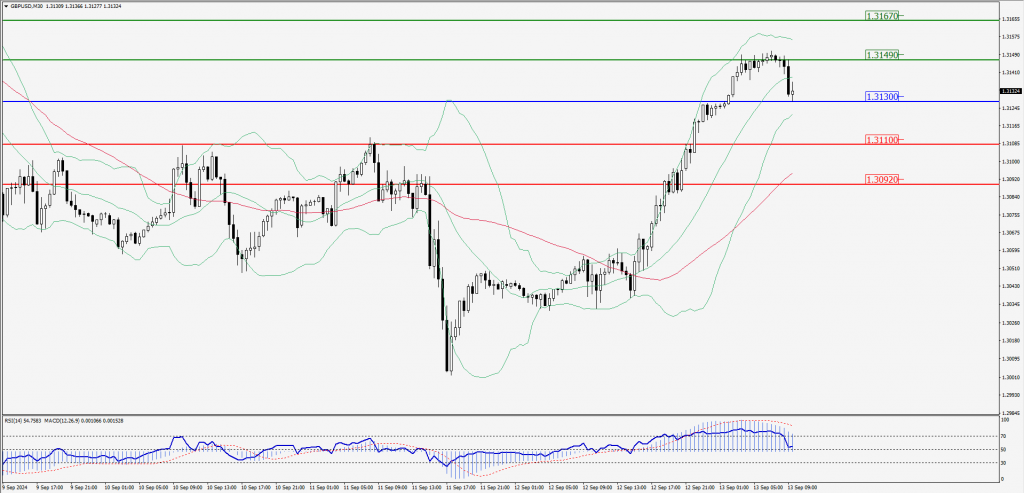
Green Lines Indicate Resistance Levels – Red Lines Indicate Support Levels
Light Blue is a Pivot Point – Black represents the price when the report was produced
USD/JPY Intraday: Trend on the downside
Our pivot point is at 141.270
Preferable Price Action: Sell position below pivot with the target at 140.930 and 140.630 in extension.
Alternative Price Action: The upside breakout of the pivot would call for 141.600 and 141.920.
Comment: MACD is below 50 levels and Pairs below its 55MA & 20MA.
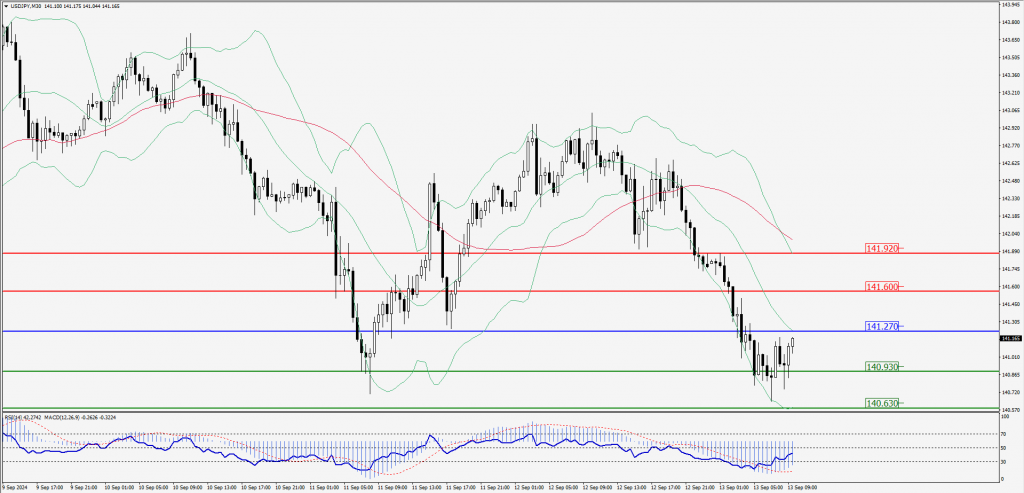
Green Lines Indicate Resistance Levels – Red Lines Indicate Support Levels
Light Blue is a Pivot Point – Black represents the price when the report was produced
AUD/USD Intraday: Trend on the downside
Our pivot point is at 0.67220
Preferable Price Action: Sell positions below pivot with targets at 0.67090 & 0.66960 in extension.
Alternative Price Action: Above pivot a further upside with 0.67350 & 0.67460 as targets.
Comment: RSI is below 50 levels and pairs below its 20MA.
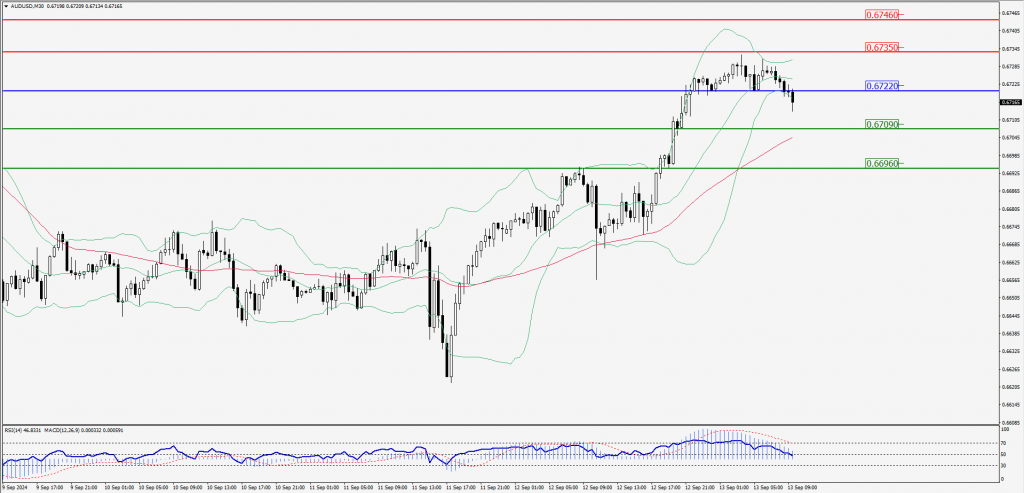
Green Lines Indicate Resistance Levels – Red Lines Indicate Support Levels
Light Blue is a Pivot Point – Black represents the price when the report was produced
CRUDEOIL Intraday: Trend on the upside
Our pivot point is at 68.46
Preferable Price Action: Above pivot buy oil with 69.02 & 69.54 as targets.
Alternative Price Action: Sell crude below pivot with targets at 67.91 and 67.41 in extension.
Comment: RSI is at above 50 levels and pairs above its 55MA.
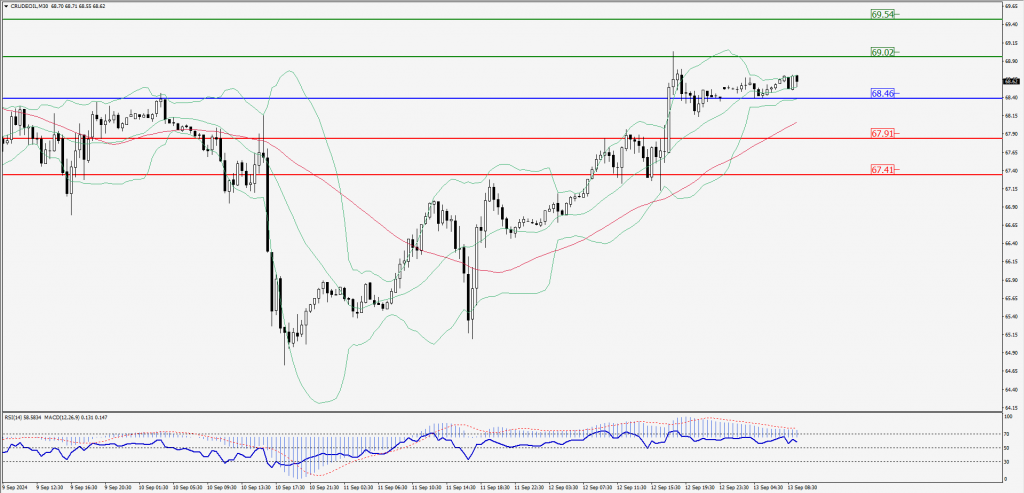
Green Lines Indicate Resistance Levels – Red Lines Indicate Support Levels
Light Blue is a Pivot Point – Black represents the price when the report was produced
XAU/USD Intraday: Trend on the upside
Our pivot point is at 2565.70
Preferable Price Action: Further upside to 2577.50 and 2588.20.
Alternative Price Action: If the price gives an downside breakout of a pivot, then the price extends to 2554.10 and 2543.70.
Comment: MACD is above 50 levels and pairs above its 20MA & 55MA.
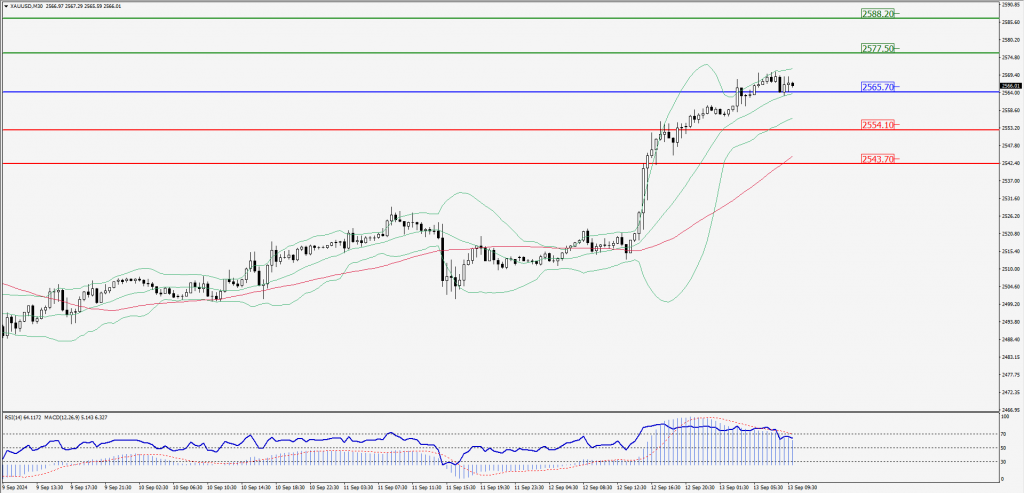
Green Lines Indicate Resistance Levels – Red Lines Indicate Support Levels
Light Blue is a Pivot Point – Black represents the price when the report was produced
Dow Jones Intraday: Trend on the upside
Our pivot point is 41,127.80
Preferable Price Action: Take buy positions above the pivot with targets at 41,303.10 & 41,448.10.
Alternative Price Action: Below 41,127.80 looks for further downside to 40,952.40 & 40,791.10.
Comment: RSI is above 50 levels and pairs above its 55MA & 20MA.
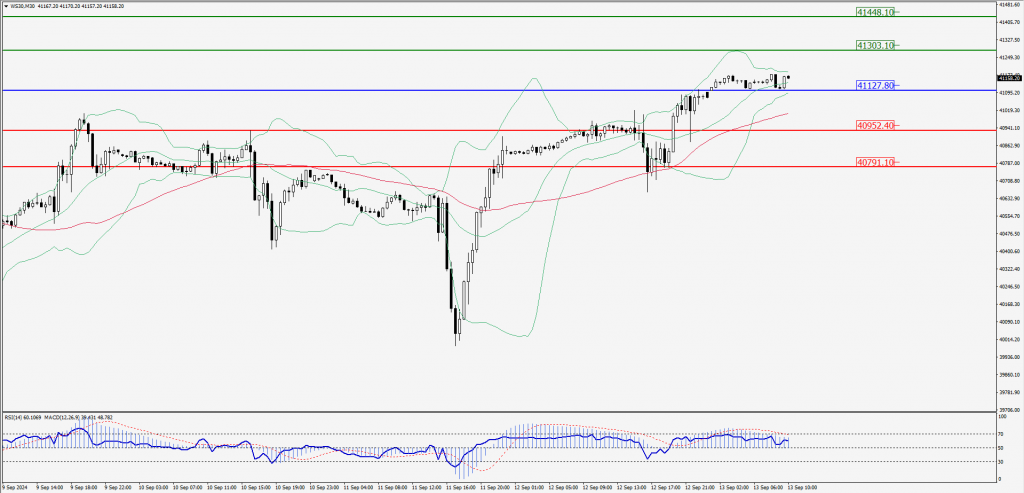
Green Lines Indicate Resistance Levels – Red Lines Indicate Support Levels
Light Blue is a Pivot Point – Black represents the price when the report was produced