Market Wrap: Stocks, Bonds, Commodities
Wall Street’s three major indexes gained more than 1 percent on Monday as investors looked for bargains after the previous week’s sell-off and waited for inflation reports in the coming days and the Federal Reserve’s next policy decision next week
The Dow Jones Industrial Average rose 484.18 points to 40,829.59, the S&P 500 gain 1.16% to 5,471.05 and the Nasdaq Composite ascend 193.77 points to 16,884.60.
MSCI’s index of Asia-Pacific stocks outside Japan is down 1.06% to 680.84 levels. The Australian index was higher by 0.30% to 8,011.90. Japanese Nikkei Index increase 0.06% today.
European stocks were mixed on Tuesday, with the Stoxx Europe 50 Index increase 0.42% to 4,798.75 Germany’s DAX ascend 0.23% to 18,474.05, and France’s CAC higher 0.58% to 7,468.26 and U.K.’s FTSE 100 loss 0.35% to 8,242.26.
Benchmark 10-year U.S. Treasury rose as demand for safe assets slipped again, today 10-year bond yields 0.71% to 3.7240.
Oil was steady in early trade on Tuesday as investors weighed supply disruptions from Tropical Storm Francine and the potential for further output cuts against persistently weak Chinese demand.
Spot Brent crude oil decrease 0.33% to $71.60 per barrel. US West Texas Intermediate crude is decrease 0.39% to $68.44 a barrel.
The yellow metal gold is down 0.09% to 2,530.35 dollars per ounce.
Market Wrap: Forex
The dollar was trading steady against the yen and other major currencies on Tuesday.
Today, the U.S. dollar index measures the Greenback against a trade-weighted basket of six major currencies, which increase 0.10% to 101.622.
The Euro US Dollar (EUR/USD) is a widely traded is up 0.05% today. This left the pair trading around $1.10390.
The Japanese yen was will move positive against the U.S. dollar on Tuesday. Today USD/JPY is trades pair that increase 0.28% to the 143.570 level.
Another commodity-related currency mixed against the U.S dollar, AUD/USD loss 0.01% to 0.66600, and NZD/USD increase 0.14% to 0.61510 level.
EUR/USD Intraday: Major trend on the upside
Our pivot point is at 1.10430
Preferable Price Action: Take buy positions above pivot level with targets at 1.10590 & 1.10730 in extension.
Alternative Price Action: Sell pivot looks for a further downside to 1.10270 & 1.10130.
Comment: RSI is above 50 levels and Pairs above its 20MA.
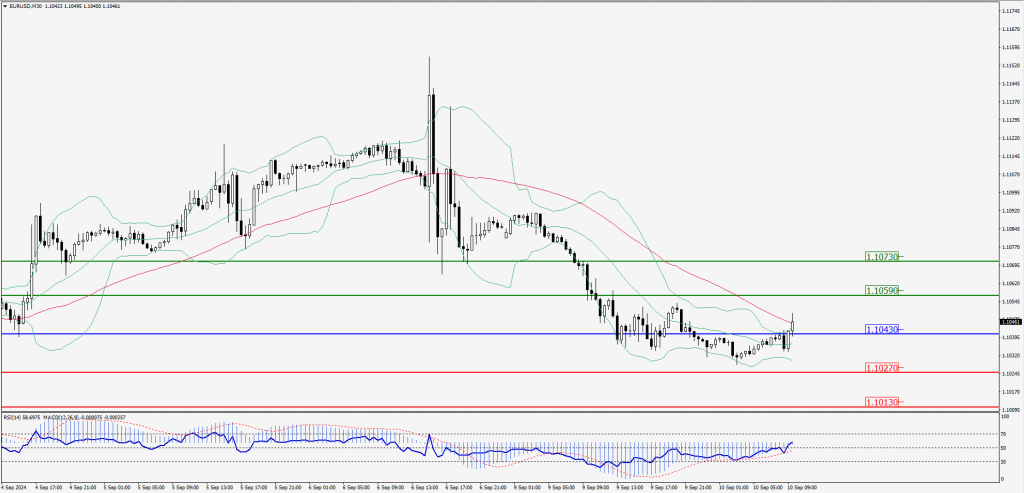
Green Lines Indicate Resistance Levels – Red Lines Indicate Support Levels
Light Blue is a Pivot Point – Black represents the price when the report was produced
GBP/USD Intraday: Trend on the upside
Our pivot point is at 1.30960
Preferable Price Action: Buy positions above pivot with targets at 1.31210 & 1.31420 in extension.
Alternative Price Action: The price below pivot would call for further downside to 1.30740 & 1.30530.
Comment: RSI is above 50 levels and Pairs above its 55MA & 20MA.
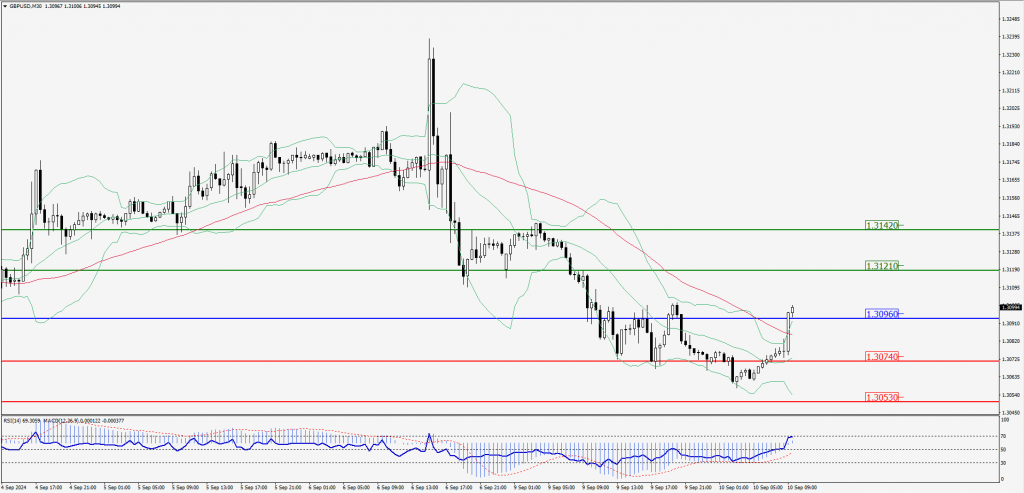
Green Lines Indicate Resistance Levels – Red Lines Indicate Support Levels
Light Blue is a Pivot Point – Black represents the price when the report was produced
USD/JPY Intraday: Trend on the upside
Our pivot point is at 143.310
Preferable Price Action: Buy position above pivot with the target at 143.760 and 143.140 in extension.
Alternative Price Action: The downside breakout of the pivot would call for 142.860 and 142.420.
Comment: MACD is above 50 levels and Pairs above its 55MA & 20MA.
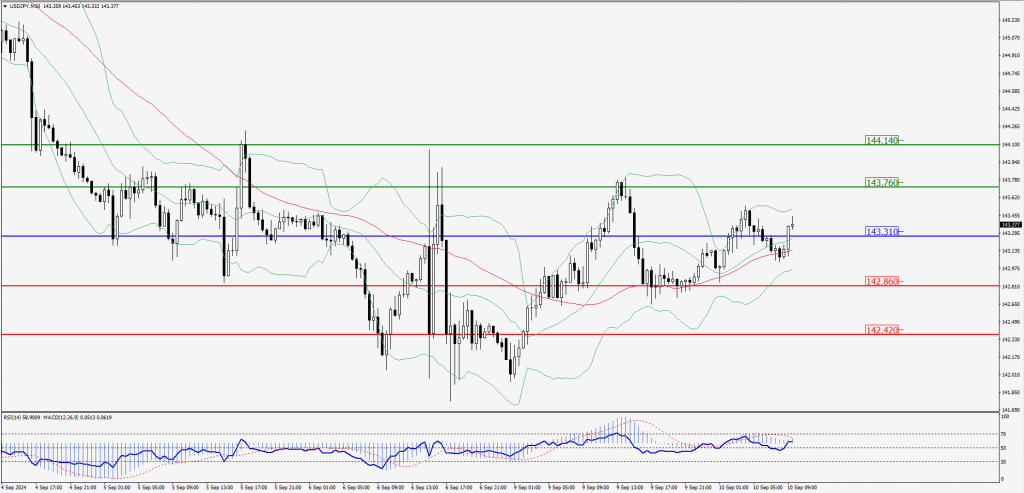
Green Lines Indicate Resistance Levels – Red Lines Indicate Support Levels
Light Blue is a Pivot Point – Black represents the price when the report was produced
AUD/USD Intraday: Trend on the upside
Our pivot point is at 0.66680
Preferable Price Action: Buy positions above pivot with targets at 0.66830 & 0.66970 in extension.
Alternative Price Action: Below pivot a further downside with 0.66530 & 0.66390 as targets.
Comment: RSI is above 50 levels and pairs above its 20MA & 55MA.
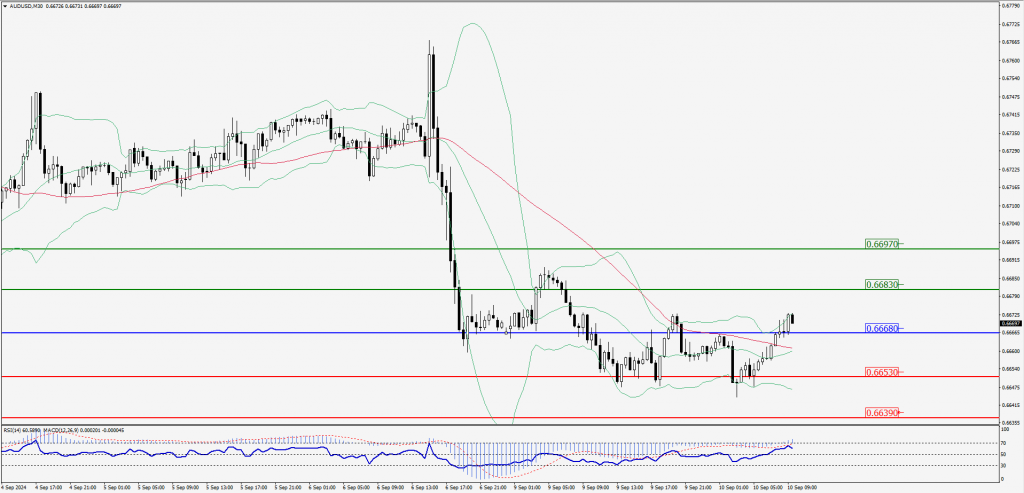
Green Lines Indicate Resistance Levels – Red Lines Indicate Support Levels
Light Blue is a Pivot Point – Black represents the price when the report was produced
CRUDEOIL Intraday: Trend on the downside
Our pivot point is at 67.92
Preferable Price Action: Below pivot sell oil with 67.37 & 66.84 as targets.
Alternative Price Action: Buy crude above pivot with targets at 68.49 and 69.05 in extension.
Comment: RSI is at below 50 levels and pairs below its 55MA & 20MA.
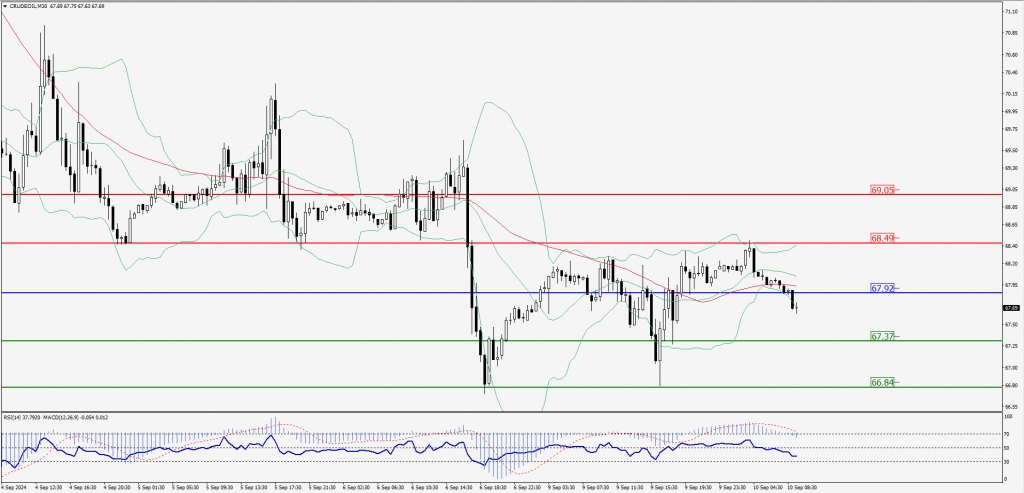
Green Lines Indicate Resistance Levels – Red Lines Indicate Support Levels
Light Blue is a Pivot Point – Black represents the price when the report was produced
XAU/USD Intraday: Trend on the upside
Our pivot point is at 2501.70
Preferable Price Action: Further upside to 2508.40 and 2515.60.
Alternative Price Action: If the price gives an downside breakout of a pivot, then the price extends to 2495.00 and 2488.40.
Comment: MACD is above 50 levels and pairs above its 55MA.
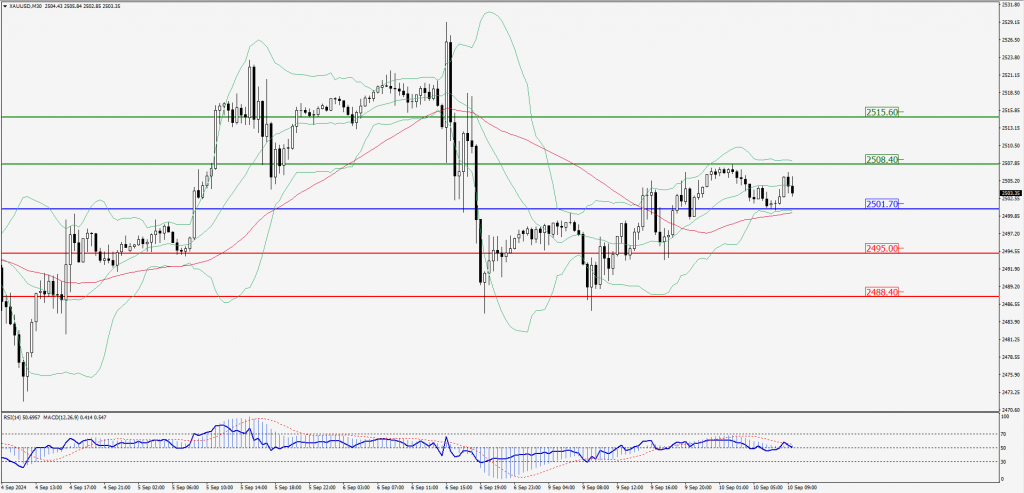
Green Lines Indicate Resistance Levels – Red Lines Indicate Support Levels
Light Blue is a Pivot Point – Black represents the price when the report was produced
Dow Jones Intraday: Trend on the upside
Our pivot point is 40,757.10
Preferable Price Action: Take buy positions above the pivot with targets at 40,878.20 & 40,987.00.
Alternative Price Action: Below 40,757.10 looks for further downside to 40,638.70 & 40,531.30.
Comment: RSI is above 50 levels and pairs above its 50MA.
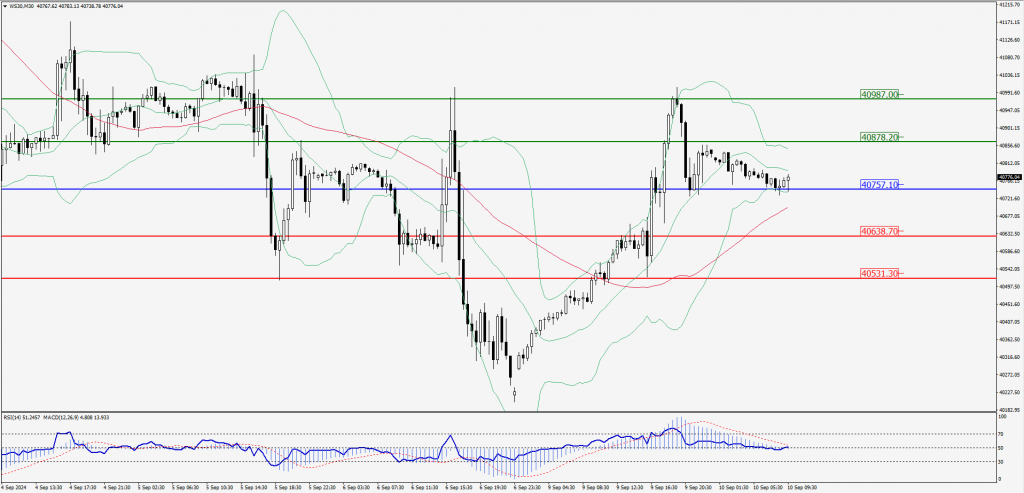
Green Lines Indicate Resistance Levels – Red Lines Indicate Support Levels
Light Blue is a Pivot Point – Black represents the price when the report was produced