Market Wrap: Stocks, Bonds, Commodities
US stocks fell on Friday, weighed down by a jobs report that showed a continued labor market slowdown but left traders uncertain about how far the Federal Reserve will go in cutting interest rates.
The Dow Jones Industrial Average fail 410.34 points to 40,345.41, the S&P 500 loss 1.73% to 5,408.42 and the Nasdaq Composite descend 436.83 points to 16,690.83.
MSCI’s index of Asia-Pacific stocks outside Japan is up 0.59% to 689.27 levels. The Australian index was lower by 0.32% to 7,988.10. Japanese Nikkei Index decrease 0.72% today.
European stocks were mixed on Monday, with the Stoxx Europe 50 Index increase 0.72% to 4,774.35 Germany’s DAX ascend 0.71% to 18,409.95, and France’s CAC higher 0.58% to 7,395.31 and U.K.’s FTSE 100 loss 0.52% to 8,224.26.
Benchmark 10-year U.S. Treasury rose as demand for safe assets slipped again, today 10-year bond yields 1.07% to 3.7450.
Oil prices edged up in early trading on Monday and recovered some of the previous session losses after US jobs data was weaker than expected in August.
Spot Brent crude oil increase 1.22% to $71.93 per barrel. US West Texas Intermediate crude is increase 1.30% to $68.55 a barrel.
The yellow metal gold is down 0.65% to 2,523.95 dollars per ounce.
Market Wrap: Forex
The dollar held to tight ranges on Monday while the yen pared some of its safe-haven gains, as investors were undecided on the scale of a Federal Reserve rate cut expected later this month and looked to this week’s U.S. inflation reading for more clues.
Today, the U.S. dollar index measures the Greenback against a trade-weighted basket of six major currencies, which increase 0.29% to 101.432.
The Euro US Dollar (EUR/USD) is a widely traded is down 0.21% today. This left the pair trading around $1.10590.
The Japanese yen was will move positive against the U.S. dollar on Monday. Today USD/JPY is trades pair that increase 0.62% to the 143.140 level.
Another commodity-related currency negative against the U.S dollar, AUD/USD loss 0.01% to 0.66700, and NZD/USD decrease 0.36% to 0.61520 level.
EUR/USD Intraday: Major trend on the downside
Our pivot point is at 1.10680
Preferable Price Action: Take sell positions below pivot level with targets at 1.10500 & 1.10330 in extension.
Alternative Price Action: Buy pivot looks for a further upside to 1.10860 & 1.11030.
Comment: RSI is below 50 levels and Pairs below its 20MA & 55MA.
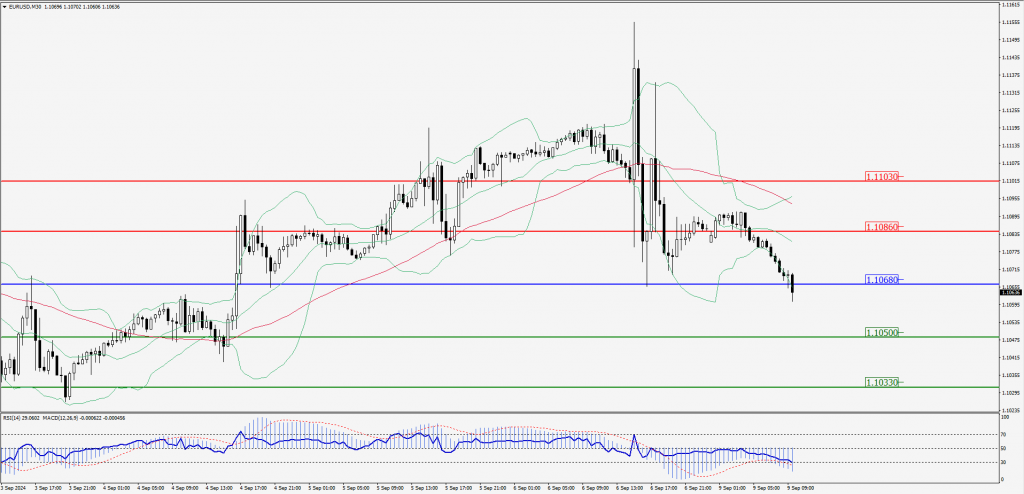
Green Lines Indicate Resistance Levels – Red Lines Indicate Support Levels
Light Blue is a Pivot Point – Black represents the price when the report was produced
GBP/USD Intraday: Trend on the downside
Our pivot point is at 1.31160
Preferable Price Action: Sell positions below pivot with targets at 1.30970 & 1.30800 in extension.
Alternative Price Action: The price above pivot would call for further upside to 1.31370 & 1.31560.
Comment: RSI is below 50 levels and Pairs below its 55MA & 20MA.
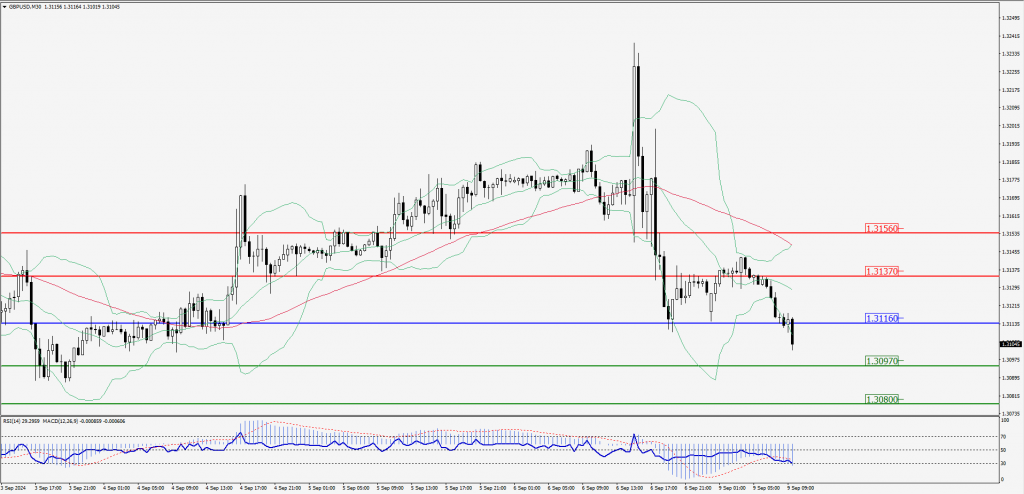
Green Lines Indicate Resistance Levels – Red Lines Indicate Support Levels
Light Blue is a Pivot Point – Black represents the price when the report was produced
USD/JPY Intraday: Trend on the upside
Our pivot point is at 142.800
Preferable Price Action: Buy position above pivot with the target at 143.360 and 143.870 in extension.
Alternative Price Action: The downside breakout of the pivot would call for 142.270 and 141.780.
Comment: MACD is above 50 levels and Pairs above its 55MA & 20MA.
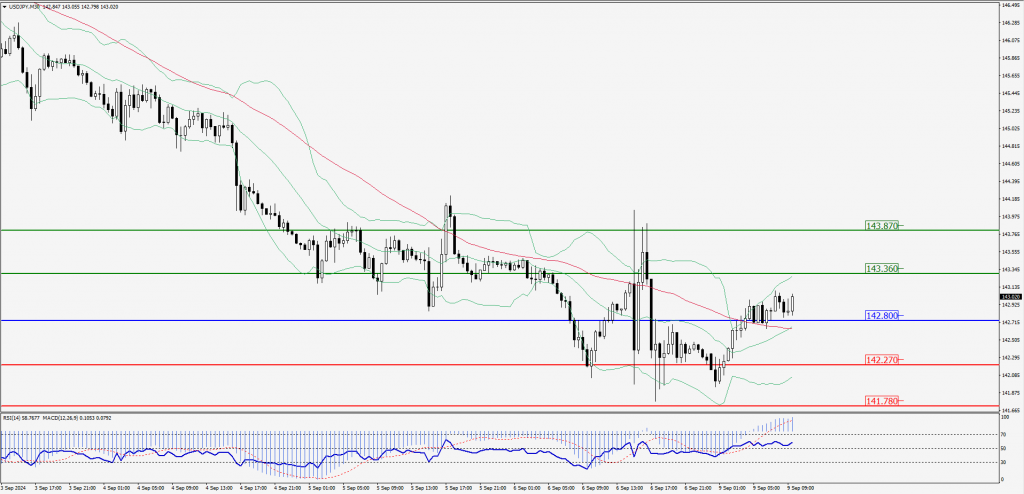
Green Lines Indicate Resistance Levels – Red Lines Indicate Support Levels
Light Blue is a Pivot Point – Black represents the price when the report was produced
AUD/USD Intraday: Trend on the downside
Our pivot point is at 0.66740
Preferable Price Action: Sell positions below pivot with targets at 0.66560 & 0.66420 in extension.
Alternative Price Action: Above pivot a further upside with 0.66930 & 0.67070 as targets.
Comment: RSI is below 50 levels and pairs below its 20MA & 55MA.
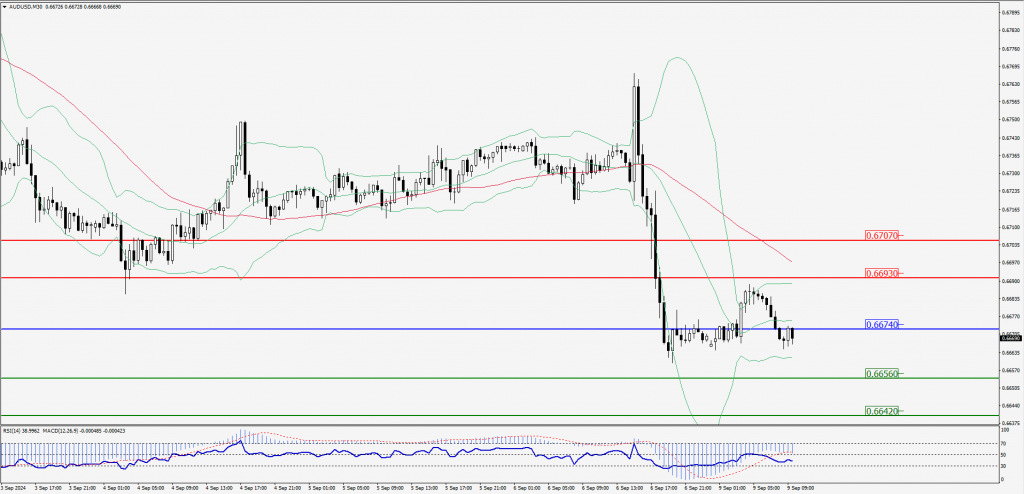
Green Lines Indicate Resistance Levels – Red Lines Indicate Support Levels
Light Blue is a Pivot Point – Black represents the price when the report was produced
CRUDEOIL Intraday: Trend on the downside
Our pivot point is at 68.24
Preferable Price Action: Below pivot sell oil with 67.42 & 66.71 as targets.
Alternative Price Action: Buy crude above pivot with targets at 68.98 and 69.71 in extension.
Comment: RSI is at below 50 levels and pairs below its 55MA.
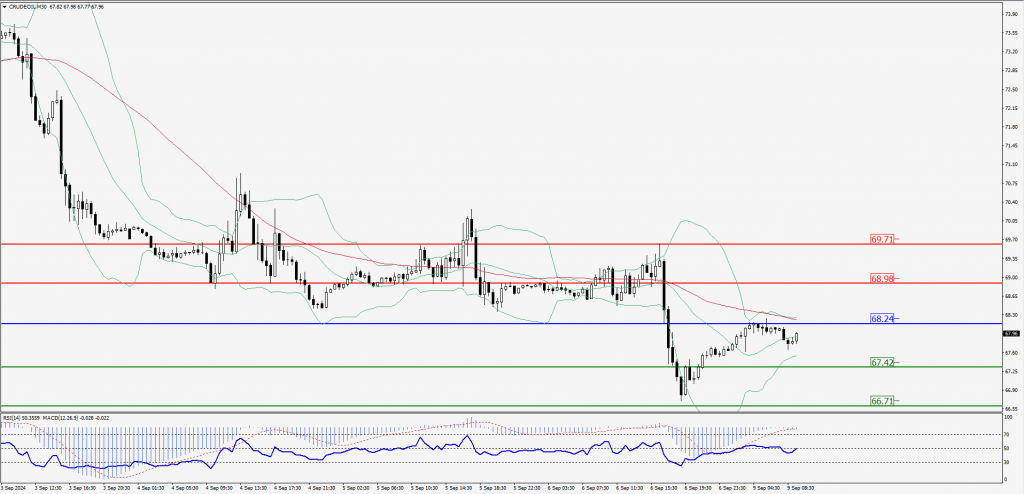
Green Lines Indicate Resistance Levels – Red Lines Indicate Support Levels
Light Blue is a Pivot Point – Black represents the price when the report was produced
XAU/USD Intraday: Trend on the downside
Our pivot point is at 2493.30
Preferable Price Action: Further downside to 2484.60 and 2476.40.
Alternative Price Action: If the price gives an upside breakout of a pivot, then the price extends to 2501.60 and 2509.50.
Comment: MACD is below 50 levels and pairs below its 55MA & 20MA.
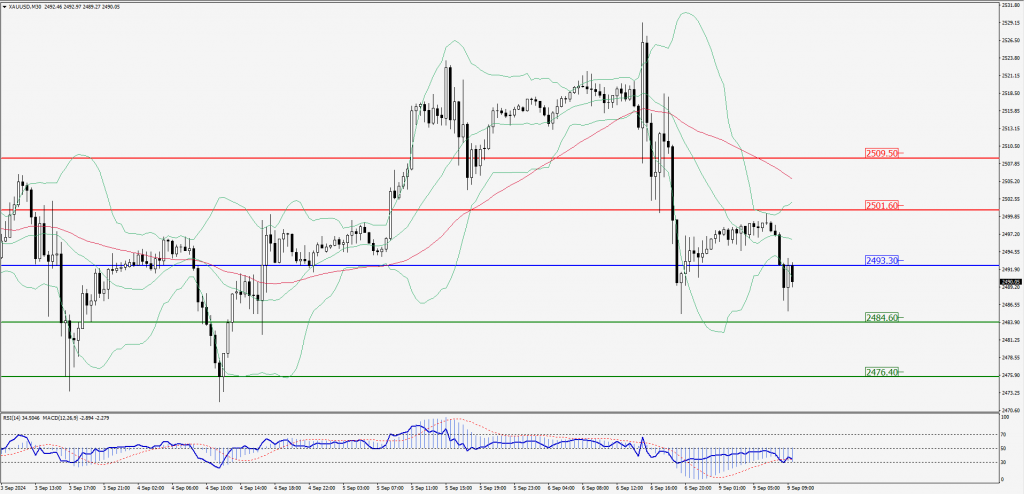
Green Lines Indicate Resistance Levels – Red Lines Indicate Support Levels
Light Blue is a Pivot Point – Black represents the price when the report was produced
Dow Jones Intraday: Trend on the upside
Our pivot point is 40,462.60
Preferable Price Action: Take buy positions above the pivot with targets at 40,647.80 & 40,824.60.
Alternative Price Action: Below 40,462.60 looks for further downside to 40,277.30 & 40,111.20.
Comment: RSI is above 50 levels and pairs above its 20MA.
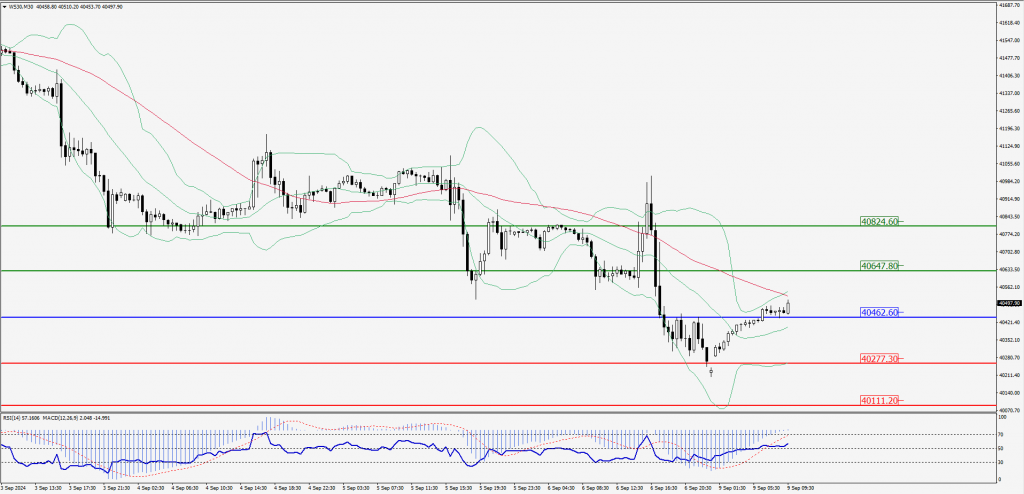
Green Lines Indicate Resistance Levels – Red Lines Indicate Support Levels
Light Blue is a Pivot Point – Black represents the price when the report was produced