Market Wrap: Stocks, Bonds, Commodities
The safe-haven Japanese yen rallied on Wednesday while riskier currencies like the Australian dollar and sterling languished as traders ducked for cover following the worst sell-off in almost a month on Wall Street and big losses for Asian stocks.
The Dow Jones Industrial Average fail 626.15 points to 41,563.08, the S&P 500 loss 2.12% to 5,528.93 and the Nasdaq Composite descend 577.32 points to 17,136.30.
MSCI’s index of Asia-Pacific stocks outside Japan is down 2.43% to 684.50 levels. The Australian index was lower by 1.88% to 7,950.50. Japanese Nikkei Index decrease 4.35% today.
European stocks were negative on Wednesday, with the Stoxx Europe 50 Index decrease 1.17% to 4,855.25 Germany’s DAX descend 0.89% to 18,589.85, and France’s CAC lower 0.86% to 7,509.98 and U.K.’s FTSE 100 loss 0.87% to 8,226.29.
Benchmark 10-year U.S. Treasury fail as demand for safe assets slipped again, today 10-year bond yields 0.71% to 3.903.
Oil prices fell on Wednesday, extending a plunge of more than 4% the previous day and hovering at their lowest since December, on expectations that a political dispute halting Libyan exports could be resolved and concerns over sluggish global demand.
Spot Brent crude oil decrease 0.61% to $73.28 per barrel. US West Texas Intermediate crude is decrease 0.73% to $69.83 a barrel.
The yellow metal gold is down 0.57 % to 2,508.50 dollars per ounce.
Market Wrap: Forex
The U.S. dollar reached a two-week peak compared to the euro, with investors preparing for a week filled with crucial data, including the U.S. payrolls report due on Wednesday.
Today, the U.S. dollar index measures the Greenback against a trade-weighted basket of six major currencies, which decrease 0.17% to 101.592.
The Euro US Dollar (EUR/USD) is a widely traded is up 0.11% today. This left the pair trading around $1.10560.
The Japanese yen was will move negative against the U.S. dollar on Wednesday. Today USD/JPY is trades pair that decrease 0.24% to the 145.120 level.
Another commodity-related currency Positive against the U.S dollar, AUD/USD gain 0.01% to 0.67090, and NZD/USD increase 0.02% to 0.61840 level.
EUR/USD Intraday: Trend on the upside
Our pivot point is at 1.10520
Preferable Price Action: Take buy positions above pivot level with targets at 1.10620 & 1.10710 in extension.
Alternative Price Action: Sell pivot looks for a further downside to 1.10430 & 1.10340.
Comment: RSI is above 50 levels and Pairs above its 20MA & 55MA.
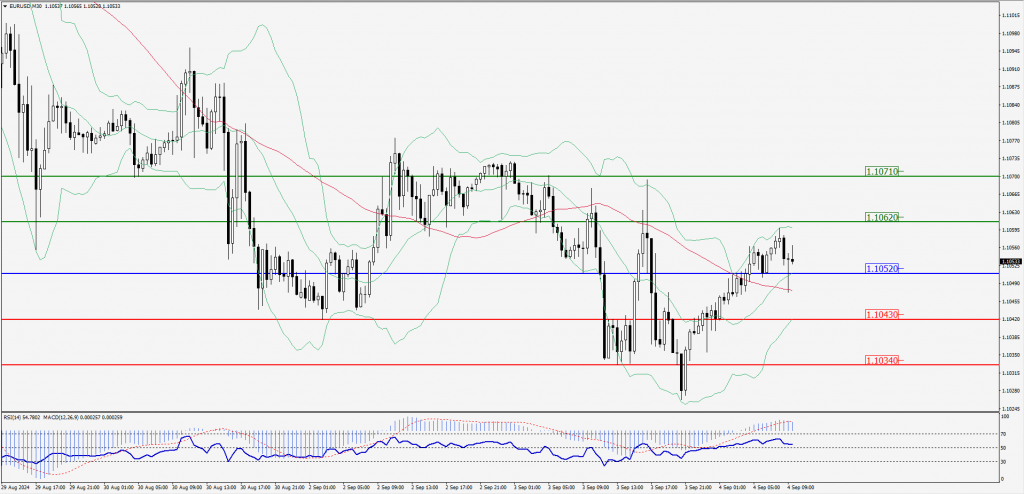
Green Lines Indicate Resistance Levels – Red Lines Indicate Support Levels
Light Blue is a Pivot Point – Black represents the price when the report was produced
GBP/USD Intraday: Trend on the upside
Our pivot point is at 1.31090
Preferable Price Action: Buy positions above pivot with targets at 1.31250 & 1.31390 in extension.
Alternative Price Action: The price below pivot would call for further downside to 1.30940 & 1.30810.
Comment: RSI is above 50 levels.
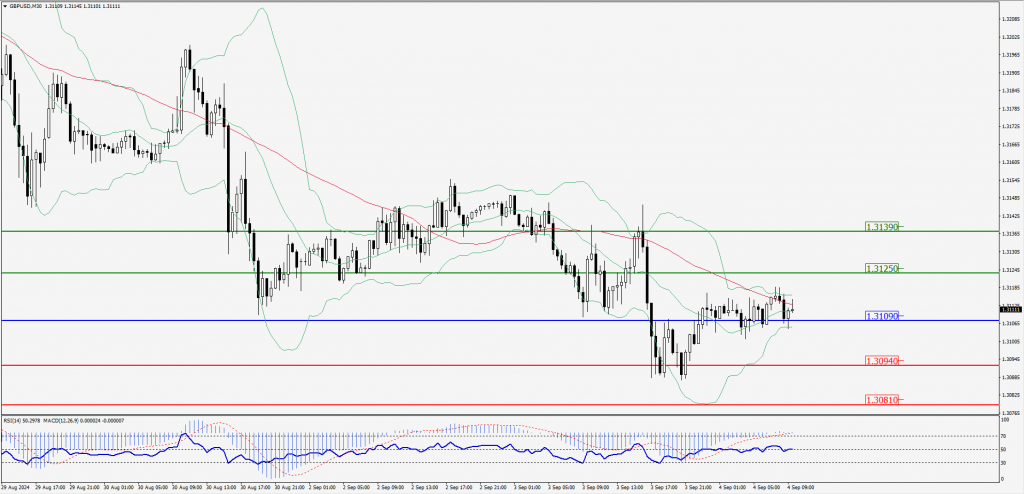
Green Lines Indicate Resistance Levels – Red Lines Indicate Support Levels
Light Blue is a Pivot Point – Black represents the price when the report was produced
USD/JPY Intraday: Trend on the downside
Our pivot point is at 145.150
Preferable Price Action: Sell position below pivot with the target at 144.770 and 144.470 in extension.
Alternative Price Action: The upside breakout of the pivot would call for 145.520 and 145.850.
Comment: MACD is below 50 levels and Pairs below its 55MA & 20MA.
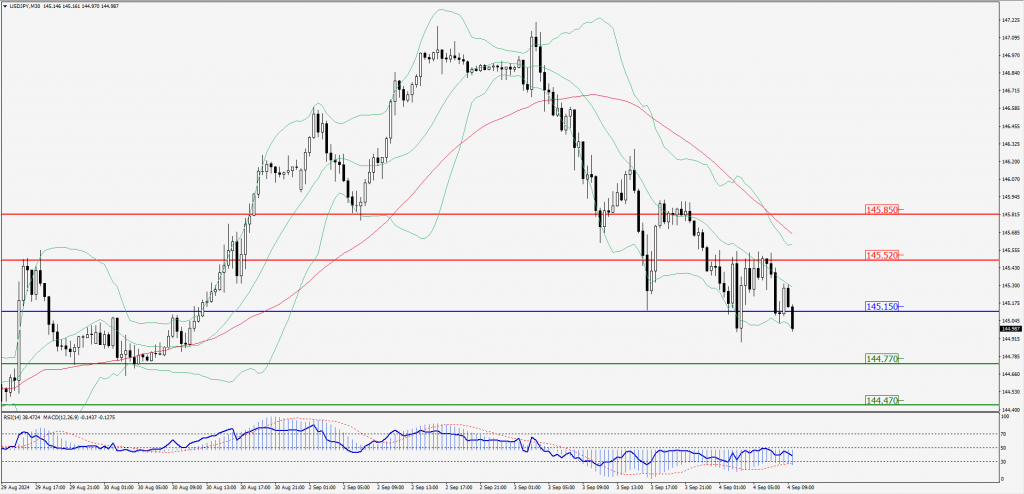
Green Lines Indicate Resistance Levels – Red Lines Indicate Support Levels
Light Blue is a Pivot Point – Black represents the price when the report was produced
AUD/USD Intraday: Trend on the upside
Our pivot point is at 0.67070
Preferable Price Action: Buy positions above pivot with targets at 0.67270 & 0.67440 in extension.
Alternative Price Action: Below pivot a further downside with 0.66860 & 0.66700 as targets.
Comment: RSI is above 50 levels and pairs above its 55MA.
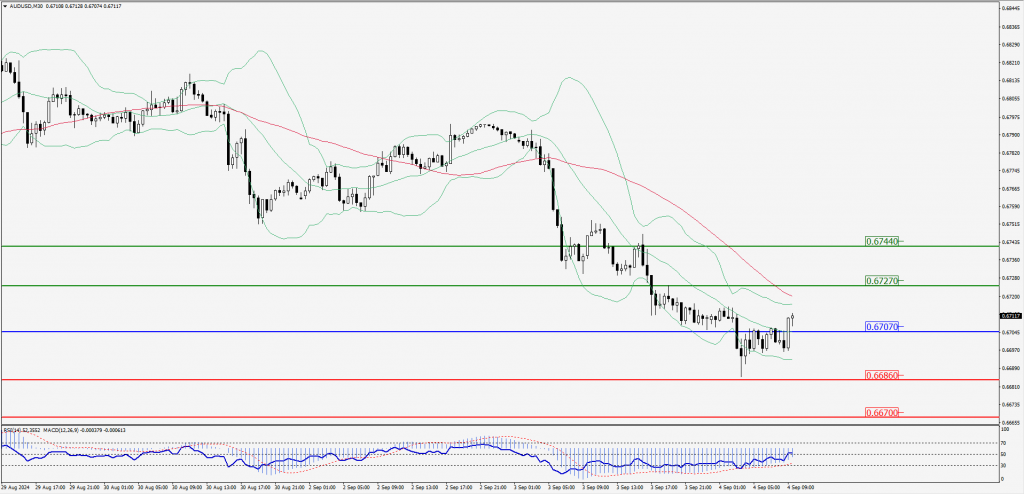
Green Lines Indicate Resistance Levels – Red Lines Indicate Support Levels
Light Blue is a Pivot Point – Black represents the price when the report was produced
CRUDEOIL Intraday: Major trend on the downside
Our pivot point is at 69.75
Preferable Price Action: Below pivot sell oil with 68.45 & 67.34 as targets.
Alternative Price Action: Buy crude above pivot with targets at 70.99 and 72.21 in extension.
Comment: RSI is at below 50 levels and pairs below its 55MA.
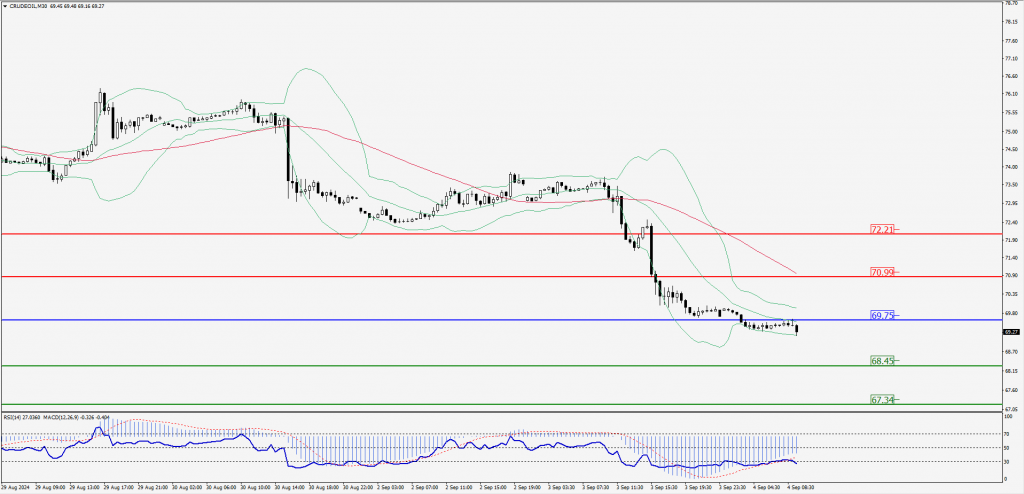
Green Lines Indicate Resistance Levels – Red Lines Indicate Support Levels
Light Blue is a Pivot Point – Black represents the price when the report was produced
XAU/USD Intraday: Trend on the upside
Our pivot point is at 2487.00
Preferable Price Action: Further upside to 2493.80 and 2499.90.
Alternative Price Action: If the price gives an downside breakout of a pivot, then the price extends to 2479.90 and 2473.60.
Comment: MACD is above 50 levels.
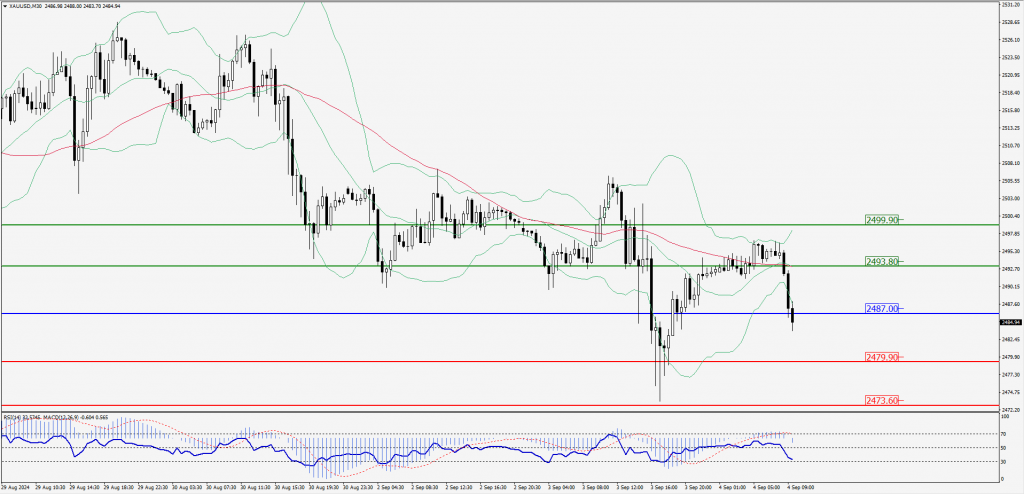
Green Lines Indicate Resistance Levels – Red Lines Indicate Support Levels
Light Blue is a Pivot Point – Black represents the price when the report was produced
Dow Jones Intraday: Trend on the downside
Our pivot point is 40,907.70
Preferable Price Action: Take sell positions below the pivot with targets at 40,751.20 & 40,629.50.
Alternative Price Action: Above 41,479.90 looks for further upside to 41,070.50 & 41,208.00.
Comment: RSI is below 50 levels and pairs below its 55MA.
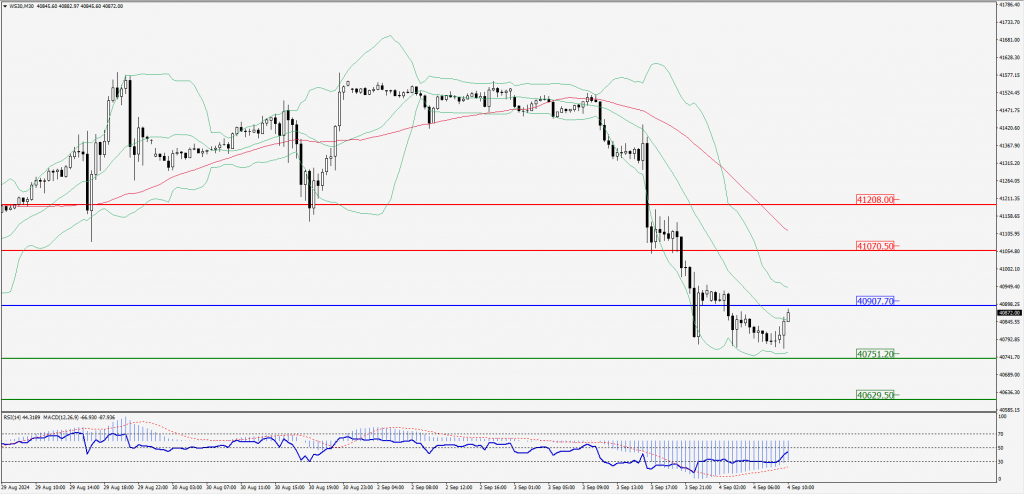
Green Lines Indicate Resistance Levels – Red Lines Indicate Support Levels
Light Blue is a Pivot Point – Black represents the price when the report was produced