Market Wrap: Stocks, Bonds, Commodities
The dollar edged down on Monday but remained within striking distance of its highest level in almost two weeks, as investors’ focus moved to a U.S. jobs report due at the end of this week.
The Dow Jones Industrial Average gain 228.03 points to 41,563.08, the S&P 500 rose 1.01% to 5,648.40 and the Nasdaq Composite ascend 197.19 points to 17,713.62.
MSCI’s index of Asia-Pacific stocks outside Japan is up 0.08% to 701.10 levels. The Australian index was higher by 0.22% to 8,109.90. Japanese Nikkei Index increase 0.14% today.
European stocks were mixed on Monday, with the Stoxx Europe 50 Index decrease 0.19% to 4,948.35 Germany’s DAX descend 0.20% to 18,870.75, and France’s CAC lower 0.27% to 7,610.24 and U.K.’s FTSE 100 loss 0.09% to 8,369.34.
Benchmark 10-year U.S. Treasury rose as demand for safe assets slipped again, today 10-year bond yields 0.75% to 3.938.
Oil prices extended losses on Monday on expectations for higher OPEC+ production starting in October and as signs of sluggish demand in China and the U.S., the world’s two largest oil consumers, raised concerns about future consumption growth.
Spot Brent crude oil either up or down 0.01% to $76.93 per barrel. US West Texas Intermediate crude is increase 0.05% to $73.59 a barrel.
The yellow metal gold is up 0.15 % to 2,531.40 dollars per ounce.
Market Wrap: Forex
As investors turn to the Swiss franc as an alternative to Japan’s yen to fund carry trades, the risk of the currency staging one of its rapid rallies remains ever present.
Today, the U.S. dollar index measures the Greenback against a trade-weighted basket of six major currencies, which decrease 0.10% to 101.600.
The Euro US Dollar (EUR/USD) is a widely traded is up 0.24% today. This left the pair trading around $1.10730.
The Japanese yen was will move positive against the U.S. dollar on Monday. Today USD/JPY is trades pair that increase 0.46% to the 146.840 level.
Another commodity-related currency mixed against the U.S dollar, AUD/USD gain 0.30% to 0.67840, and NZD/USD decrease 0.26% to 0.62330 level.
EUR/USD Intraday: Trend on the upside
Our pivot point is at 1.10550
Preferable Price Action: Take buy positions above pivot level with targets at 1.10840 & 1.11080 in extension.
Alternative Price Action: Sell pivot looks for a further downside to 1.10270 & 1.10040.
Comment: RSI is above 50 levels and Pairs above its 20MA.
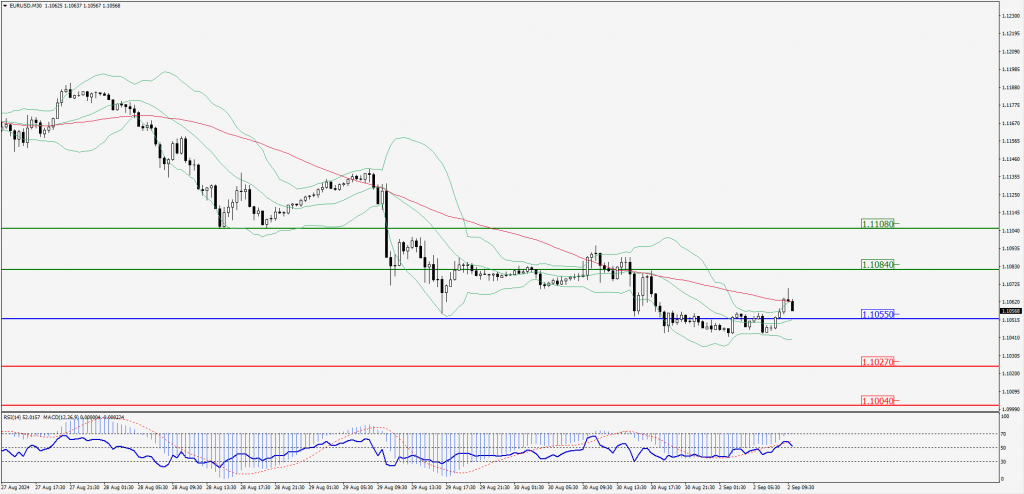
Green Lines Indicate Resistance Levels – Red Lines Indicate Support Levels
Light Blue is a Pivot Point – Black represents the price when the report was produced
GBP/USD Intraday: Trend on the upside
Our pivot point is at 1.31360
Preferable Price Action: Buy positions above pivot with targets at 1.31560 & 1.31750 in extension.
Alternative Price Action: The price below pivot would call for further downside to 1.31150 & 1.30950.
Comment: RSI is above 50 levels and Pairs above its 20MA.
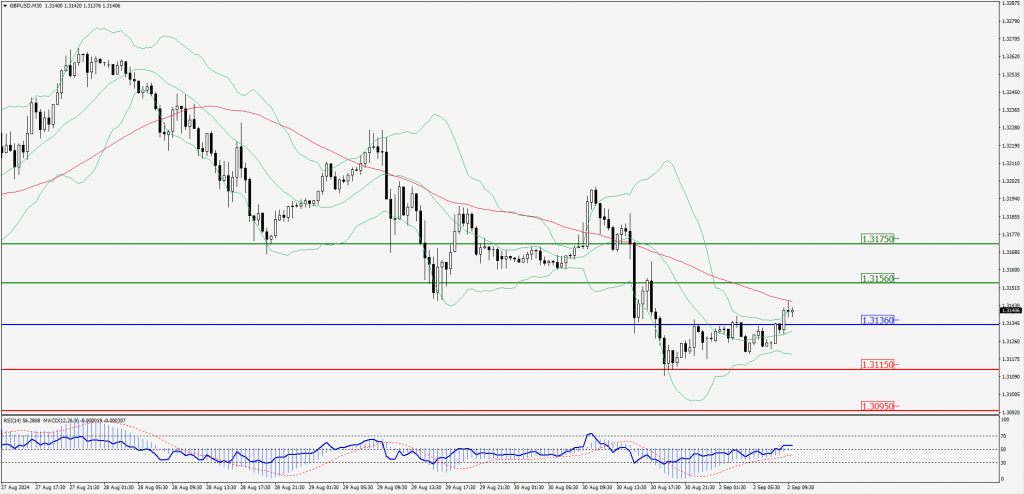
Green Lines Indicate Resistance Levels – Red Lines Indicate Support Levels
Light Blue is a Pivot Point – Black represents the price when the report was produced
USD/JPY Intraday: Trend on the upside
Our pivot point is at 146.160
Preferable Price Action: Buy position above pivot with the target at 146.640 and 147.080 in extension.
Alternative Price Action: The downside breakout of the pivot would call for 145.700 and 145.250.
Comment: MACD is above 50 levels and Pairs above its 55MA.
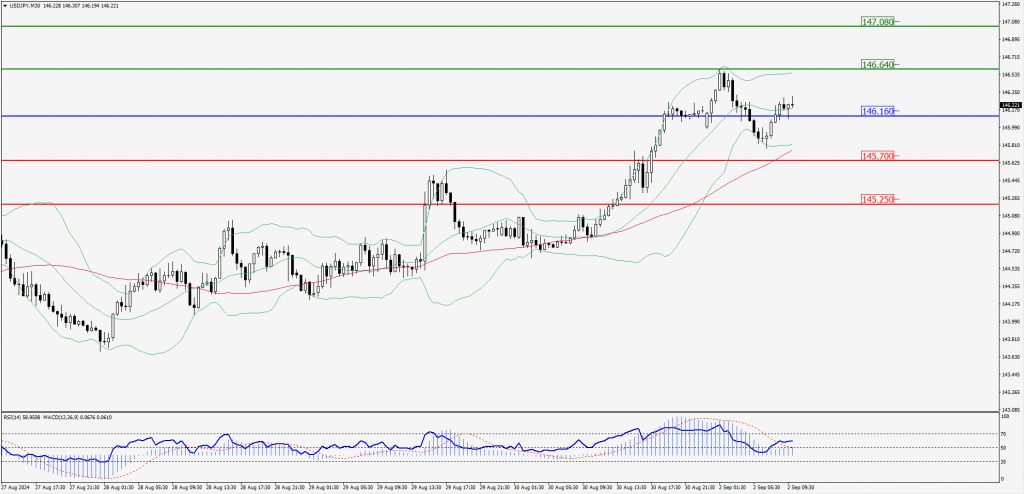
Green Lines Indicate Resistance Levels – Red Lines Indicate Support Levels
Light Blue is a Pivot Point – Black represents the price when the report was produced
AUD/USD Intraday: Trend on the upside
Our pivot point is at 0.67750
Preferable Price Action: Buy positions above pivot with targets at 0.67840 & 0.67920 in extension.
Alternative Price Action: Below pivot a further downside with 0.67660 & 0.67580 as targets.
Comment: RSI is above 50 levels and pairs above its 20MA.
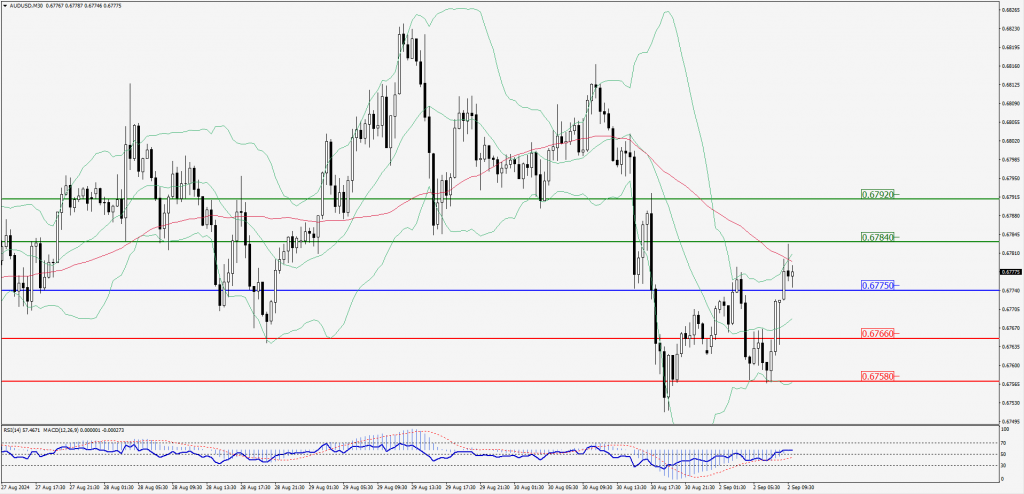
Green Lines Indicate Resistance Levels – Red Lines Indicate Support Levels
Light Blue is a Pivot Point – Black represents the price when the report was produced
CRUDEOIL Intraday: Trend on the downside
Our pivot point is at 73.05
Preferable Price Action: Below pivot sell oil with 72.28 & 71.65 as targets.
Alternative Price Action: Buy crude above pivot with targets at 73.79 and 74.44 in extension.
Comment: RSI is at below 50 levels and pairs below its 55MA.
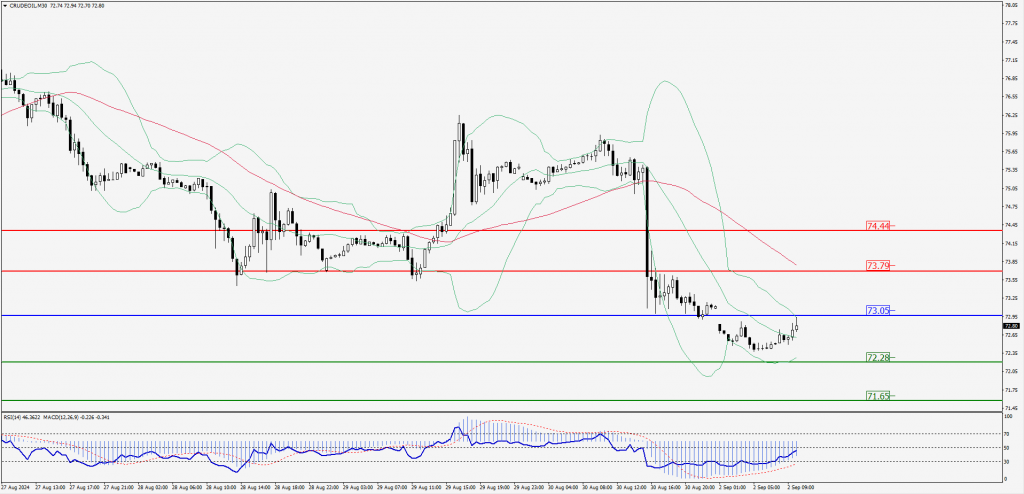
Green Lines Indicate Resistance Levels – Red Lines Indicate Support Levels
Light Blue is a Pivot Point – Black represents the price when the report was produced
XAU/USD Intraday: Trend on the downside
Our pivot point is at 2500.70
Preferable Price Action: Further downside to 2493.80 and 2487.90.
Alternative Price Action: If the price gives an upside breakout of a pivot, then the price extends to 2507.60 and 2513.70.
Comment: MACD is below 50 levels and pairs below its 55MA.
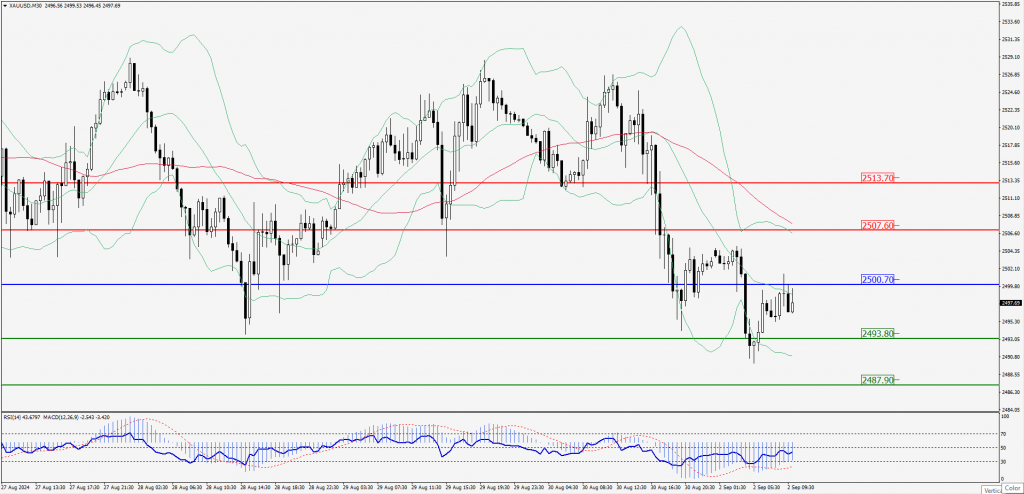
Green Lines Indicate Resistance Levels – Red Lines Indicate Support Levels
Light Blue is a Pivot Point – Black represents the price when the report was produced
Dow Jones Intraday: Trend on the downside
Our pivot point is 41,473.60
Preferable Price Action: Take sell positions below the pivot with targets at 41,370.80 & 41,275.30.
Alternative Price Action: Above 41,387.50 looks for further upside to 41,575.20 & 41,658.60.
Comment: RSI is below 50 levels and pairs below its 20MA.
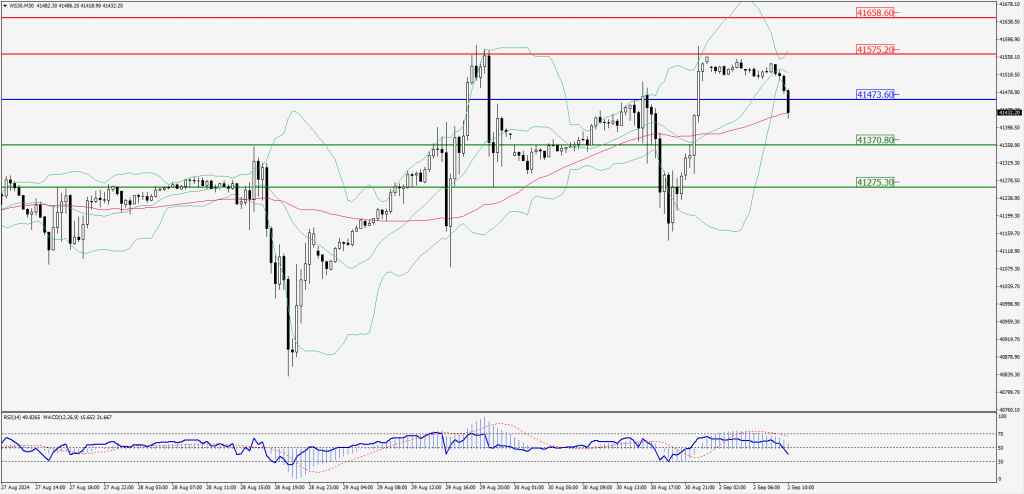
Green Lines Indicate Resistance Levels – Red Lines Indicate Support Levels
Light Blue is a Pivot Point – Black represents the price when the report was produced