Market Wrap: Stocks, Bonds, Commodities
The dollar wobbled near a seven-month low on Tuesday on bets the U.S. central bank will start cutting interest rates from next month, with traders bracing for comments from Federal Reserve Chair Jerome Powell on Friday.
The Dow Jones Industrial Average rose 236.77 points to 40,896.53, the S&P 500 gain 0.97% to 5,608.25 and the Nasdaq Composite ascend 54.00 points to 17,876.77.
MSCI’s index of Asia-Pacific stocks outside Japan is up 1.26% to 705.93 levels. The Australian index was higher by 0.22% to 7,997.70. Japanese Nikkei Index increase 1.98% today.
European stocks were mixed on Tuesday, with the Stoxx Europe 50 Index increase 0.28% to 4,885.55, Germany’s DAX ascend 0.09% to 18,444.85, and France’s CAC higher 0.19% to 7,516.35 and U.K.’s FTSE 100 loss 0.59% to 8,308.03.
Benchmark 10-year U.S. Treasury rose as demand for safe assets slipped again, today 10-year bond yields eighter or 0.00% to 3.8710.
Oil prices edged lower on Tuesday as Israel accepting a proposal to tackle disagreements blocking a ceasefire deal in Gaza eased supply concerns and China’s economic weakness weighed on the demand outlook.
Spot Brent crude oil decrease 0.95% to $76.92 per barrel. US West Texas Intermediate crude is decrease 0.72% to $72.94 a barrel.
The yellow metal gold is up 0.65% to 2,557.70 dollars per ounce.
Market Wrap: Forex
The U.S. dollar edged lower Friday, handing back some of the previous session’s hefty gains after the release of solid retail sales downplayed concerns about an Imminent U.S. recession.
Today, the U.S. dollar index measures the Greenback against a trade-weighted basket of six major currencies, which decrease 0.06% to 101.830.
The Euro US Dollar (EUR/USD) is a widely traded pair that is increase 0.03% today. This left the pair trading around $1.10880.
The Japanese yen was will move negative against the U.S. dollar on Tuesday. Today USD/JPY is trades pair that decrease 0.16% to the 146.330 level.
Another commodity-related currency positive against the U.S dollar, AUD/USD gain 0.04% to 0.67310, and NZD/USD increase 0.37% to 0.61360 level.
EUR/USD Intraday: Major trend on the upside
Our pivot point is at 1.10690
Preferable Price Action: Take buy positions above pivot level with targets at 1.11080 & 1.11360 in extension.
Alternative Price Action: Sell pivot looks for a further downside to 1.0300 & 1.09960.
Comment: RSI is above 50 levels and Pairs above its 55MA.
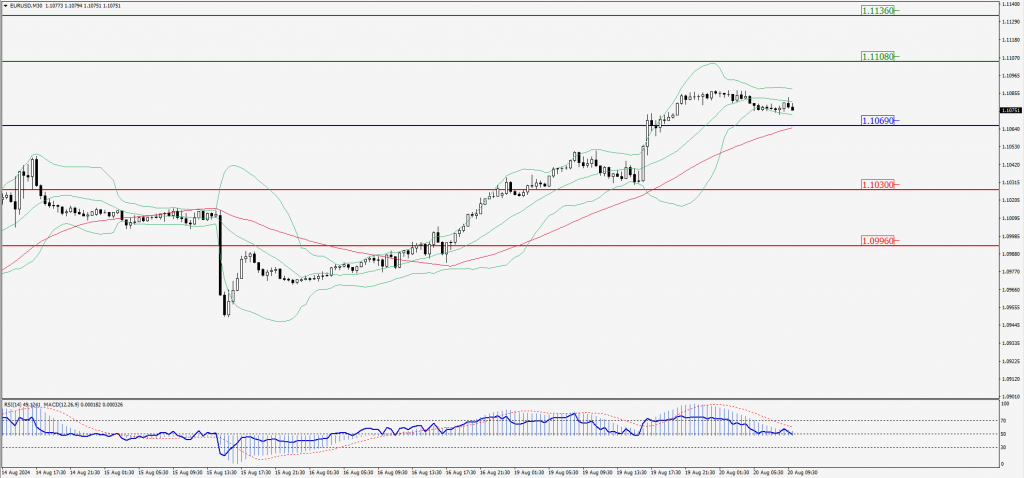
Green Lines Indicate Resistance Levels – Red Lines Indicate Support Levels
Light Blue is a Pivot Point – Black represents the price when the report was produced
GBP/USD Intraday: Trend on the upside
Our pivot point is at 1.29740
Preferable Price Action: Buy positions above pivot with targets at 1.30190 & 1.30590 in extension.
Alternative Price Action: The price below pivot would call for further downside to 1.29290 & 1.28870.
Comment: RSI is above 50 levels and Pairs above its 20MA & 55MA.
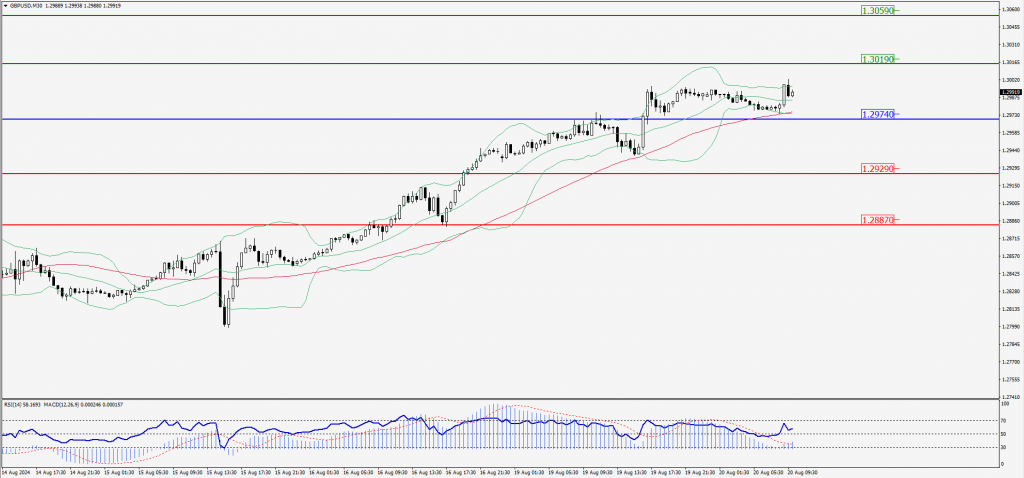
Green Lines Indicate Resistance Levels – Red Lines Indicate Support Levels
Light Blue is a Pivot Point – Black represents the price when the report was produced
USD/JPY Intraday: Trend on the upside
Our pivot point is at 146.760
Preferable Price Action: Sell position below pivot with the target at 147.450 and 148.120 in extension.
Alternative Price Action: The upside breakout of the pivot would call for 146.040 and 145.350.
Comment: MACD is below 50 levels and Pairs below its 20MA and 55MA.
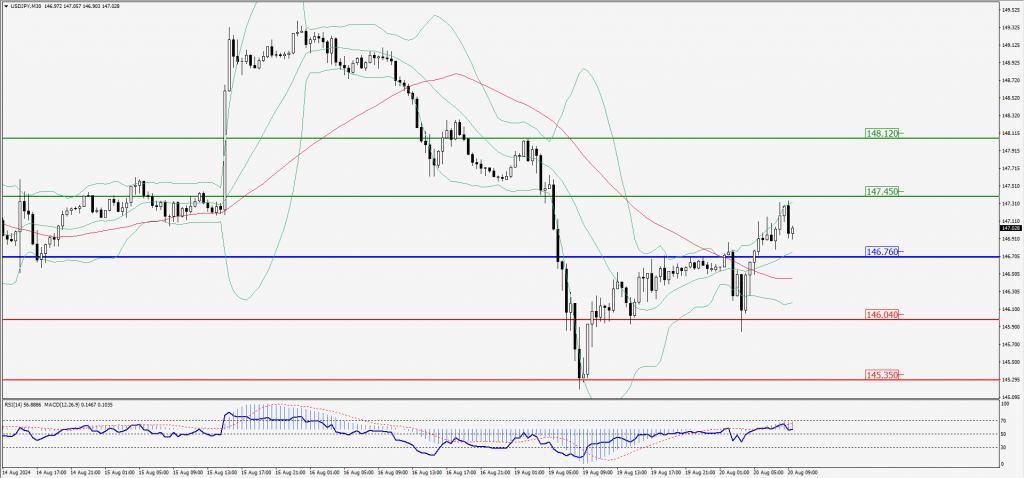
Green Lines Indicate Resistance Levels – Red Lines Indicate Support Levels
Light Blue is a Pivot Point – Black represents the price when the report was produced
AUD/USD Intraday: Trend on the upside
Our pivot point is at 0.67160
Preferable Price Action: Buy positions above pivot with targets at 0.67640 & 0.68060 in extension.
Alternative Price Action: Below pivot a further downside with 0.66680 & 0.66220 as targets.
Comment: RSI is above 50 levels and pairs above its 20MA.
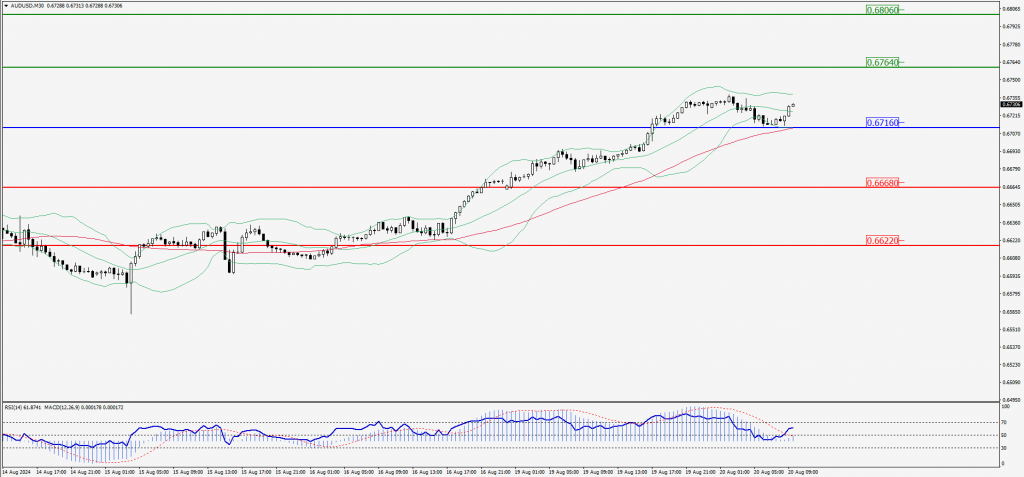
Green Lines Indicate Resistance Levels – Red Lines Indicate Support Levels
Light Blue is a Pivot Point – Black represents the price when the report was produced
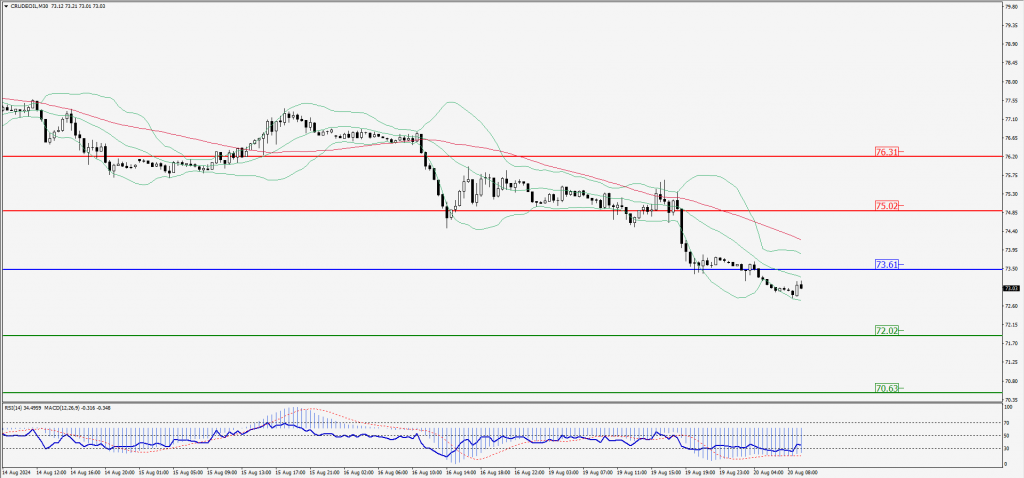
CRUDEOIL Intraday: Trend on the downside
Our pivot point is at 73.61
Preferable Price Action: Below pivot sell oil with 72.02 & 70.63 as targets.
Alternative Price Action: Buy crude above pivot with targets at 75.02 and 76.31 in extension.
Comment: RSI is below 50 levels and pairs below its 20MA and 55MA.
Green Lines Indicate Resistance Levels – Red Lines Indicate Support Levels
Light Blue is a Pivot Point – Black represents the price when the report was produced
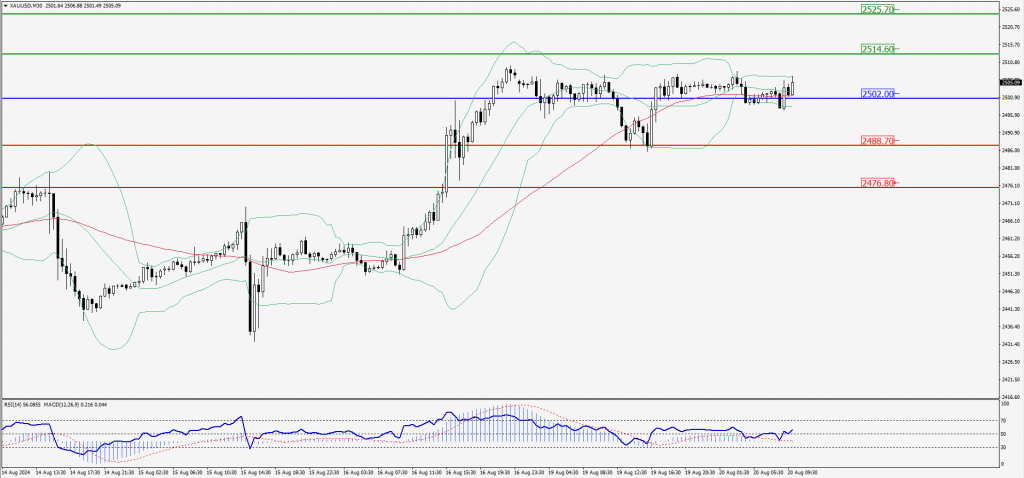
XAU/USD Intraday: Trend on the upside
Our pivot point is at 2502.00
Preferable Price Action: Further upside to 2514.60 and 2525.70.
Alternative Price Action: If the price gives an downside breakout of a pivot, then the price extends to 2488.70 and 2476.80.
Comment: MACD is above 50 levels and pairs above its 20MA.
Green Lines Indicate Resistance Levels – Red Lines Indicate Support Levels
Light Blue is a Pivot Point – Black represents the price when the report was produced
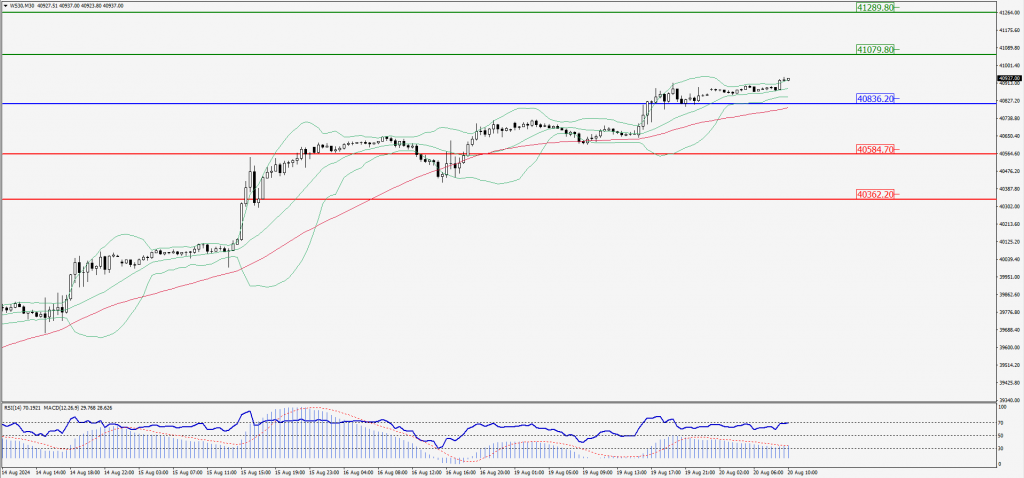
Dow Jones Intraday: Trend on the upside
Our pivot point is 40,836.20
Preferable Price Action: Take buy positions above the pivot with targets at 40,079.80 & 41,289.80.
Alternative Price Action: Below 40,836.20 looks for further downside to 40,584.70 & 40,362.20.
Comment: RSI is above 50 levels and pairs above its 55MA.
Green Lines Indicate Resistance Levels – Red Lines Indicate Support Levels
Light Blue is a Pivot Point – Black represents the price when the report was produced