Market Wrap: Stocks, Bonds, Commodities
Most Asian currencies firmed on Thursday with the Australian dollar logging strong gains after Reserve Bank Governor Michele Bullock said the bank will not hesitate to hike interest rates further to quell inflation.
The Dow Jones Industrial Average fail 234.21 points to 38,763.45, the S&P 500 loss 0.77% to 5,199.50 and the Nasdaq Composite descend 171.05 points to 16,195.81.
MSCI’s index of Asia-Pacific stocks outside Japan is down 0.26% to 668.77 levels. The Australian index was lower by 0.23% to 7,682.00. Japanese Nikkei Index decrease 0.84% today.
European stocks were negative on Thursday, with the Stoxx Europe 50 Index decrease 1.00% to 4,621.25, Germany’s DAX descend 0.74% to 17,480.05, and France’s CAC lower 0.90% to 7,200.87 and U.K.’s FTSE 100 loss 1.01% to 8,084.70.
Benchmark 10-year U.S. Treasury rose as demand for safe assets slipped again, today 10-year bond yields decrease 1.39% to 3.9110.
Oil prices rose in Asian trade on Thursday as a sustained drop in U.S. inventories spurred some optimism over sustained demand in the world’s biggest fuel consumer.
Spot Brent crude oil decrease 0.24% to $78.14 per barrel. US West Texas Intermediate crude is decrease 0.09% to $75.16 a barrel.
The yellow metal gold is up 0.11% to 2,435.05 dollars per ounce.
Market Wrap: Forex
The yen was choppy on Thursday after a sharp drop in the previous session in a volatile week that has left sentiment fragile as investors weigh the unwinding of popular carry trades and ponder the rate path Japan’s central bank is likely to take.
Today, the U.S. dollar index measures the Greenback against a trade-weighted basket of six major currencies, which decrease 0.21% to 102.785.
The Euro US Dollar (EUR/USD) is a widely traded pair that is increase 0.16% today. This left the pair trading around $1.0939.
The Japanese yen was will move negative against the U.S. dollar on Thursday. Today USD/JPY is trades pair that decrease 0.46% to the 146.010 level.
Another commodity-related currency positive against the U.S dollar, AUD/USD gain 0.61% to 0.65570, and NZD/USD increase 0.12% to 0.60010 level.
EUR/USD Intraday: Trend on the upside
Our pivot point is at 1.09340
Preferable Price Action: Take buy positions above pivot level with targets at 1.09640 & 1.09860 in extension.
Alternative Price Action: Sell pivot looks for a further downside to 1.09060 & 1.08830.
Comment: RSI is above 50 levels and Pairs above its 55MA & 20MA.
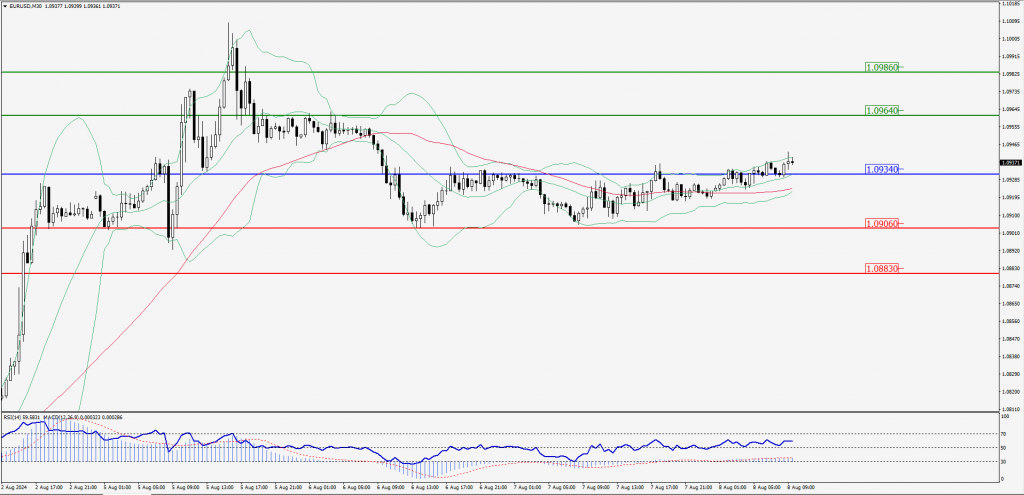
Green Lines Indicate Resistance Levels – Red Lines Indicate Support Levels
Light Blue is a Pivot Point – Black represents the price when the report was produced
GBP/USD Intraday: Trend on the upside
Our pivot point is at 1.26990
Preferable Price Action: Buy positions above pivot with targets at 1.27190 & 1.27390 in extension.
Alternative Price Action: The price below pivot would call for further downside to 1.26790 & 1.26620.
Comment: RSI is above 50 levels and Pairs above its 20MA.
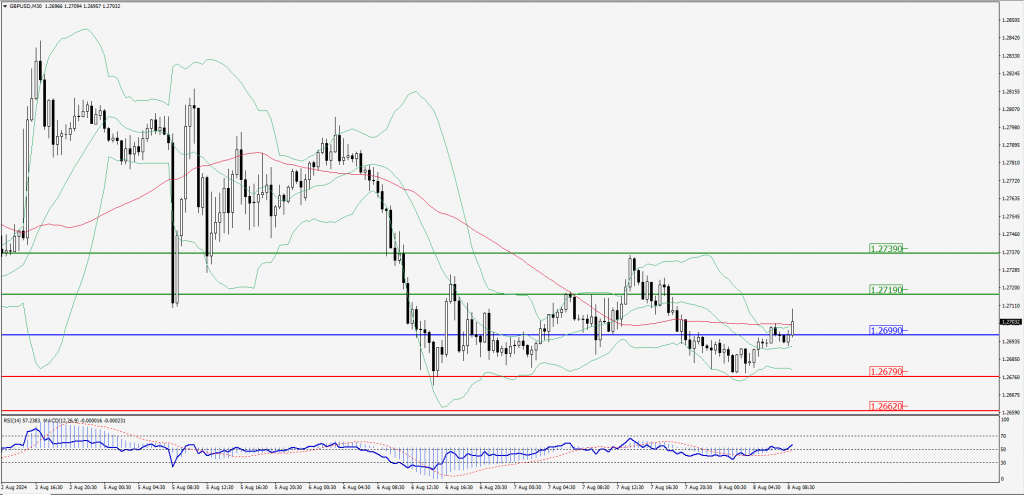
Green Lines Indicate Resistance Levels – Red Lines Indicate Support Levels
Light Blue is a Pivot Point – Black represents the price when the report was produced
USD/JPY Intraday: Trend on the downside
Our pivot point is at 146.510
Preferable Price Action: Sell position below pivot with the target at 145.420 and 144.410 in extension.
Alternative Price Action: The upside breakout of the pivot would call for 147.560 and 148.560.
Comment: MACD is below 50 levels and Pairs below its 20MA & 55MA.
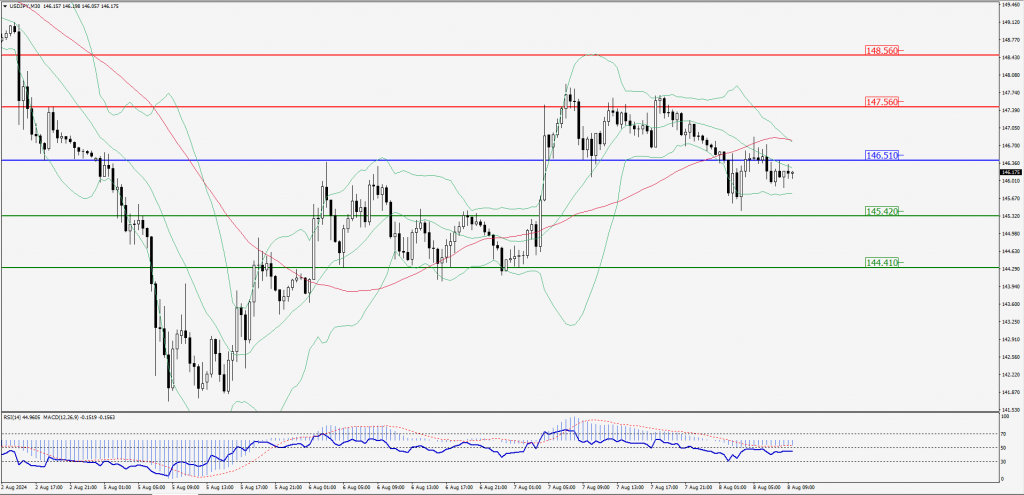
Green Lines Indicate Resistance Levels – Red Lines Indicate Support Levels
Light Blue is a Pivot Point – Black represents the price when the report was produced
AUD/USD Intraday: Trend on the upside
Our pivot point is at 0.65530
Preferable Price Action: Buy positions above pivot with targets at 0.65820 & 0.66090 in extension.
Alternative Price Action: Below pivot a further downside with 0.65240 & 0.64970 as targets.
Comment: RSI is above 50 levels and Pairs above its 55MA & 20MA.
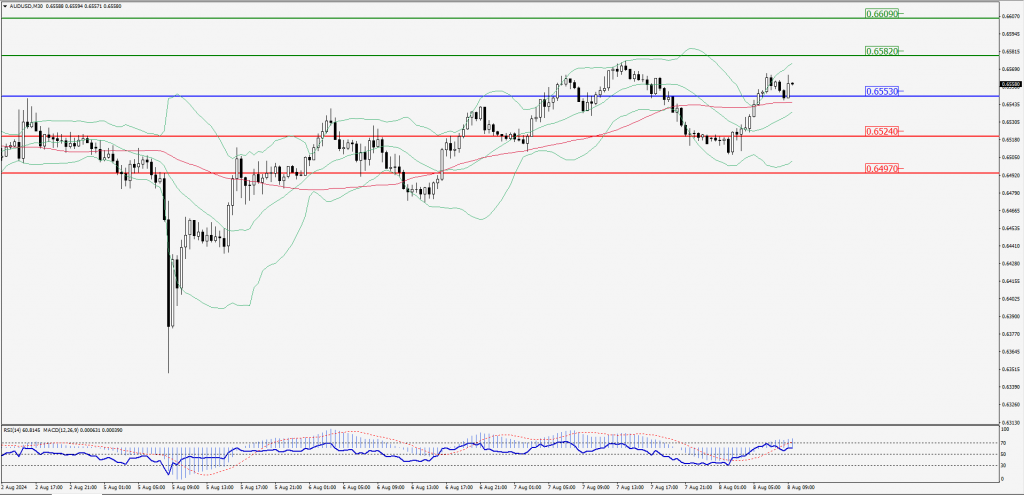
Green Lines Indicate Resistance Levels – Red Lines Indicate Support Levels
Light Blue is a Pivot Point – Black represents the price when the report was produced
CRUDEOIL Intraday: Trend on the downside
Our pivot point is at 74.45
Preferable Price Action: Below pivot sell oil with 73.74 & 73.09 as targets.
Alternative Price Action: Buy crude above pivot with targets at 75.21 and 75.85 in extension.
Comment: RSI is below 50 levels and pairs below its 20MA.
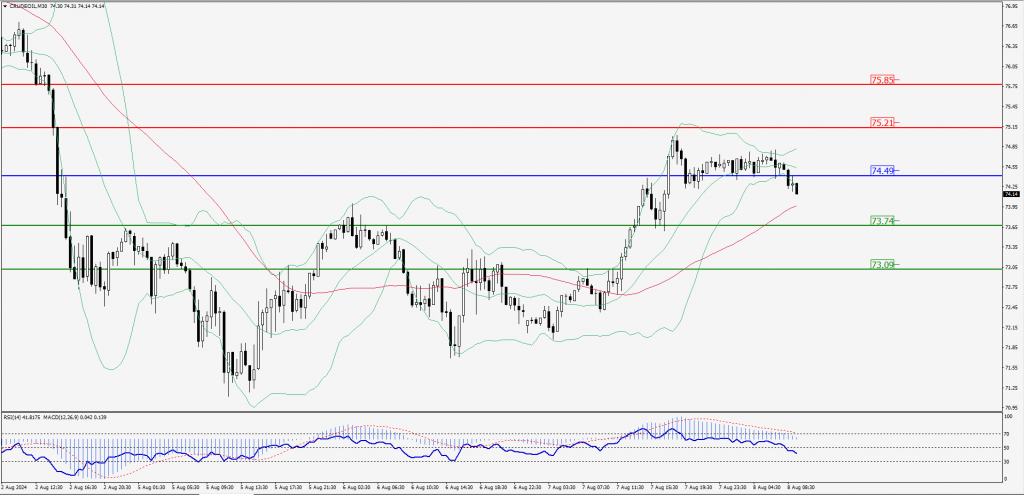
Green Lines Indicate Resistance Levels – Red Lines Indicate Support Levels
Light Blue is a Pivot Point – Black represents the price when the report was produced
XAU/USD Intraday: Trend on the upside
Our pivot point is at 2394.90
Preferable Price Action: Further upside to 2410.10 and 2424.70.
Alternative Price Action: If the price gives an downside breakout of a pivot, then the price extends to 2380.30 and 2367.20.
Comment: MACD is above 50 levels and pairs above its 20MA & 55MA.
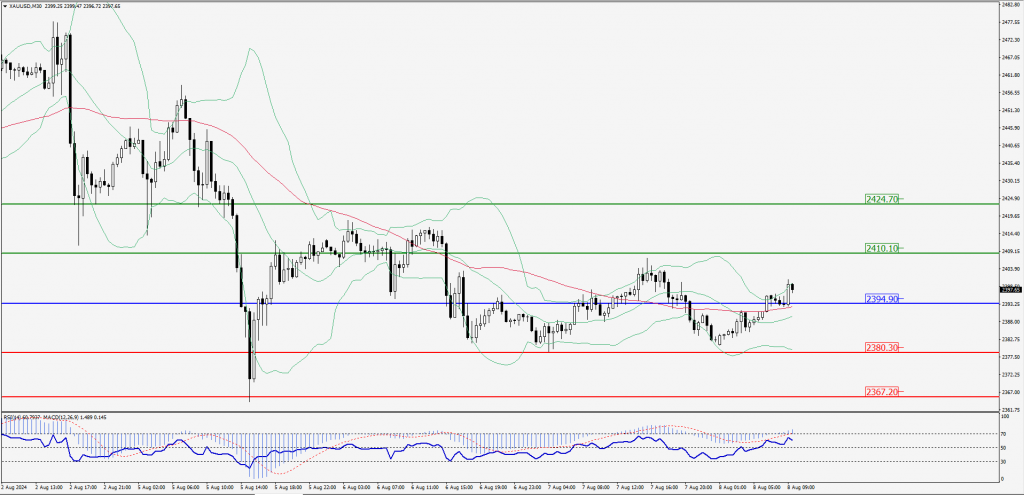
Green Lines Indicate Resistance Levels – Red Lines Indicate Support Levels
Light Blue is a Pivot Point – Black represents the price when the report was produced
Dow Jones Intraday: Trend on the downside
Our pivot point is 38,892.60
Preferable Price Action: Take sell positions below the pivot with targets at 38,663.90 & 38,452.50.
Alternative Price Action: Above 38,892.60 looks for further upside to 39,116.40 & 39,313.10.
Comment: RSI is below 50 levels and pairs below its 55MA.
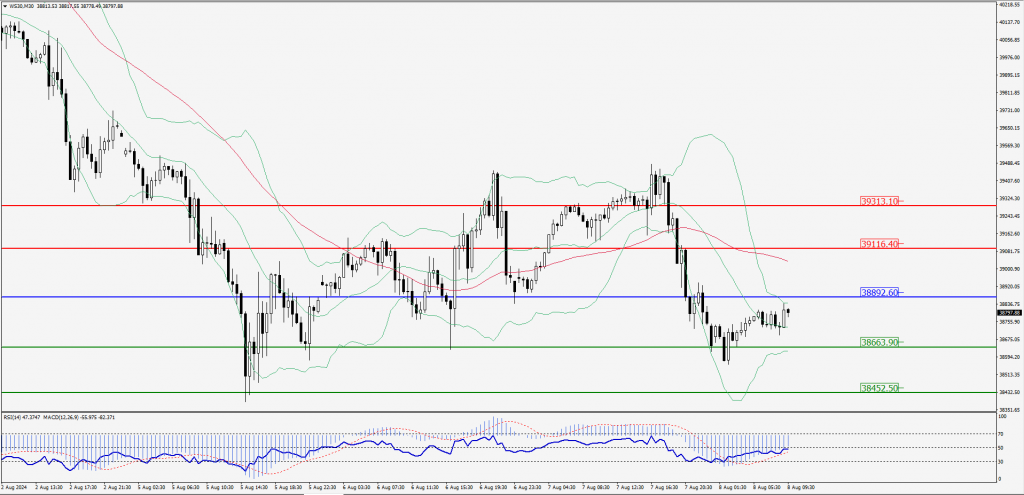
Green Lines Indicate Resistance Levels – Red Lines Indicate Support Levels
Light Blue is a Pivot Point – Black represents the price when the report was produced