Market Wrap: Stocks, Bonds, Commodities
Most Asian currencies drifted lower on Wednesday as the dollar regained more ground from recent declines, while the yen fell sharply after Bank of Japan officials downplayed expectations of interest rate hikes.
The Dow Jones Industrial Average fail 294.39 points to 38,997.66, the S&P 500 surged 1.04% to 5,240.03 and the Nasdaq Composite ascend 166.77 points to 16,366.86.
MSCI’s index of Asia-Pacific stocks outside Japan is up 1.86% to 669.52 levels. The Australian index was higher by 0.25% to 7,699.80. Japanese Nikkei Index increase 2.51% today.
European stocks were positive on Wednesday, with the Stoxx Europe 50 Index increase 0.77% to 4,610.30, Germany’s DAX ascend 0.8% to 17,462.55, and France’s CAC higher 0.81% to 7,188.07 and U.K.’s FTSE 100 gain 0.93% to 8,098.78.
Benchmark 10-year U.S. Treasury rose as demand for safe assets slipped again, today 10-year bond yields increase 0.93% to 3.9200.
Oil prices recovered in Asian trading on Wednesday on heightened Middle East tensions, but gains were capped by weak demand.
Spot Brent crude oil increase 0.25% to $76.67 per barrel. US West Texas Intermediate crude is increase 0.29% to $73.41 a barrel.
The yellow metal gold is down 0.11% to 2,429.00 dollars per ounce.
Market Wrap: Forex
The yen slumped on Wednesday after an influential Bank of Japan official played down the chances of a near-term rate hike in a fresh twist to the week that started with massive moves driven by U.S. recession fears and unwinding of popular carry trades.
Today, the U.S. dollar index measures the Greenback against a trade-weighted basket of six major currencies, which increase 0.14% to 102.902.
The Euro US Dollar (EUR/USD) is a widely traded pair that is decrease 0.05% today. This left the pair trading around $1.0924.
The Japanese yen was will move positive against the U.S. dollar on Wednesday. Today USD/JPY is trades pair that increase 1.50% to the 146.470 level.
Another commodity-related currency positive against the U.S dollar, AUD/USD gain 0.41% to 0.65450, and NZD/USD increase 0.97% to 0.60100 level.
EUR/USD Intraday: Trend on the downside
Our pivot point is at 1.09220
Preferable Price Action: Take sell positions below pivot level with targets at 1.08910 & 1.08630 in extension.
Alternative Price Action: Buy pivot looks for a further upside to 1.09540 & 1.09810.
Comment: RSI is below 50 levels and Pairs below its 55MA & 20MA.
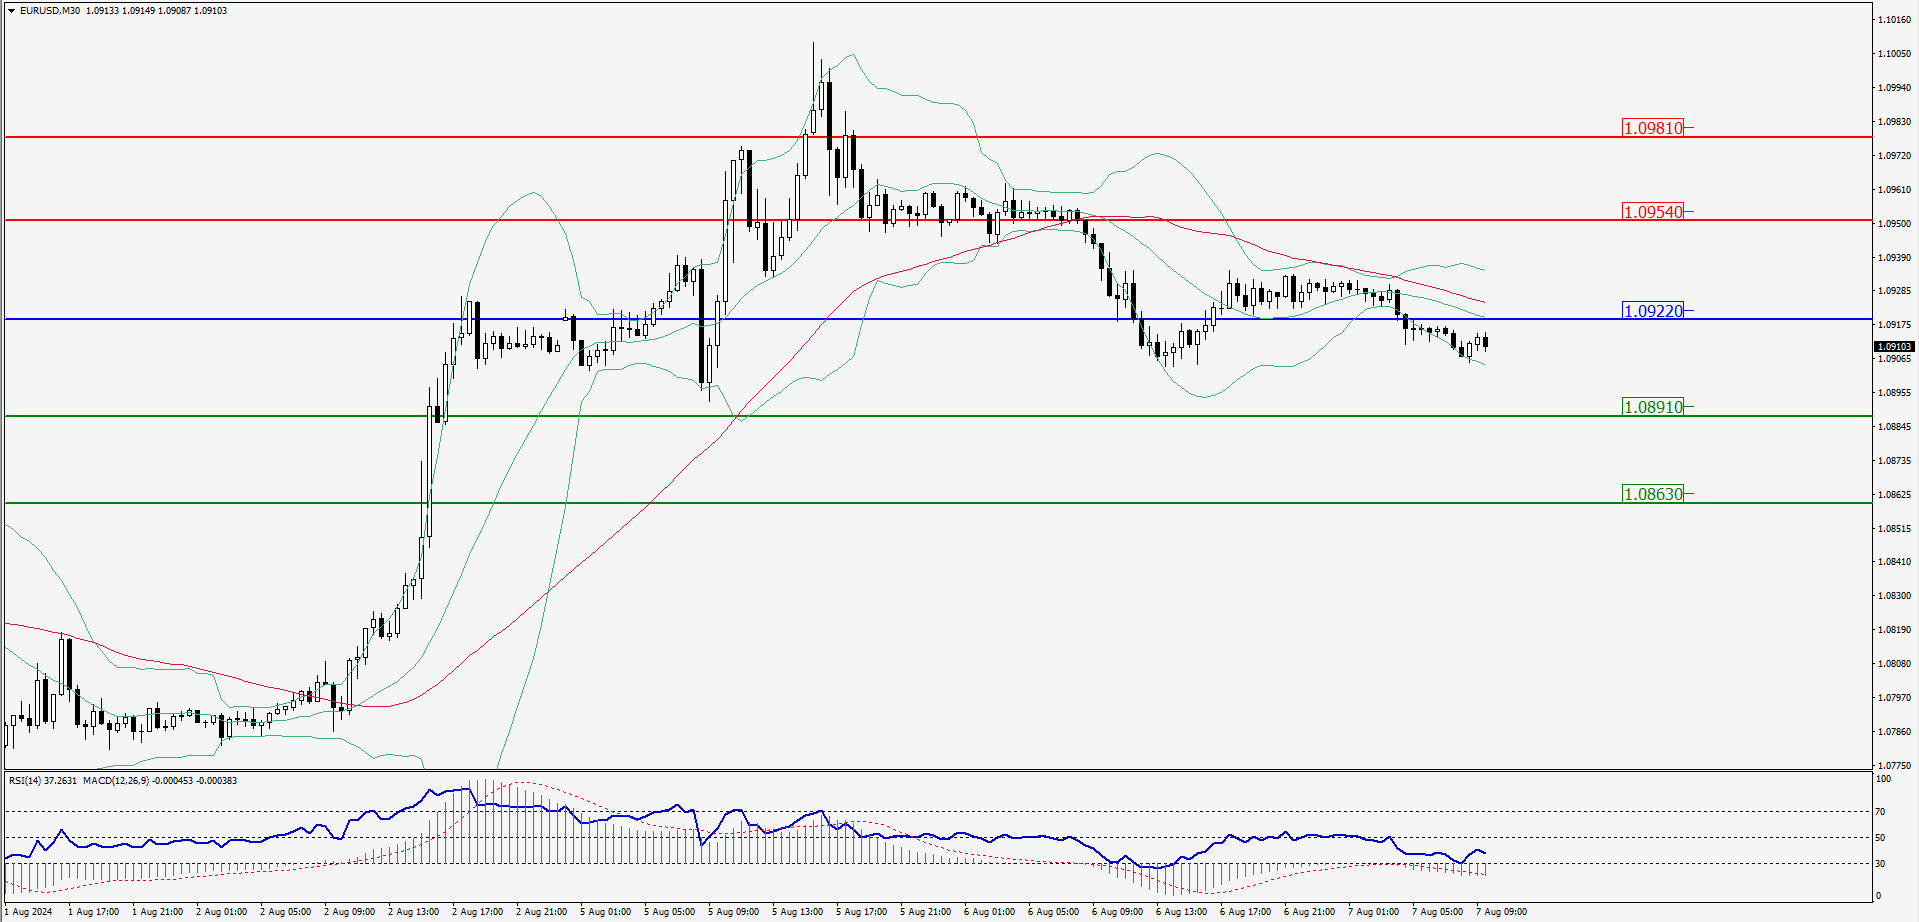
Green Lines Indicate Resistance Levels – Red Lines Indicate Support Levels
Light Blue is a Pivot Point – Black represents the price when the report was produced
GBP/USD Intraday: Trend on the upside
Our pivot point is at 1.27090
Preferable Price Action: Buy positions above pivot with targets at 1.27270 & 1.27440 in extension.
Alternative Price Action: The price below pivot would call for further downside to 1.26920 & 1.26740.
Comment: RSI is above 50 levels.
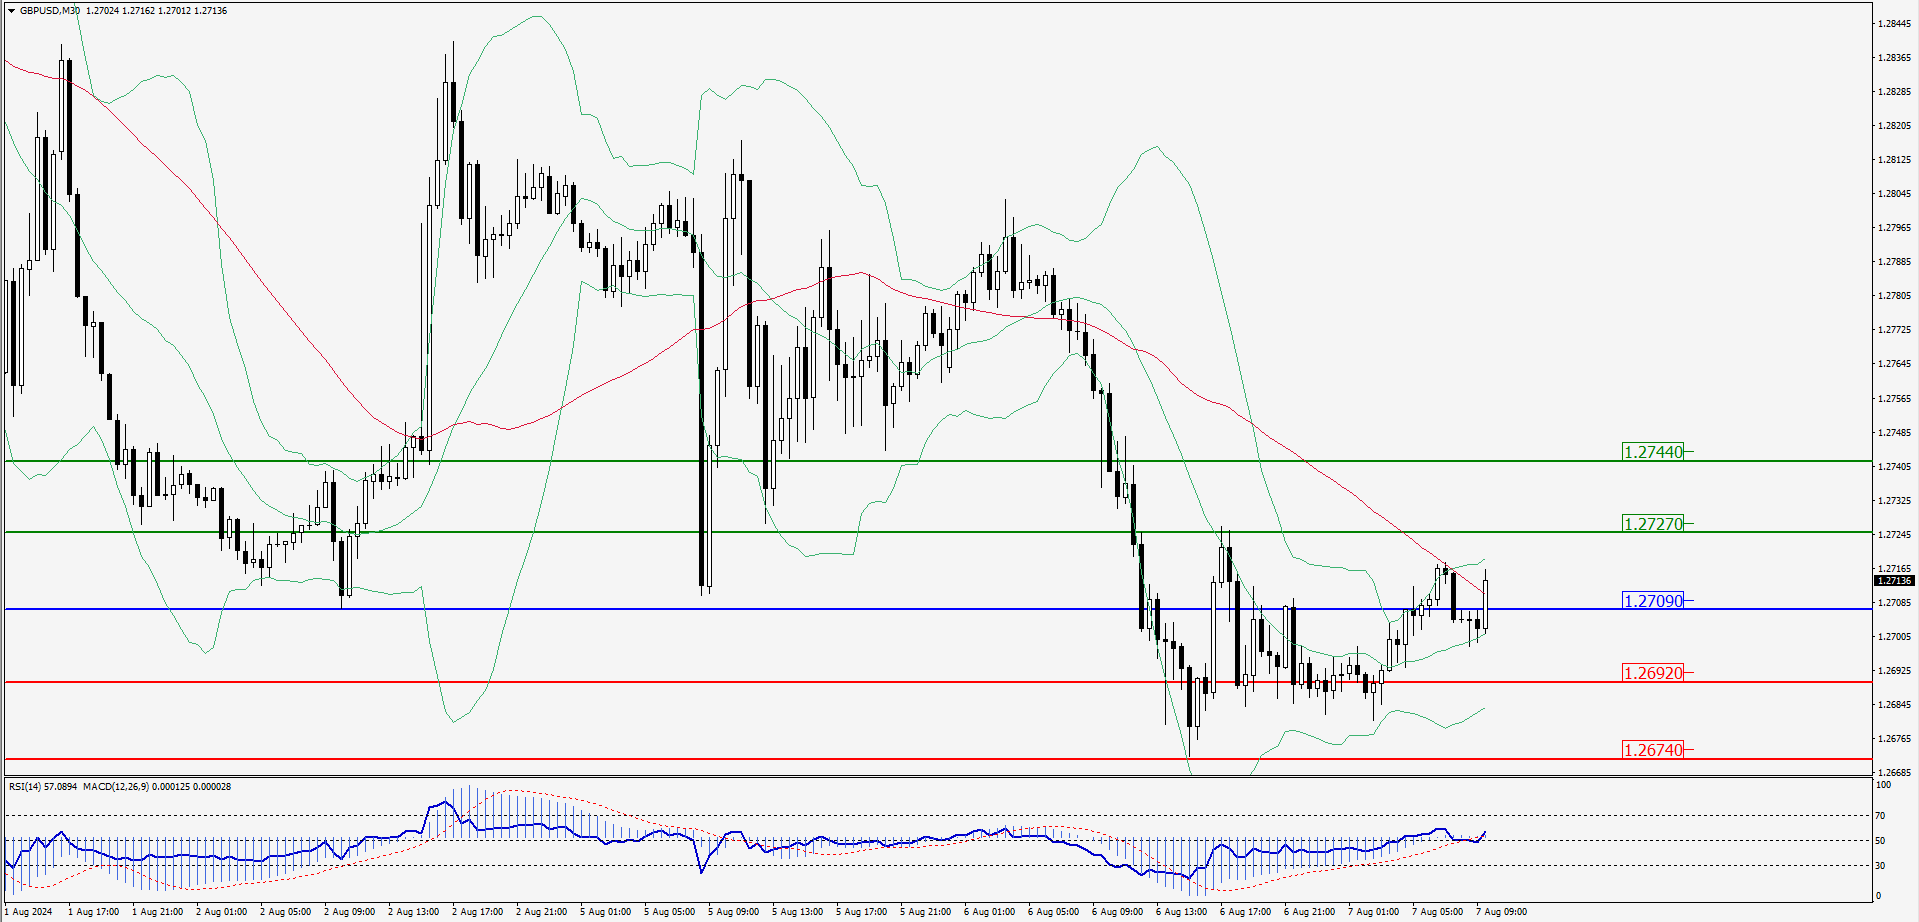
Green Lines Indicate Resistance Levels – Red Lines Indicate Support Levels
Light Blue is a Pivot Point – Black represents the price when the report was produced
USD/JPY Intraday: Trend on the upside
Our pivot point is at 146.510
Preferable Price Action: Buy position above pivot with the target at 147.850 and 149.160 in extension.
Alternative Price Action: The downside breakout of the pivot would call for 145.070 and 143.890.
Comment: MACD is above 50 levels and Pairs above its 20MA & 55MA.
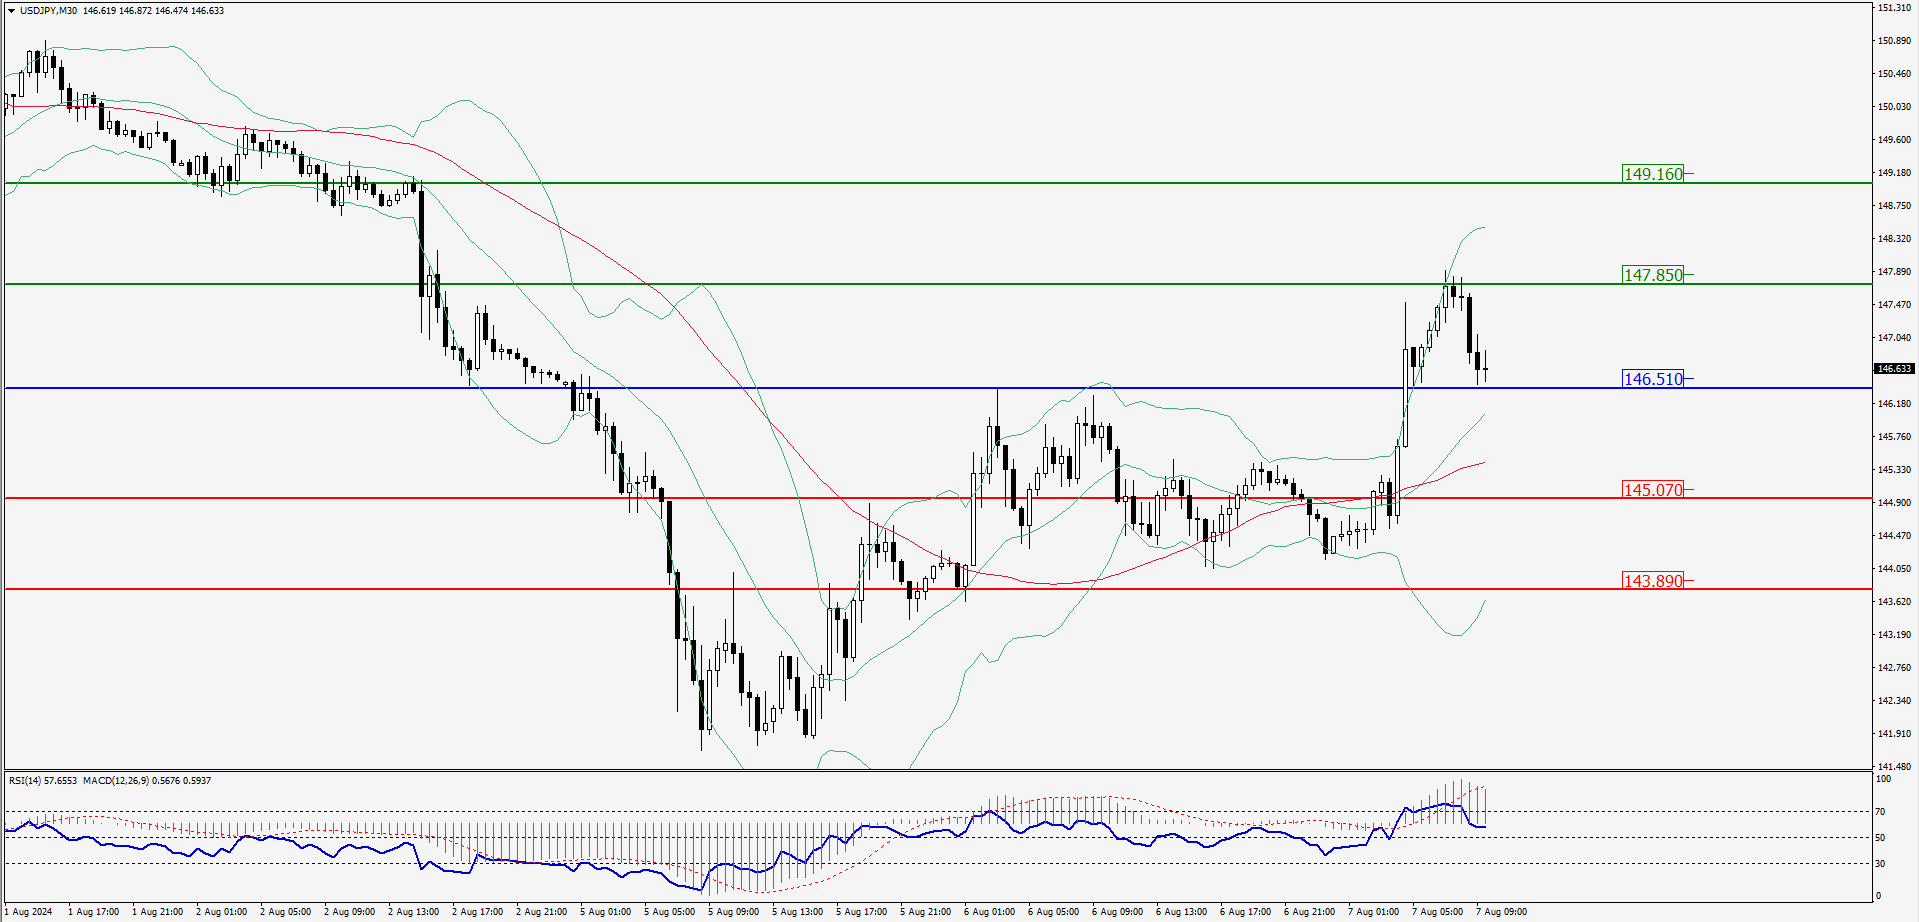
Green Lines Indicate Resistance Levels – Red Lines Indicate Support Levels
Light Blue is a Pivot Point – Black represents the price when the report was produced
AUD/USD Intraday: Trend on the upside
Our pivot point is at 0.65390
Preferable Price Action: Buy positions above pivot with targets at 0.65650 & 0.65880 in extension.
Alternative Price Action: Below pivot a further downside with 0.65120 & 0.64900 as targets.
Comment: RSI is above 50 levels and Pairs above its 55MA.
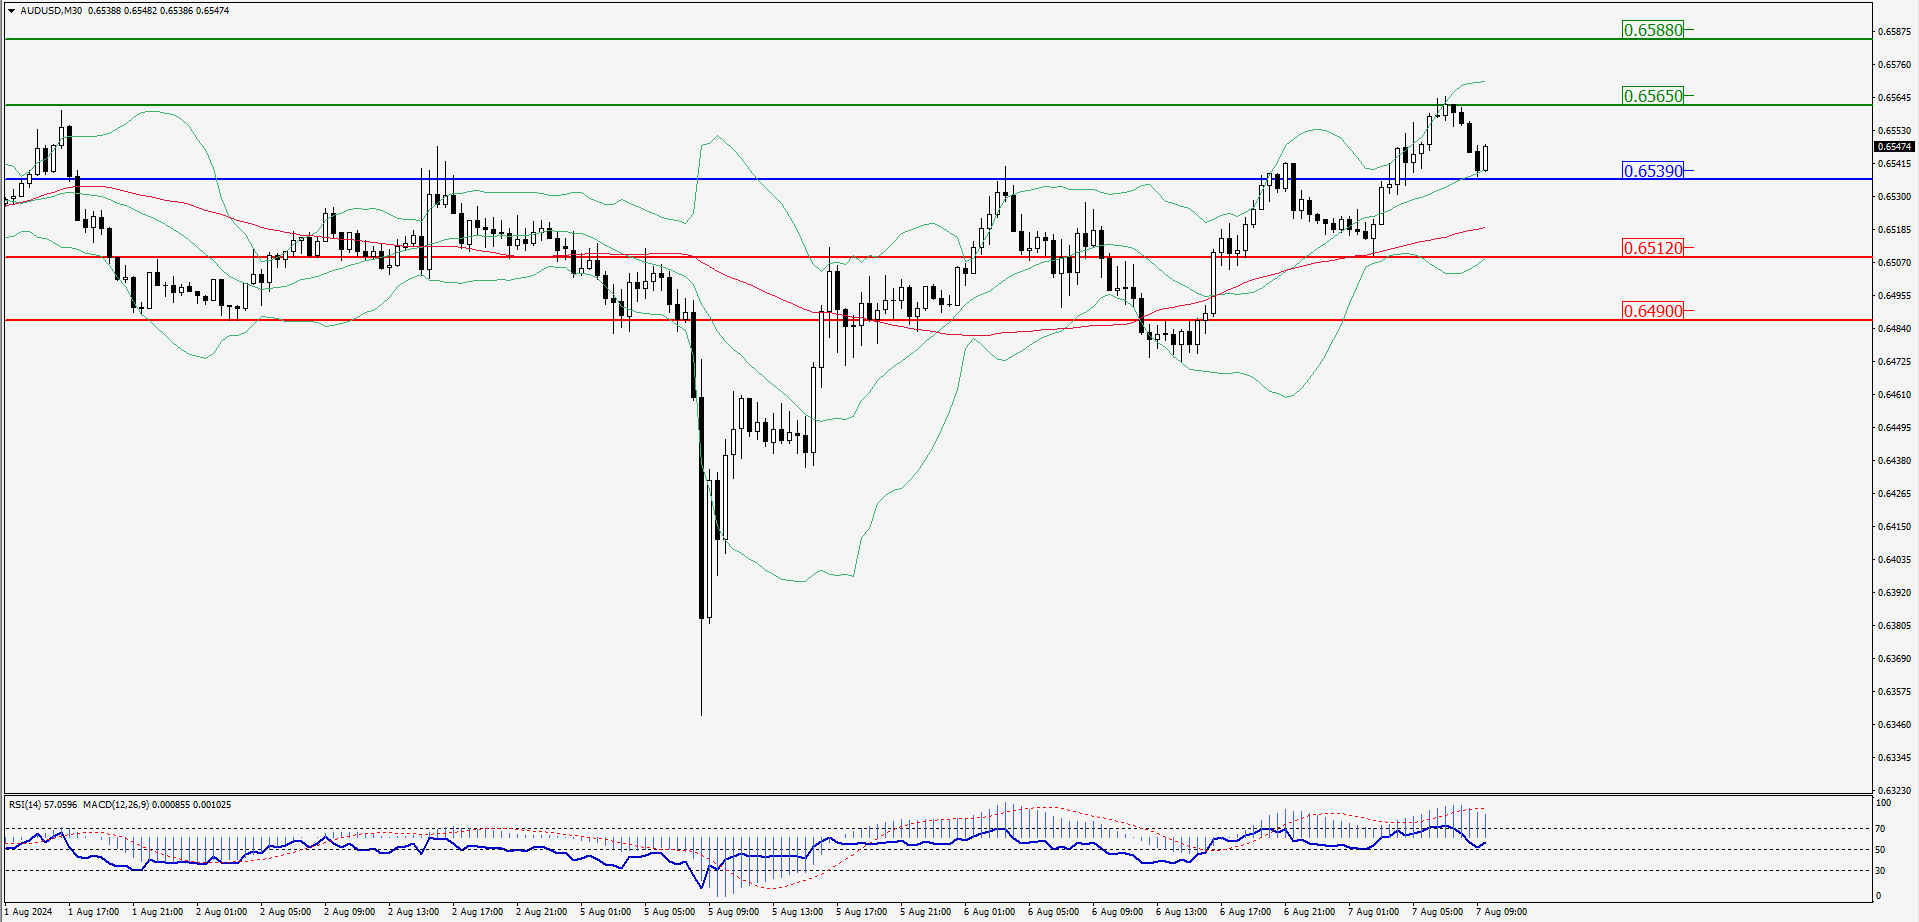
Green Lines Indicate Resistance Levels – Red Lines Indicate Support Levels
Light Blue is a Pivot Point – Black represents the price when the report was produced
CRUDEOIL Intraday: Resistance level at 72.76
Our pivot point is at 72.76
Preferable Price Action: Below pivot sell oil with 71.95 & 71.17 as targets.
Alternative Price Action: Buy crude above pivot with targets at 73.59 and 74.35 in extension.
Comment: RSI is below 50 levels .
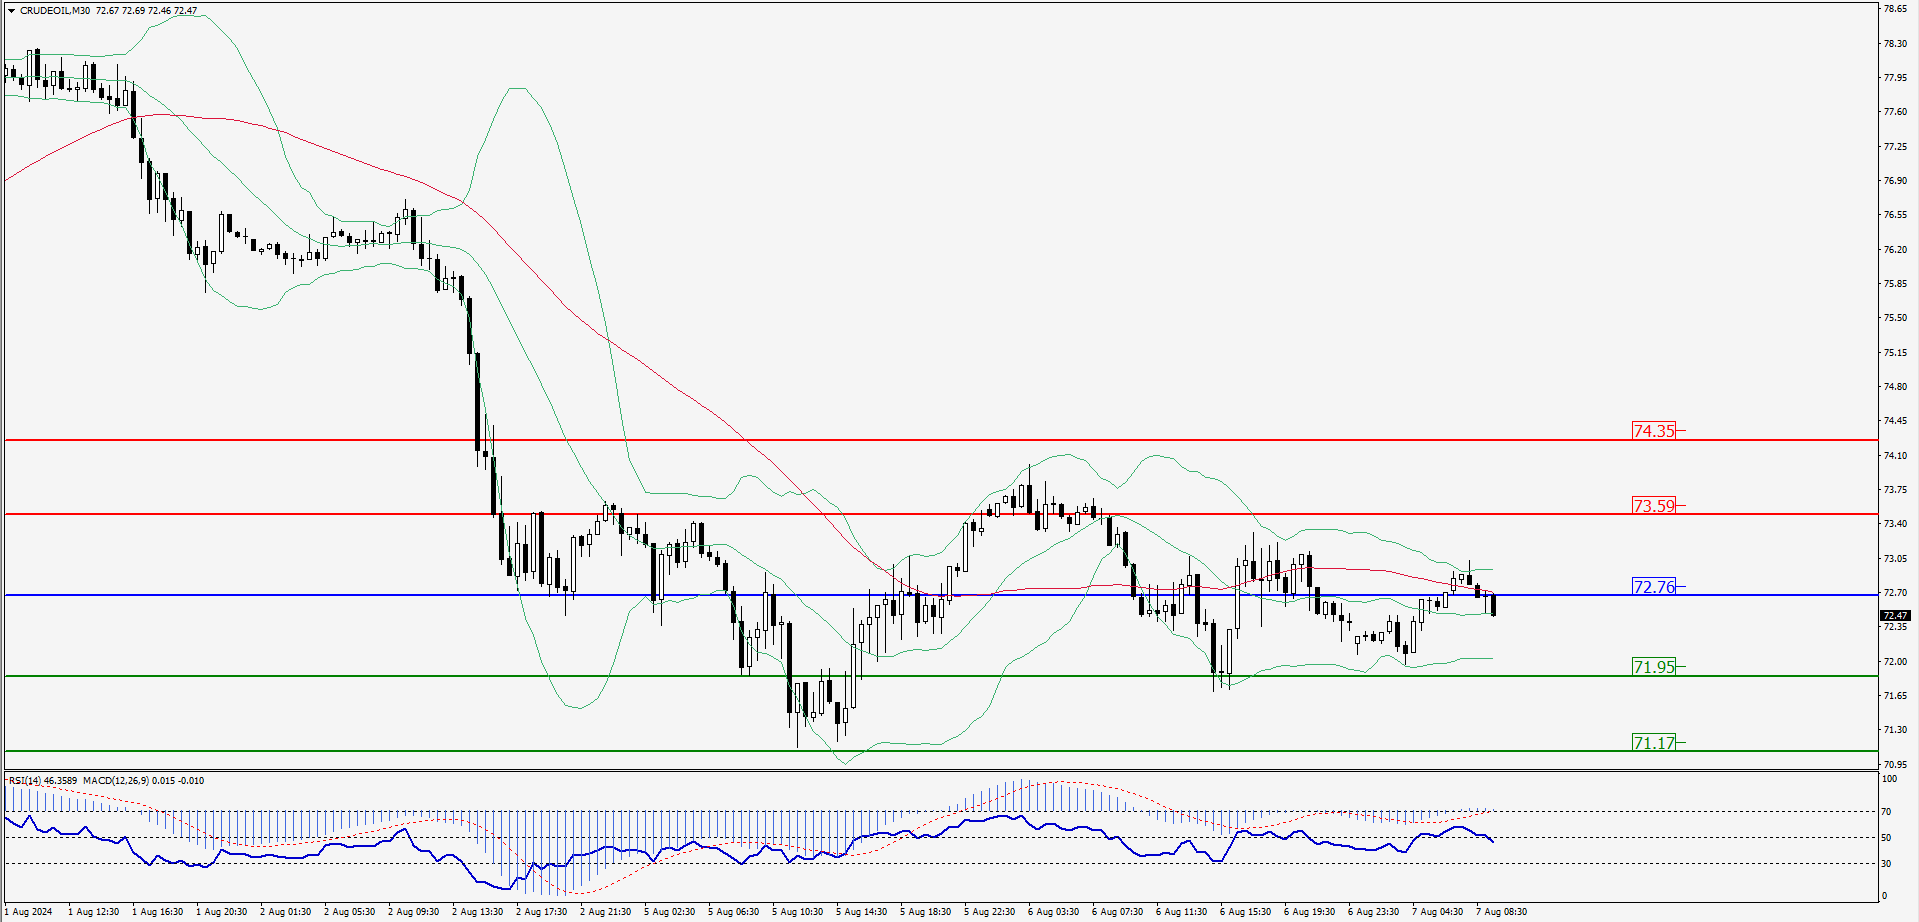
Green Lines Indicate Resistance Levels – Red Lines Indicate Support Levels
Light Blue is a Pivot Point – Black represents the price when the report was produced
XAU/USD Intraday: Trend on the upside
Our pivot point is at 2390.60
Preferable Price Action: Further upside to 2404.50 and 2416.30.
Alternative Price Action: If the price gives an downside breakout of a pivot, then the price extends to 2376.80 and 2364.00.
Comment: MACD is above 50 levels and pairs above its 20MA.
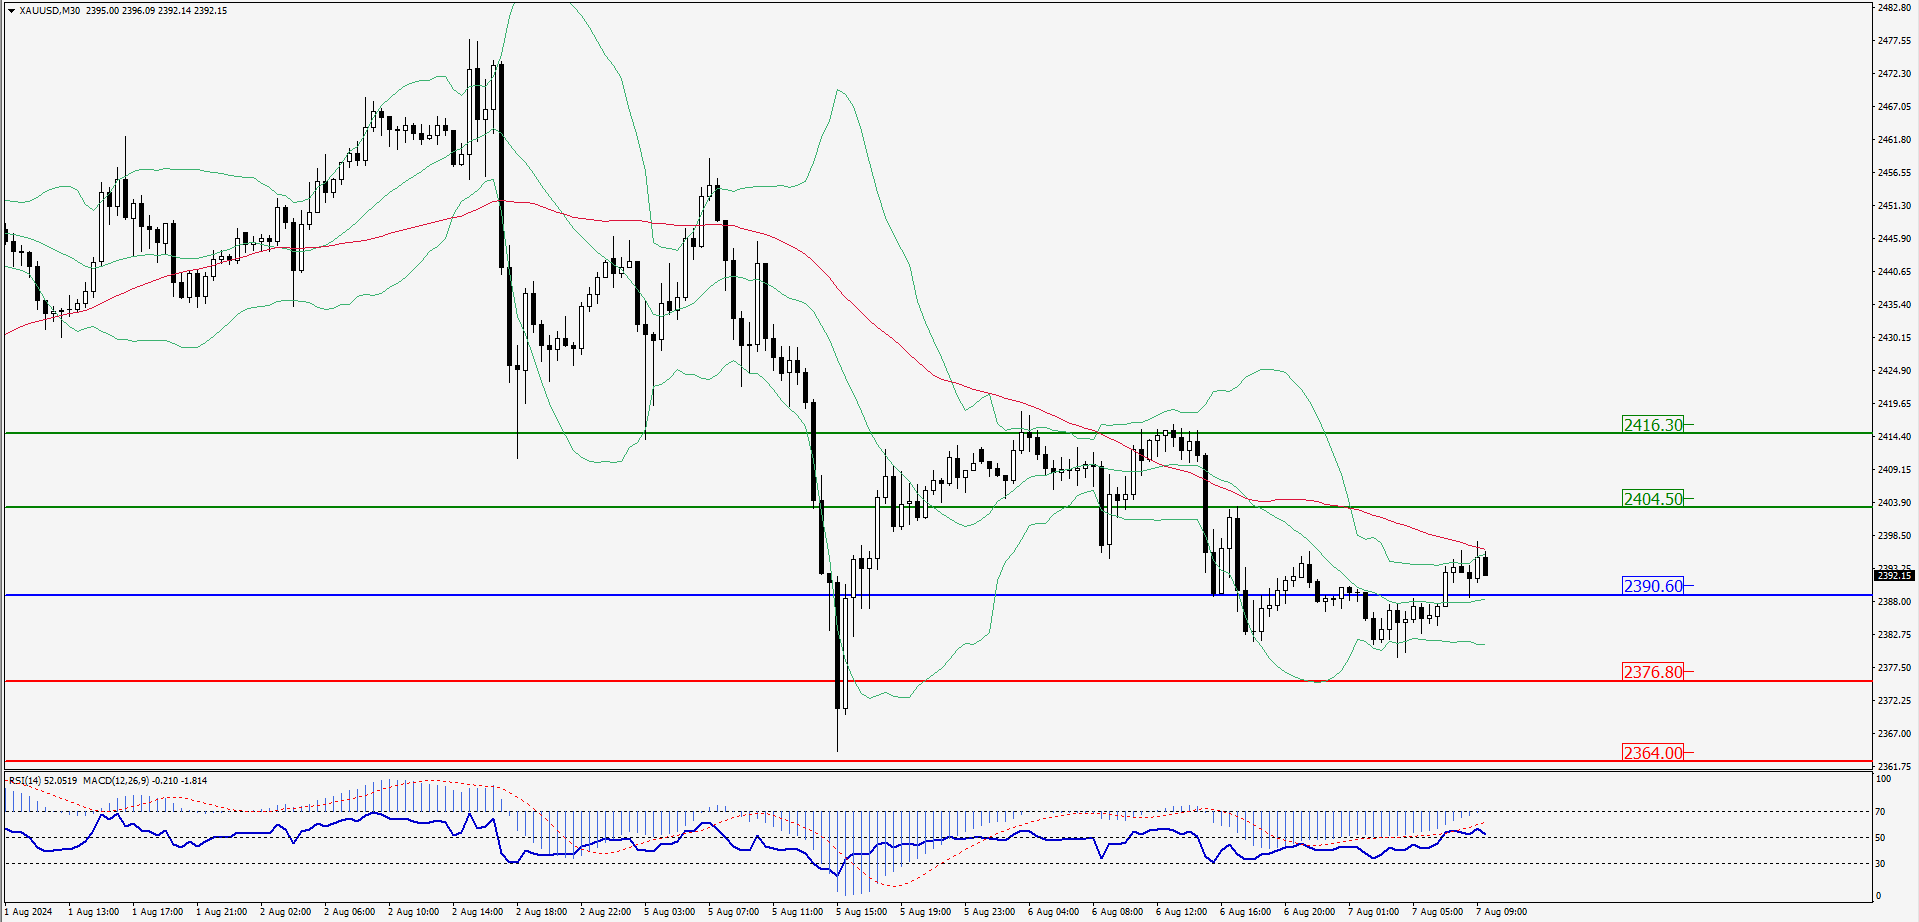
Green Lines Indicate Resistance Levels – Red Lines Indicate Support Levels
Light Blue is a Pivot Point – Black represents the price when the report was produced
Dow Jones Intraday: Trend on the upside
Our pivot point is 39,112.20
Preferable Price Action: Take buy positions above the pivot with targets at 39,490.90 & 39,846.90.
Alternative Price Action: Above 39,112.20 looks for further downside to 38,752.40 & 38,404.00.
Comment: RSI is above 50 levels and pairs above its 20MA and 55MA.
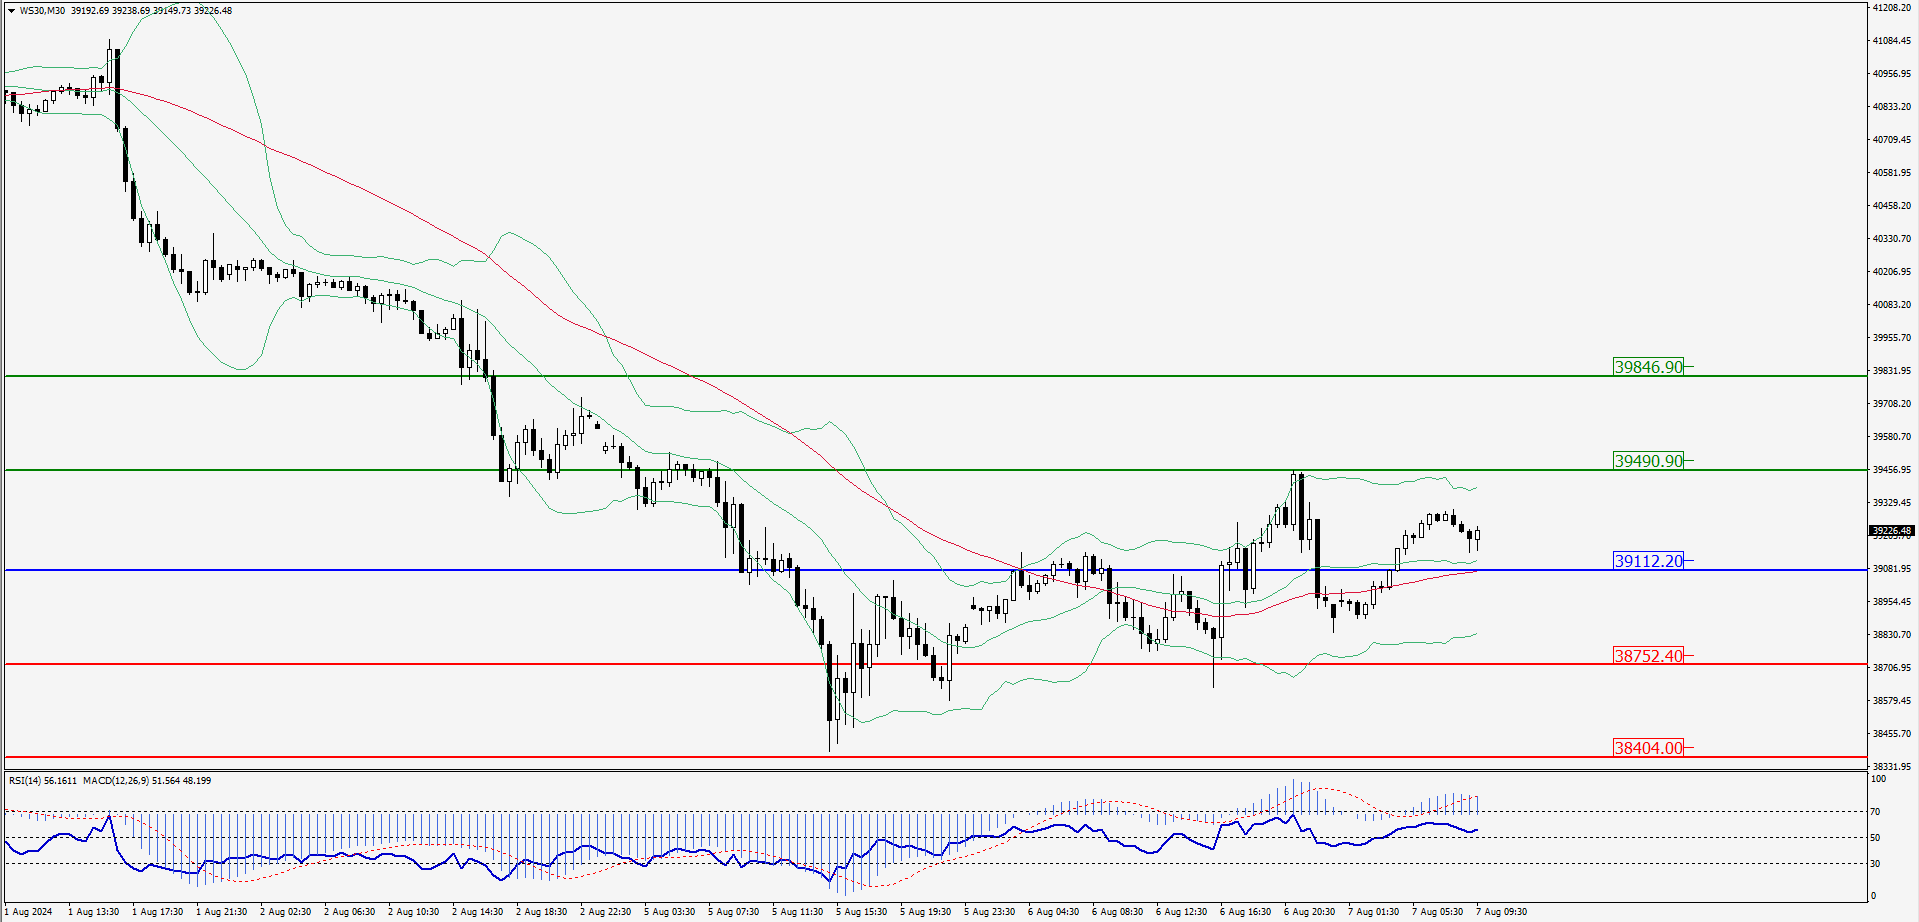
Green Lines Indicate Resistance Levels – Red Lines Indicate Support Levels
Light Blue is a Pivot Point – Black represents the price when the report was produced