Market Wrap: Stocks, Bonds, Commodities
Most Asian currencies moved in a tight range on Monday, taking little advantage of a softer dollar amid growing concerns over a slowdown in U.S. economic growth.
The Dow Jones Industrial Average fail 610.71 points to 39,737.26, the S&P 500 loss 1.84% to 5,346.56 and the Nasdaq Composite descend 417.99 points to 16,776.16.
MSCI’s index of Asia-Pacific stocks outside Japan is down 4.41% to 648.03 levels. The Australian index was lower by 3.70% to 7,649.60. Japanese Nikkei Index decrease 13.47% today.
European stocks were negative on Monday, with the Stoxx Europe 50 Index decrease 2.07% to 4,542.65, Germany’s DAX descend 2.08% to 17,274.65, and France’s CAC lower 1.87% to 7,116.33 and U.K.’s FTSE 100 loss 2.04% to 8,007.80.
Benchmark 10-year U.S. Treasury rose as demand for safe assets slipped again, today 10-year bond yields decrease 1.09% to 3.7460.
Oil futures extended losses in a volatile session on Monday as fears of a recession in top oil consumer the United States offset supply worries stemming from mounting tensions in the Middle East, the world’s largest oil producing region.
Spot Brent crude oil increase 1.04% to $76.05 per barrel. US West Texas Intermediate crude is increase 1.07% to $72.73 a barrel.
The yellow metal gold is up 0.03% to 2,469.00 dollars per ounce.
Market Wrap: Forex
Japan’s yen hit its highest levels against the dollar since January on Monday, as markets extended moves triggered last week after weak U.S. labour data stoked recession worries and expectations of deeper rate cuts by the Federal Reserve.
Today, the U.S. dollar index measures the Greenback against a trade-weighted basket of six major currencies, which decrease 0.63% to 102.337.
The Euro US Dollar (EUR/USD) is a widely traded pair that is increase 0.48% today. This left the pair trading around $1.09600.
The Japanese yen was will move negative against the U.S. dollar on Monday. Today USD/JPY is trades pair that decrease 2.65% to the 142.650 level.
Another commodity-related currency negative against the U.S dollar, AUD/USD loss 0.98% to 0.64450, and NZD/USD decrease 0.44% to 0.59310 level.
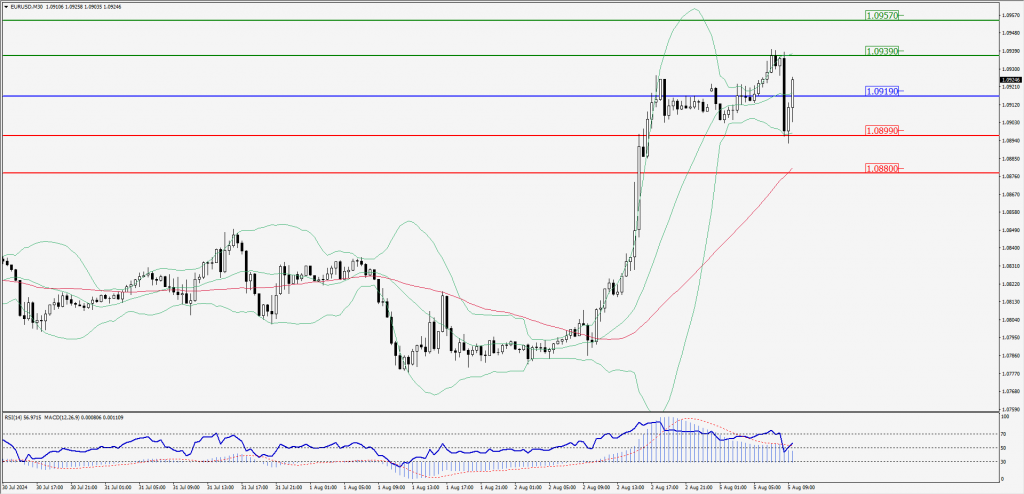
EUR/USD Intraday: Trend on the upside
Our pivot point is at 1.09190
Preferable Price Action: Take buy positions above pivot level with targets at 1.09390 & 1.09570 in extension.
Alternative Price Action: Sell pivot looks for a further downside to 1.08990 & 1.08800.
Comment: RSI is above 50 levels and Pairs above its 55MA.
Green Lines Indicate Resistance Levels – Red Lines Indicate Support Levels
Light Blue is a Pivot Point – Black represents the price when the report was produced
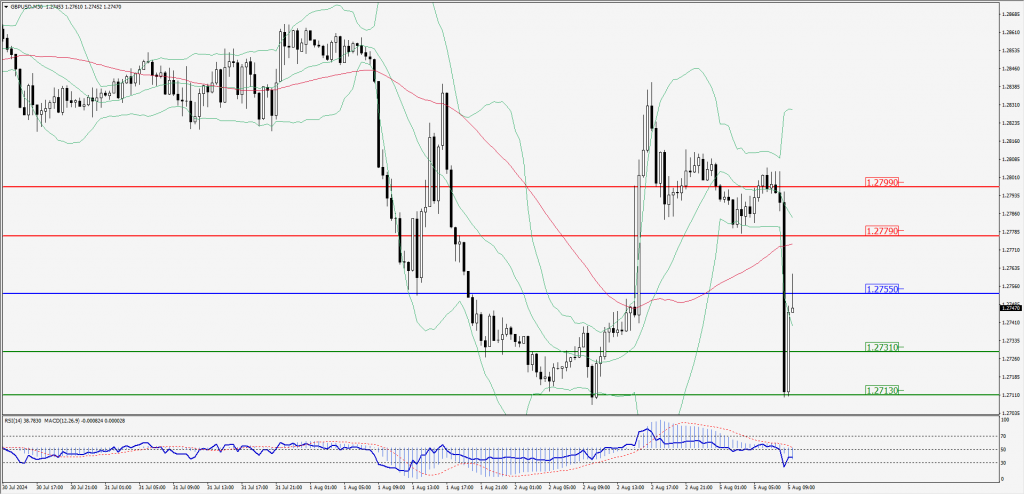
GBP/USD Intraday: Trend on the downside
Our pivot point is at 1.27550
Preferable Price Action: Sell positions below pivot with targets at 1.27310 & 1.27130 in extension.
Alternative Price Action: The price above pivot would call for further upside to 1.27790 & 1.27790.
Comment: RSI is below 50 levels and Pairs below its 55MA & 20MA.
Green Lines Indicate Resistance Levels – Red Lines Indicate Support Levels
Light Blue is a Pivot Point – Black represents the price when the report was produced
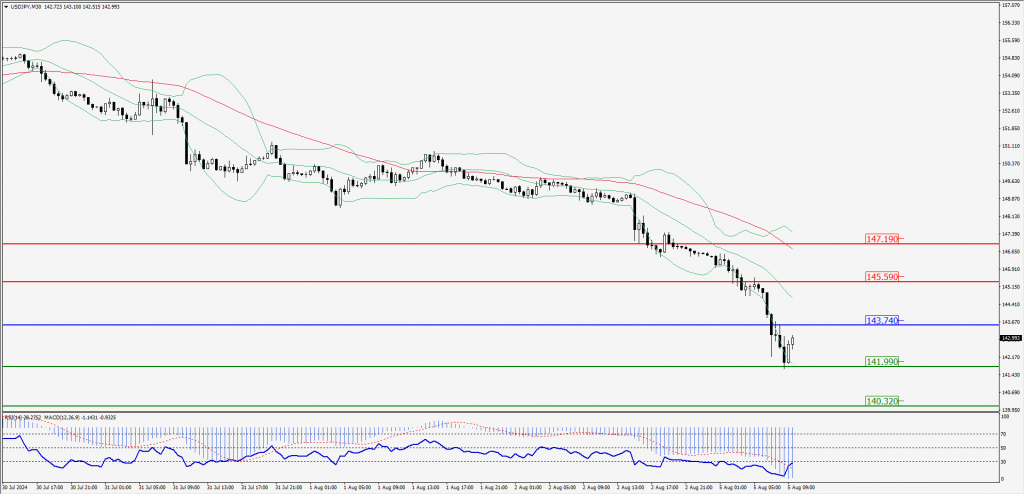
USD/JPY Intraday: Major trend on the downside
Our pivot point is at 143.740
Preferable Price Action: Sell position below pivot with the target at 141.990 and 140.320 in extension.
Alternative Price Action: The upside breakout of the pivot would call for 145.590 and 147.190.
Comment: MACD is below 50 levels and Pairs below its 20MA & 55MA.
Green Lines Indicate Resistance Levels – Red Lines Indicate Support Levels
Light Blue is a Pivot Point – Black represents the price when the report was produced
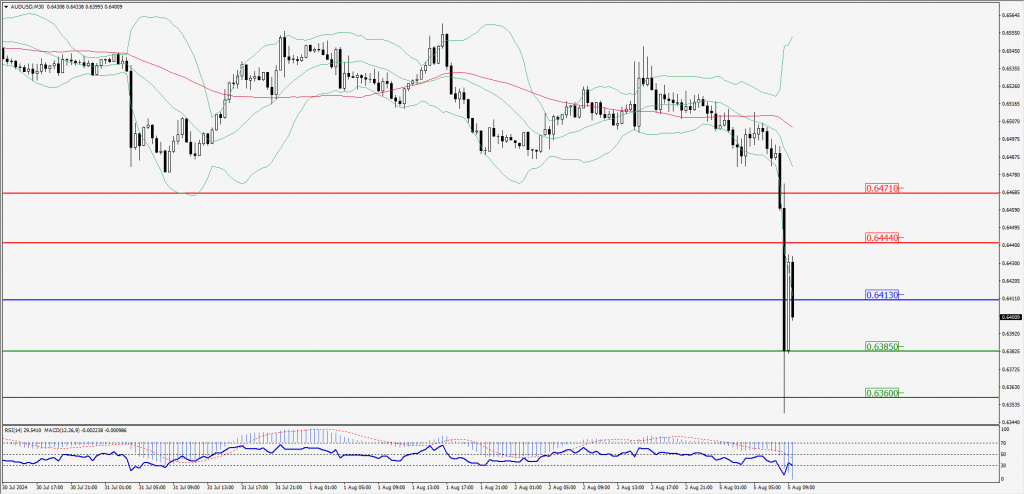
AUD/USD Intraday: Trend on the downside
Our pivot point is at 0.64130
Preferable Price Action: Sell positions below pivot with targets at 0.63850 & 0.63600 in extension.
Alternative Price Action: Above pivot a further upside with 0.64440 & 0.64710 as targets.
Comment: RSI is below 50 levels and Pairs below its 20MA & 55MA.
Green Lines Indicate Resistance Levels – Red Lines Indicate Support Levels
Light Blue is a Pivot Point – Black represents the price when the report was produced
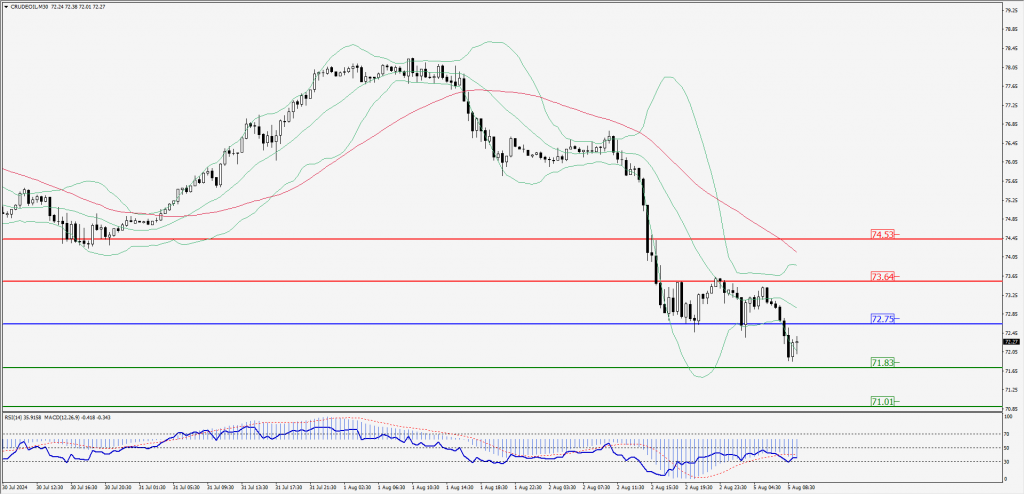
CRUDEOIL Intraday: Trend on the downside
Our pivot point is at 72.75
Preferable Price Action: Below pivot sell oil with 71.83 & 71.01 as targets.
Alternative Price Action: Buy crude above pivot with targets at 73.64 and 74.53 in extension.
Comment: RSI is below 50 levels and pairs below its 55MA & 20MA.
Green Lines Indicate Resistance Levels – Red Lines Indicate Support Levels
Light Blue is a Pivot Point – Black represents the price when the report was produced
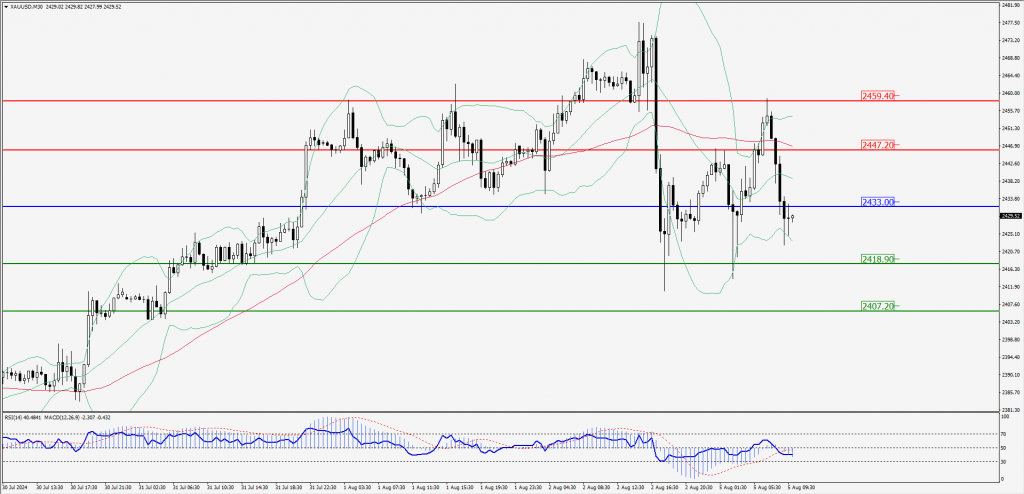
XAU/USD Intraday: Trend on the downside
Our pivot point is at 2433.00
Preferable Price Action: Further downside to 2418.90 and 2407.20.
Alternative Price Action: If the price gives an upside breakout of a pivot, then the price extends to 2447.20 and 2459.40.
Comment: MACD is below 50 levels and pairs below its 55MA & 20MA.
Green Lines Indicate Resistance Levels – Red Lines Indicate Support Levels
Light Blue is a Pivot Point – Black represents the price when the report was produced
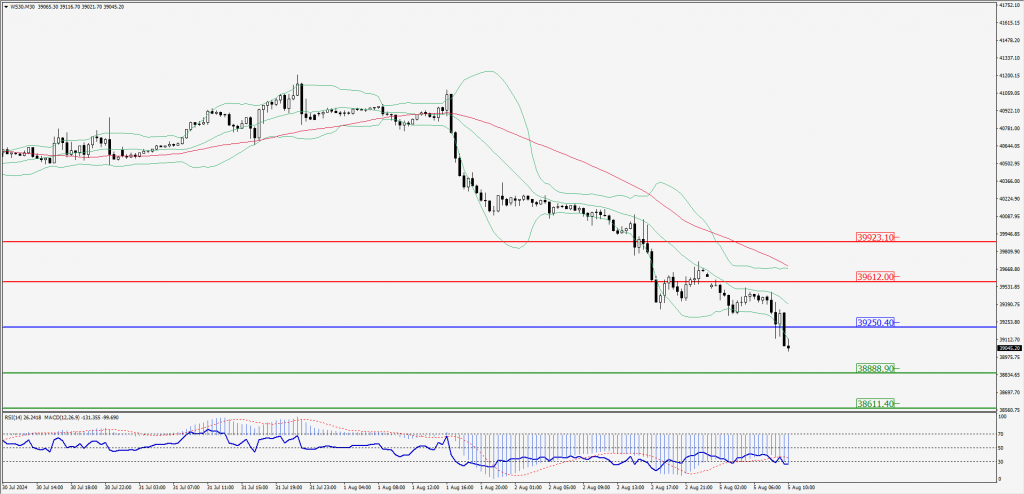
Dow Jones Intraday: Trend on the downside
Our pivot point is 39,250.40
Preferable Price Action: Take sell positions below the pivot with targets at 38,888.90 & 38,611.40.
Alternative Price Action: Above 40,154.90 looks for further upside to 39,923.10 & 39,612.00.
Comment: RSI is below 50 levels and pairs below its 20MA & 55MA.
Green Lines Indicate Resistance Levels – Red Lines Indicate Support Levels
Light Blue is a Pivot Point – Black represents the price when the report was produced