Market Wrap: Stocks, Bonds, Commodities
The U.S. dollar was on the back foot on Thursday after the Federal Reserve opened the door for an interest rate cut in September, helping keep the yen pinned near its highest since March in the wake of a hawkish pivot from the Bank of Japan.
The Dow Jones Industrial Average rose 99.46 points to 40,842.79, the S&P 500 gain 1.58% to 5,522.30 and the Nasdaq Composite ascend 451.98 points to 17,599.40.
MSCI’s index of Asia-Pacific stocks outside Japan is up 0.50% to 695.92 levels. The Australian index was higher by 0.28% to 8,114.70. Japanese Nikkei Index decrease 2.62% today.
European stocks were negative on Thursday, with the Stoxx Europe 50 Index decrease 1.24% to 4,812.30, Germany’s DAX descend 1.22% to 18,273.35, and France’s CAC lower 1.30% to 7,433.83 and U.K.’s FTSE 100 loss 0.09% to 8,360.47.
Benchmark 10-year U.S. Treasury rose as demand for safe assets slipped again, today 10-year bond yields decrease 1.22% to 4.0550.
Oil prices rose on Thursday, extending gains from the previous session, after the killing of a Hamas leader in Iran raised the threat of a wider Middle East conflict and concern over its impact on oil.
Spot Brent crude oil increase 0.92% to $81.58 per barrel. US West Texas Intermediate crude is increase 0.94% to $78.64 a barrel.
The yellow metal gold is up 0.38% to 2,482.40 dollars per ounce.
Market Wrap: Forex
Most Asian currencies strengthened on Thursday as the dollar dropped after the Federal Reserve signaled that an interest rate cut was close, while the Japanese yen hit a five-month high on hawkish signals from the Bank of Japan.
Today, the U.S. dollar index measures the Greenback against a trade-weighted basket of six major currencies, which increase 0.27% to 104.1350.
The Euro US Dollar (EUR/USD) is a widely traded pair that is decrease 0.37% today. This left the pair trading around $1.07850.
The Japanese yen was will move negative against the U.S. dollar on Thursday. Today USD/JPY is trades pair that decrease 0.16% to the 149.740 level.
Another commodity-related currency negative against the U.S dollar, AUD/USD loss 0.38% to 0.65150, and NZD/USD decrease 0.14% to 0.59390 level.
EUR/USD Intraday: Resistance level at 1.08190
Our pivot point is at 1.08190
Preferable Price Action: Take sell positions below pivot level with targets at 1.08080 & 1.07990 in extension.
Alternative Price Action: Buy pivot looks for a further upside to 1.08290 & 1.08380.
Comment: RSI is below 50 levels and Pairs below its 55MA & 20MA.
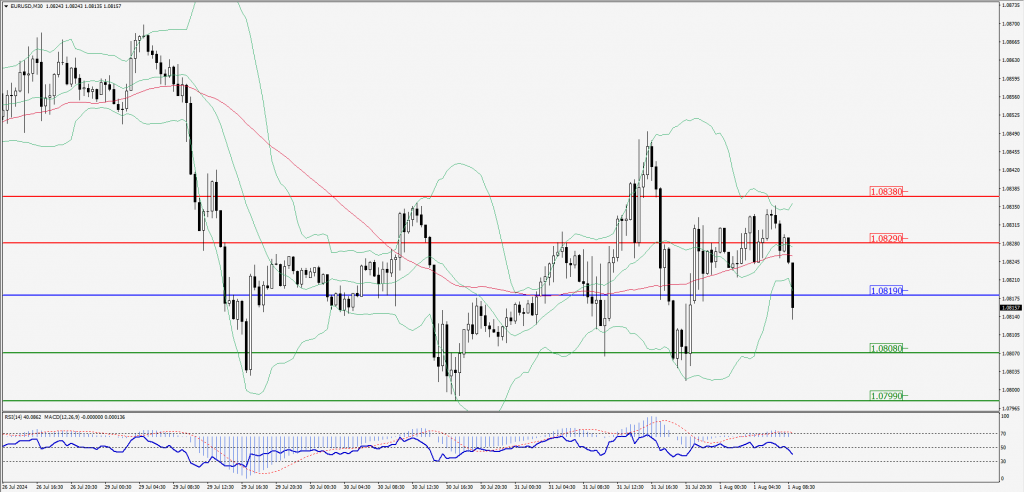
Green Lines Indicate Resistance Levels – Red Lines Indicate Support Levels
Light Blue is a Pivot Point – Black represents the price when the report was produced
GBP/USD Intraday: Major trend on the downside
Our pivot point is at 1.28130
Preferable Price Action: Sell positions below pivot with targets at 1.27980 & 1.27870 in extension.
Alternative Price Action: The price above pivot would call for further upside to 1.28290 & 1.28430.
Comment: RSI is below 50 levels and Pairs below its 55MA & 20MA.
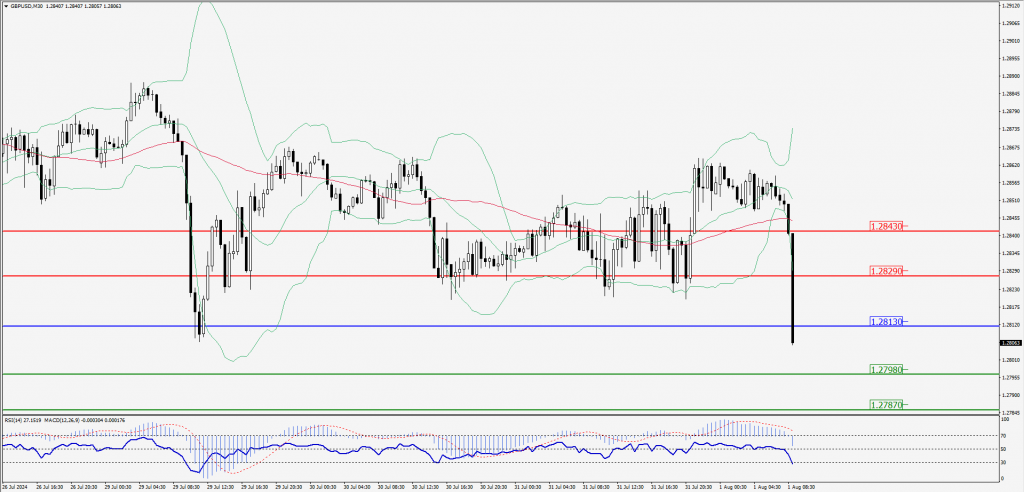
Green Lines Indicate Resistance Levels – Red Lines Indicate Support Levels
Light Blue is a Pivot Point – Black represents the price when the report was produced
USD/JPY Intraday: Trend on the upside
Our pivot point is at 150.020
Preferable Price Action: Buy position above pivot with the target at 150.890 and 151.670 in extension.
Alternative Price Action: The downside breakout of the pivot would call for 149.200 and 148.460.
Comment: MACD is above 50 levels and Pairs above its 20MA.
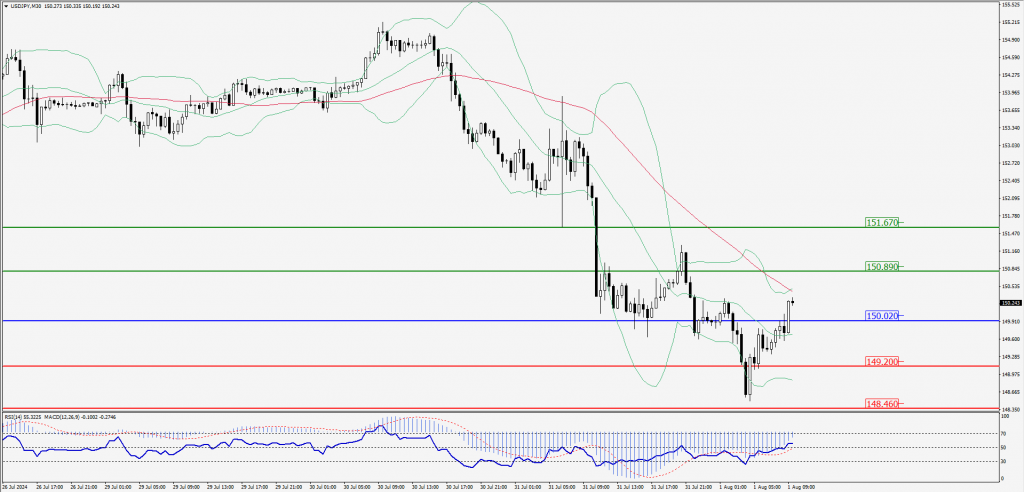
Green Lines Indicate Resistance Levels – Red Lines Indicate Support Levels
Light Blue is a Pivot Point – Black represents the price when the report was produced
AUD/USD Intraday: Trend on the downside
Our pivot point is at 0.65290
Preferable Price Action: Sell positions below pivot with targets at 0.65170 & 0.65050 in extension.
Alternative Price Action: Above pivot a further upside with 0.65410 & 0.65510 as targets.
Comment: RSI is below 50 levels and Pairs below its 20MA.
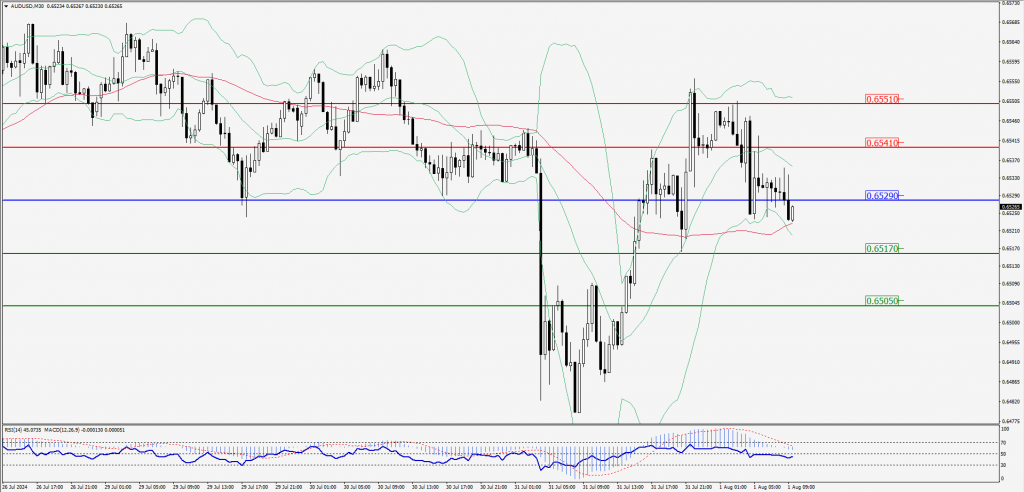
Green Lines Indicate Resistance Levels – Red Lines Indicate Support Levels
Light Blue is a Pivot Point – Black represents the price when the report was produced
CRUDEOIL Intraday: Trend on the upside
Our pivot point is at 77.81
Preferable Price Action: Above pivot buy oil with 78.39 & 78.39 as targets.
Alternative Price Action: Sell crude below pivot with targets at 77.19 and 76.64 in extension.
Comment: RSI is above 50 levels and pairs above its 55MA.
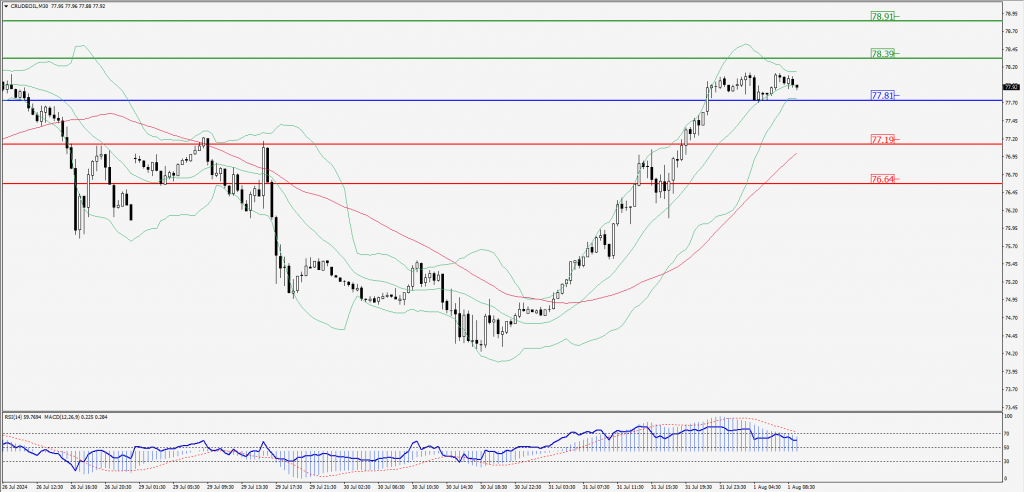
Green Lines Indicate Resistance Levels – Red Lines Indicate Support Levels
Light Blue is a Pivot Point – Black represents the price when the report was produced
XAU/USD Intraday: Trend on the upside
Our pivot point is at 2443.00
Preferable Price Action: Further upside to 2454.50 and 2464.90.
Alternative Price Action: If the price gives an downside breakout of a pivot, then the price extends to 2431.50 and 2421.10.
Comment: MACD is above 50 levels and pairs above its 55MA.
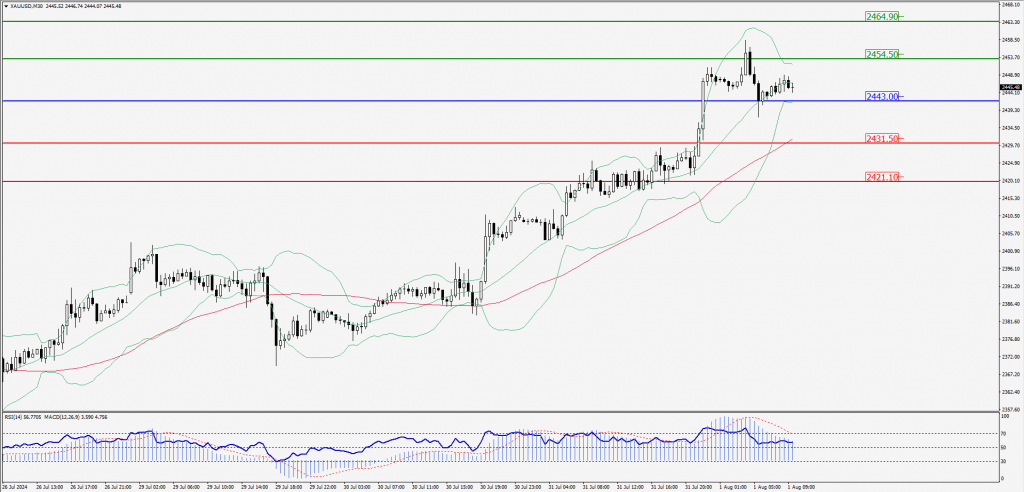
Green Lines Indicate Resistance Levels – Red Lines Indicate Support Levels
Light Blue is a Pivot Point – Black represents the price when the report was produced
Dow Jones Intraday: Trend on the downside
Our pivot point is 40,950.10
Preferable Price Action: Take sell positions below the pivot with targets at 40,798.60 & 40,666.20.
Alternative Price Action: Below 40,950.10 looks for further upside to 41,095.30 & 41,230.90.
Comment: RSI is below 50 levels and pairs below its 20MA.
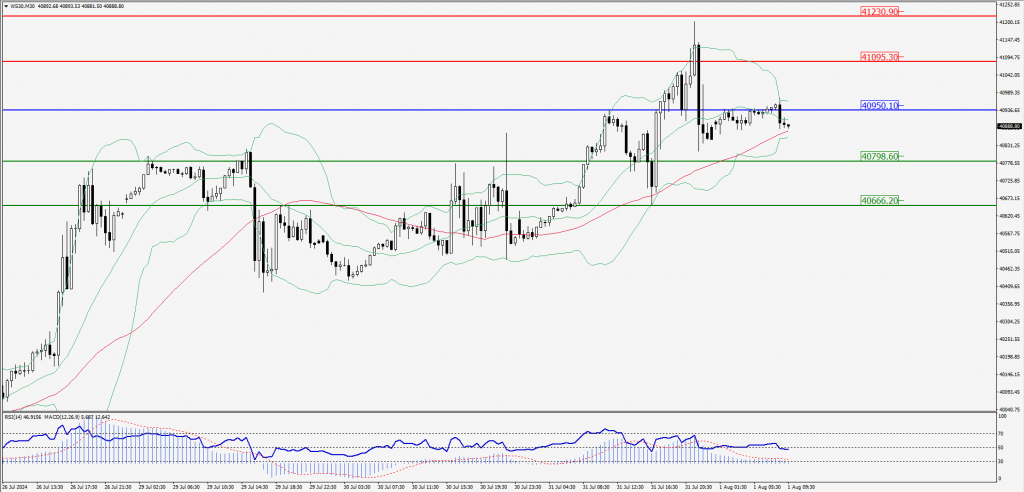
Green Lines Indicate Resistance Levels – Red Lines Indicate Support Levels
Light Blue is a Pivot Point – Black represents the price when the report was produced