Market Wrap: Stocks, Bonds, Commodities
The U.S. dollar edged higher in early European trade Tuesday, bouncing off its lowest level in a month ahead of Fed Chair Jerome Powell’s testimony to the Senate, while the euro has held its ground amid a volatile French political climate.
The Dow Jones Industrial Average fell 31.08 points to 39,344.79, the S&P 500 gain 0.10% to 5,572.85 and the Nasdaq Composite ascend 49.58 points to 18,402.34.
MSCI’s index of Asia-Pacific stocks outside Japan is up 0.36% to 711.49 levels. The Australian index was higher by 0.86% to 7,829.70. Japanese Nikkei Index increase 1.92% today.
European stocks were mixed on Tuesday, with the Stoxx Europe 50 Index decrease 0.25% to 4,957.25, Germany’s DAX descend 0.17% to 18,456.45, and France’s CAC lower 0.40% to 7,597.19 and U.K.’s FTSE 100 gain 0.21% to 8,210.36.
Benchmark 10-year U.S. Treasury rose as demand for safe assets slipped again, today 10-year bond yields increase 0.54% to 4.2890.
Oil prices slipped on Tuesday after a hurricane that hit a key U.S. oil-producing hub in Texas caused less damage than markets had expected, easing concerns over supply disruption
Spot Brent crude oil decrease 0.57% to $85.26 per barrel. US West Texas Intermediate crude is decrease 0.66% to $81.79 a barrel.
The yellow metal gold is up 0.17% to 2,367.55 dollars per ounce.
Market Wrap: Forex
The U.S. dollar steadied in early European trade Tuesday ahead of key inflation data, while the euro edged higher as traders digested the results of the French parliamentary elections.
Today, the U.S. dollar index measures the Greenback against a trade-weighted basket of six major currencies, which increase 0.05% to 104.7250.
The Euro US Dollar (EUR/USD) is a widely traded pair that is increase 0.01% today. This left the pair trading around $1.08230.
The Japanese yen was positive against the U.S. dollar on Tuesday. Today USD/JPY is trades pair that increases 0.14% to the 161.030 level.
Another commodity-related currency mixed against the U.S dollar, AUD/USD increase 0.02% to 0.67380, and NZD/USD decrease 0.12% to 0.61170 level.
EUR/USD Intraday: Trend on the downside
Our pivot point is at 1.08310
Preferable Price Action: Take sell positions below pivot level with targets at 1.08200 & 1.08090 in extension.
Alternative Price Action: Buy pivot looks for a further upside to 1.08420 & 1.08530.
Comment: RSI is below 50 levels and Pairs below its 55MA.
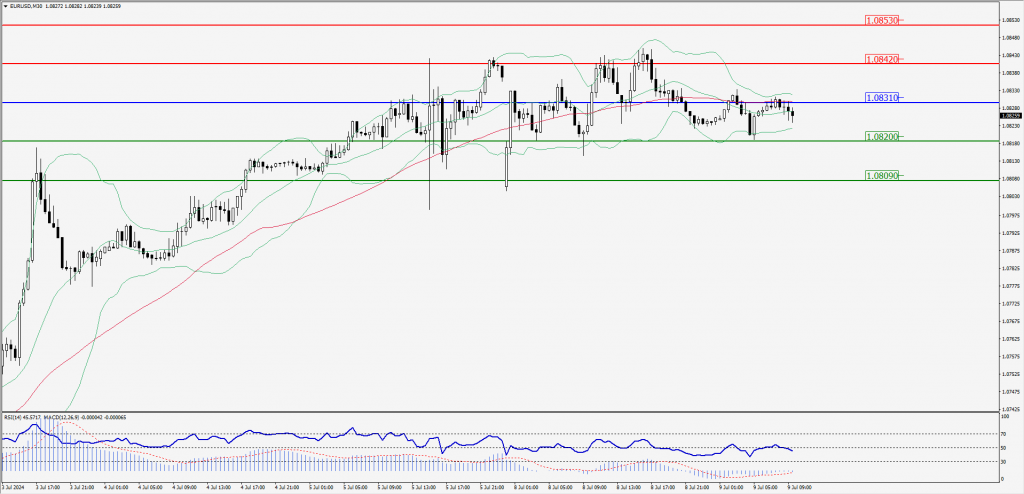
Green Lines Indicate Resistance Levels – Red Lines Indicate Support Levels
Light Blue is a Pivot Point – Black represents the price when the report was produced
GBP/USD Intraday: Trend on the downside
Our pivot point is at 1.28140
Preferable Price Action: Sell positions below pivot with targets at 1.27960 & 1.27790 in extension.
Alternative Price Action: The price above pivot would call for further upside to 1.28300 & 1.28460.
Comment: RSI is below 50 levels and Pairs below its 55MA.
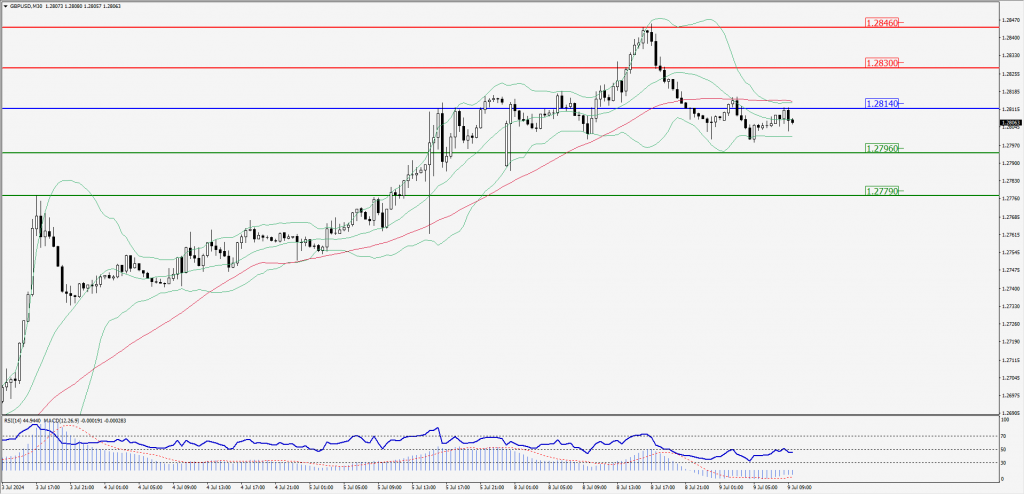
Green Lines Indicate Resistance Levels – Red Lines Indicate Support Levels
Light Blue is a Pivot Point – Black represents the price when the report was produced
USD/JPY Intraday: Resistance level at 160.950
Our pivot point is at 160.950
Preferable Price Action: Sell position below pivot with the target at 160.710 and 160.500 in extension.
Alternative Price Action: The upside breakout of the pivot would call for 161.180 and 161.400.
Comment: MACD is below 50 levels and Pairs below its 20MA.
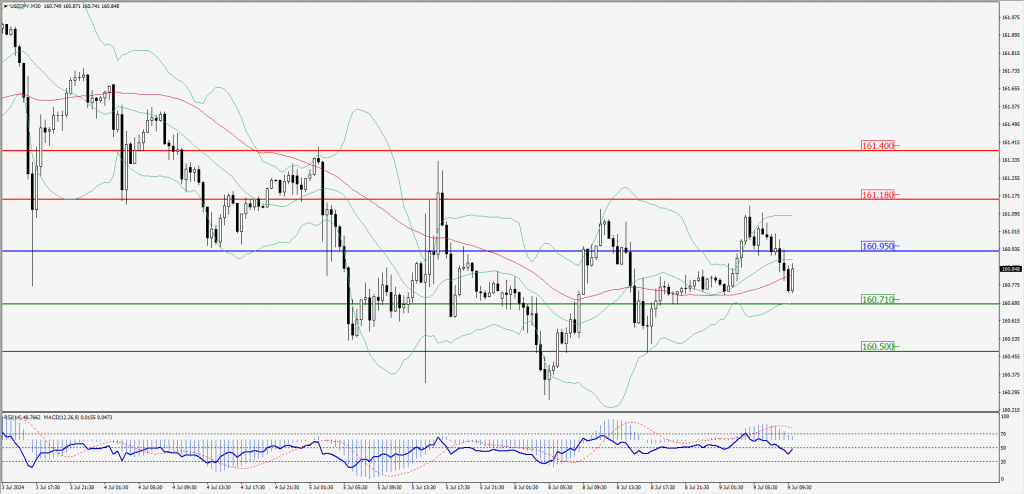
Green Lines Indicate Resistance Levels – Red Lines Indicate Support Levels
Light Blue is a Pivot Point – Black represents the price when the report was produced
AUD/USD Intraday: Trend on the upside
Our pivot point is at 0.67400
Preferable Price Action: Buy positions above pivot with targets at 0.67520 & 0.67620 in extension.
Alternative Price Action: Below pivot a further downside with 0.67280 & 0.67180 as targets.
Comment: RSI is above 50 levels and Pairs above its 20MA.
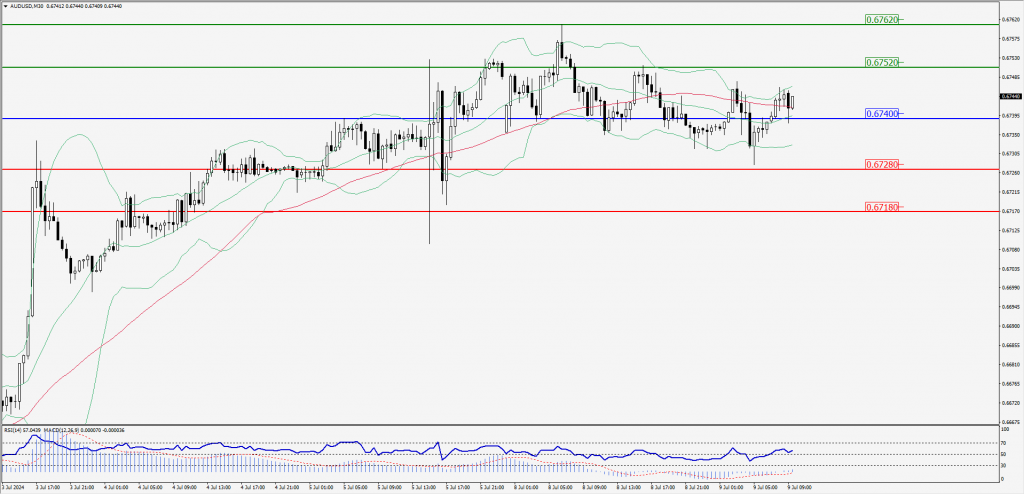
Green Lines Indicate Resistance Levels – Red Lines Indicate Support Levels
Light Blue is a Pivot Point – Black represents the price when the report was produced
CRUDEOIL Intraday: Trend on the downside
Our pivot point is at 82.75
Preferable Price Action: Below pivot sell oil with 81.33 & 80.88 as targets.
Alternative Price Action: Buy crude above pivot with targets at 82.25 and 82.71 in extension.
Comment: RSI is below 50 levels and pairs below its 55MA.
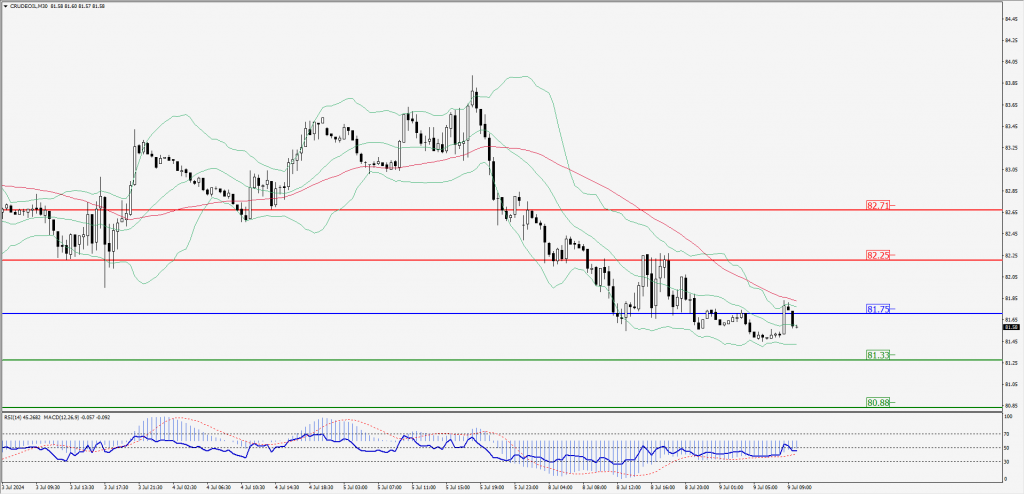
Green Lines Indicate Resistance Levels – Red Lines Indicate Support Levels
Light Blue is a Pivot Point – Black represents the price when the report was produced
XAU/USD Intraday: Trend on the downside
Our pivot point is 2365.30
Preferable Price Action: Further downside to 2357.60 and 2350.70.
Alternative Price Action: If the price gives an upside breakout of a pivot, then the price extends to 2373.20 and 2379.70.
Comment: MACD is below 50 levels and Pairs below its 55MA.
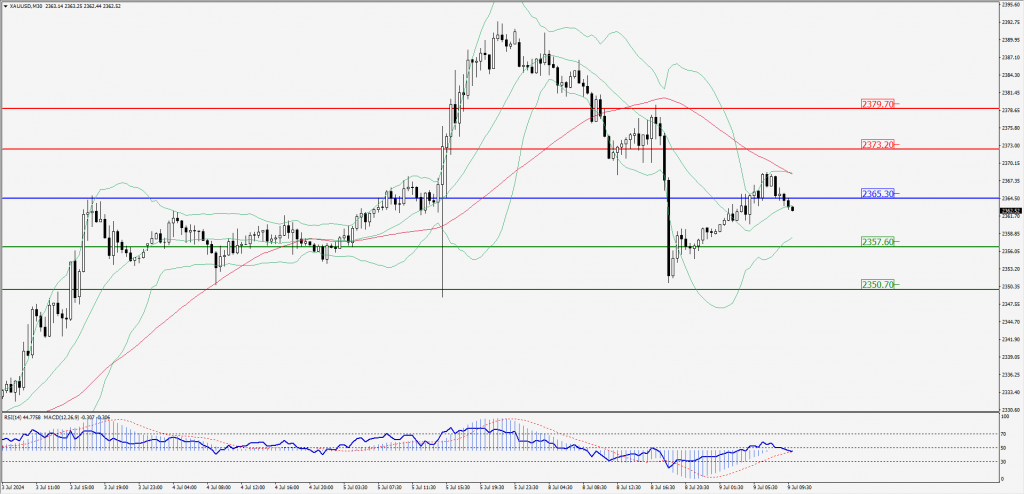
Green Lines Indicate Resistance Levels – Red Lines Indicate Support Levels
Light Blue is a Pivot Point – Black represents the price when the report was produced
Dow Jones Intraday: Trend on the downside
Our pivot point is 39,384.80
Preferable Price Action: Take sell positions below the pivot with targets at 39313.90 & 39249.50.
Alternative Price Action: Above 39,384.80 looks for further upside to 39,456.40 & 39,522.20.
Comment: RSI is below 50 levels and pairs below its 20MA.
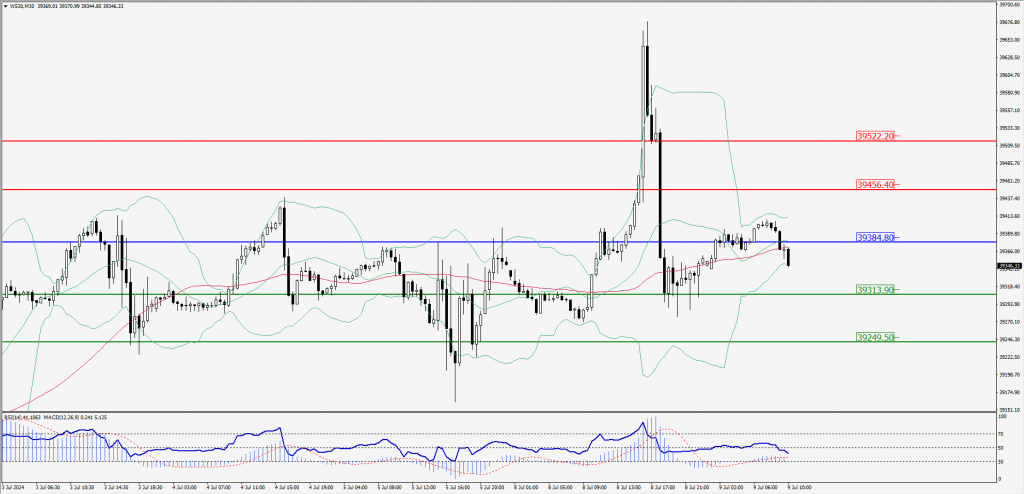
Green Lines Indicate Resistance Levels – Red Lines Indicate Support Levels
Light Blue is a Pivot Point – Black represents the price when the report was produced