Market Wrap: Stocks, Bonds, Commodities
The U.S. dollar retreated in early European trade Friday ahead of the key monthly jobs report, while sterling edged higher after the result of the U.K general election.
The Dow Jones Industrial Average fell 23.85 points to 39,308.00, the S&P 500 gain 0.51% to 5,537.02 and the Nasdaq Composite ascend 159.54 points to 18,188.30.
MSCI’s index of Asia-Pacific stocks outside Japan is up 0.02% to 708.89 levels. The Australian index was lower by 0.12% to 7,822.50. Japanese Nikkei Index decrease 0.07% today.
European stocks were positive on Friday, with the Stoxx Europe 50 Index increase 0.48% to 5,011.55, Germany’s DAX ascend 0.60% to 18,564.85, and France’s CAC higher 0.31% to 7,719.30 and U.K.’s FTSE 100 gain 0.34% to 8,269.54.
Benchmark 10-year U.S. Treasury rose as demand for safe assets slipped again, today 10-year bond yields increase 0.28% to 4.3560.
Oil prices dipped on Friday but were on track for a fourth straight week of gains and were near their highest levels since late April on hopes of strong summer fuel demand and some supply concerns.
Spot Brent crude oil increase 0.14% to $87.55 per barrel. US West Texas Intermediate crude is increase 0.10% to $84.14 a barrel.
The yellow metal gold is up 0.25% to 2,371.30 dollars per ounce.
Market Wrap: Forex
The U.S. dollar slipped lower in early European trade Friday as weak economic data raised expectations of interest rate cuts by the Federal Reserve, while sterling edged higher as the U.K. went to the polls.
Today, the U.S. dollar index measures the Greenback against a trade-weighted basket of six major currencies, which descend 0.10% to 104.020.
The Euro US Dollar (EUR/USD) is a widely traded pair that is increase 0.13% today. This left the pair trading around $1.08250.
The Japanese yen was negative against the U.S. dollar on Friday. Today USD/JPY is trades pair that decreases 0.27% to the 160.810 level.
Another commodity-related currency Mixed against the U.S dollar, AUD/USD increase 0.08% to 0.67330, and NZD/USD decrease 0.02% to 0.61160 level.
EUR/USD Intraday: Major trend on the upside
Our pivot point is at 1.08160
Preferable Price Action: Take buy positions above pivot level with targets at 1.08430 & 1.08660 in extension.
Alternative Price Action: Sell pivot looks for a further downside to 1.07880 & 1.07670.
Comment: RSI is above 50 levels and pairs are above its 20MA & 55MA.
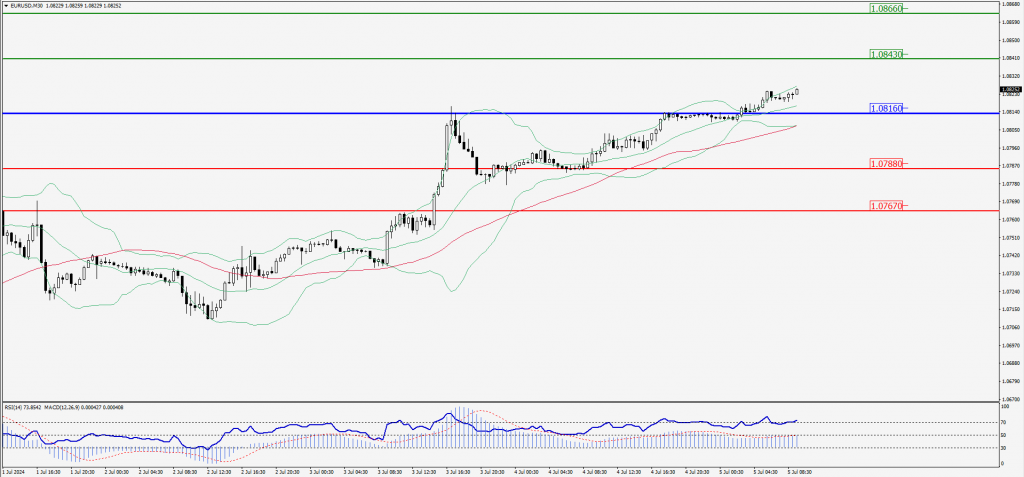
Green Lines Indicate Resistance Levels – Red Lines Indicate Support Levels
Light Blue is a Pivot Point – Black represents the price when the report was produced
GBP/USD Intraday: Trend on the upside
Our pivot point is at 1.27660
Preferable Price Action: Buy positions above pivot with targets at 1.27950 & 1.28180 in extension.
Alternative Price Action: The price below pivot would call for further downside to 1.27350 & 1.27120.
Comment: RSI is above 50 levels and pairs are above its 20MA & 55MA.
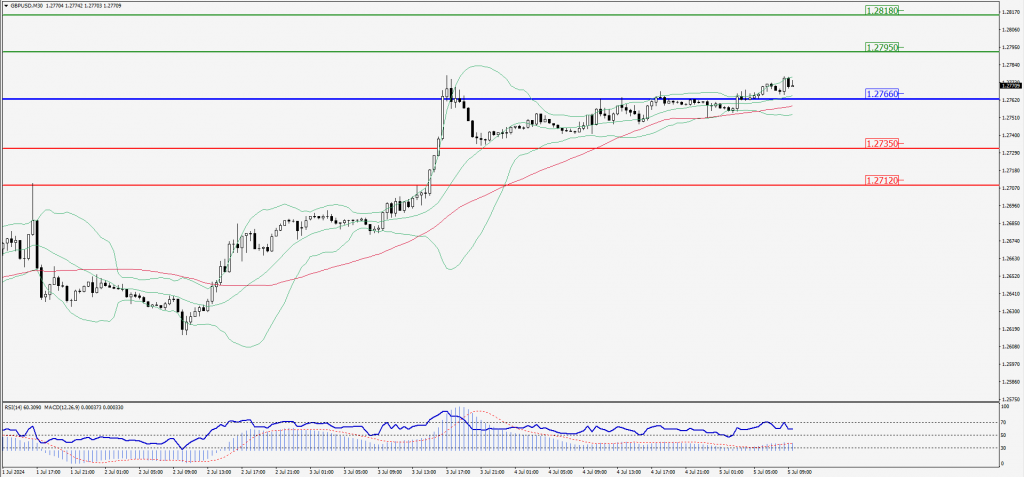
Green Lines Indicate Resistance Levels – Red Lines Indicate Support Levels
Light Blue is a Pivot Point – Black represents the price when the report was produced
USD/JPY Intraday: Trend on the downside
Our pivot point is at 160.880
Preferable Price Action: Sell position below pivot with the target at 160.550 and 160.270 in extension.
Alternative Price Action: The upside breakout of the pivot would call for 161.180 and 162.440.
Comment: MACD is below 50 levels and Pairs below its 20MA & 55MA.

Green Lines Indicate Resistance Levels – Red Lines Indicate Support Levels
Light Blue is a Pivot Point – Black represents the price when the report was produced
AUD/USD Intraday: Trend on the downside
Our pivot point is at 0.67130
Preferable Price Action: Sell positions below pivot with targets at 0.67170 & 0.66990 in extension.
Alternative Price Action: Above pivot a further upside with 0.67550 & 0.67720 as targets.
Comment: RSI is below 50 levels and pairs below its 55MA.
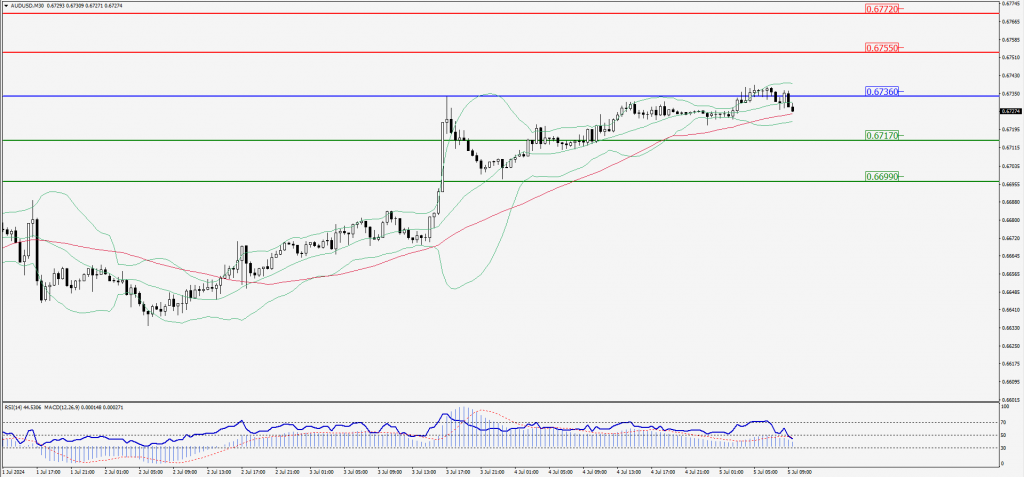
Green Lines Indicate Resistance Levels – Red Lines Indicate Support Levels
Light Blue is a Pivot Point – Black represents the price when the report was produced
CRUDEOIL Intraday: Registrant level at 82.38
Our pivot point is at 82.38
Preferable Price Action: Below pivot sell oil with 82.76 & 82.23 as targets.
Alternative Price Action: Buy crude above pivot with targets at 84.01 and 84.53 in extension.
Comment: RSI is below 50 levels and pairs below its 20MA.
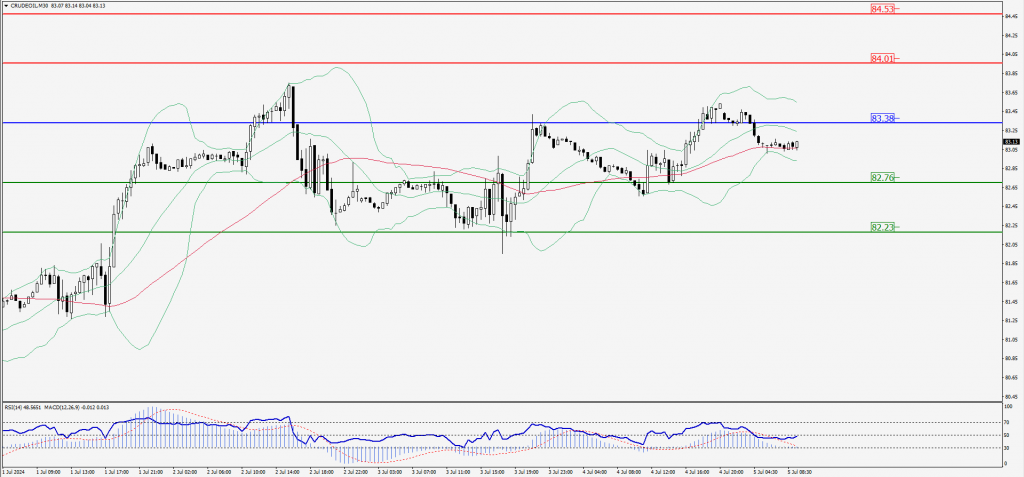
Green Lines Indicate Resistance Levels – Red Lines Indicate Support Levels
Light Blue is a Pivot Point – Black represents the price when the report was produced
XAU/USD Intraday: Trend on the upside
Our pivot point is 2362.40
Preferable Price Action: Further upside to 2370.70 and 2377.60.
Alternative Price Action: If the price gives an downside breakout of a pivot, then the price extends to 2353.70 and 2346.90.
Comment: MACD is above 50 levels and Pairs above its 20MA & 55MA.
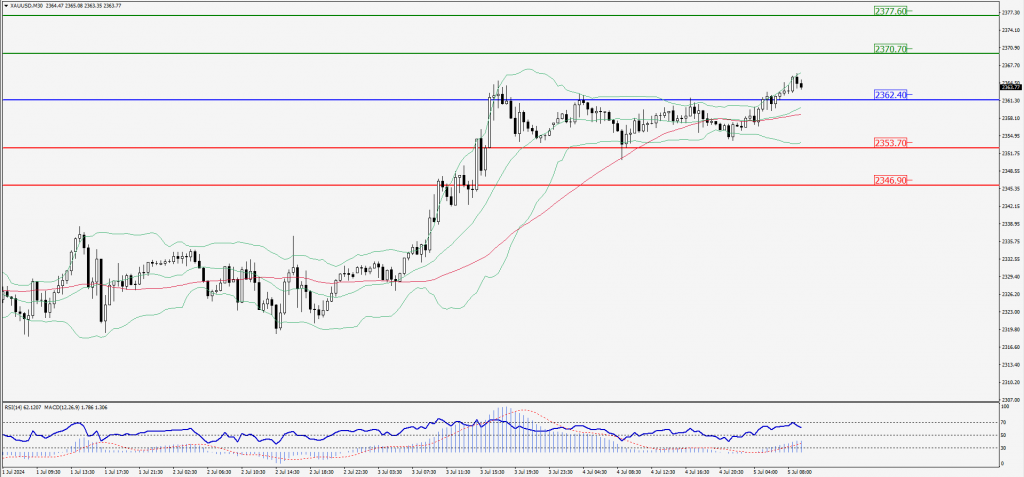
Green Lines Indicate Resistance Levels – Red Lines Indicate Support Levels
Light Blue is a Pivot Point – Black represents the price when the report was produced
Dow Jones Intraday: Trend on the upside
Our pivot point is 39,401.60
Preferable Price Action: Take buy positions above the pivot with targets at 39,502.80 & 39,587.90.
Alternative Price Action: Below 39,401.60 looks for further downside to 39,290.40 & 39,199.30.
Comment: RSI is above 50 levels and pairs above its 20MA & 55MA.
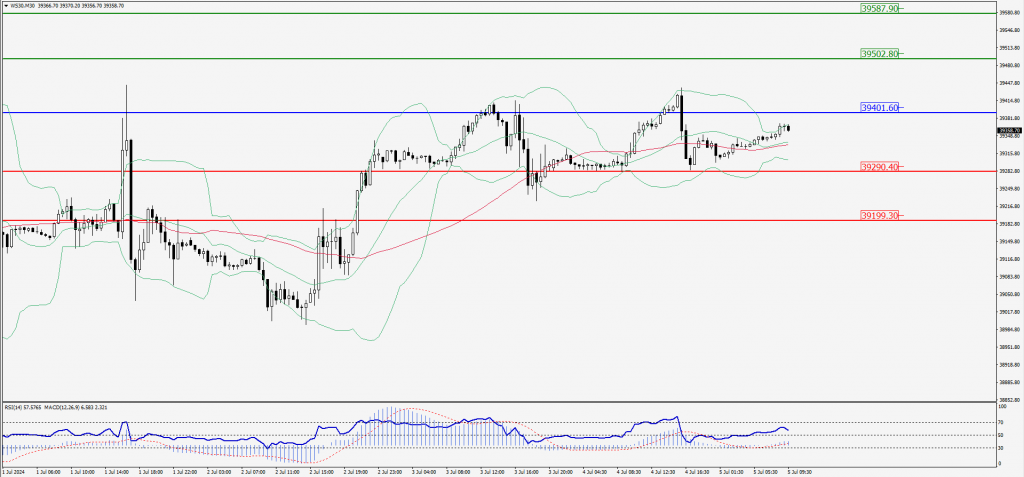
Green Lines Indicate Resistance Levels – Red Lines Indicate Support Levels
Light Blue is a Pivot Point – Black represents the price when the report was produced