Market Wrap: Stocks, Bonds, Commodities
Asia shares slipped on Monday in a countdown for U.S. price data that investors are banking on to show a renewed moderation in inflation, while markets were on alert for Japanese intervention as the dollar tested the 160 yen barrier.
The Dow Jones Industrial Average rose 15.57 points to 39,150.33, the S&P 500 loss 0.16% to 5,464.62 and the Nasdaq Composite descend 28.21 points to 17,693.38.
MSCI’s index of Asia-Pacific stocks outside Japan is below 0.72% to 693.42 levels. The Australian index was lower by 0.80% to 7,733.70. Japanese Nikkei Index increase 0.56% today.
European stocks were positive on Monday, with the Stoxx Europe 50 Index increase 0.16% to 4,915.35, Germany’s DAX ascend 0.04% to 18,192.05, and France’s CAC higher 0.09% to 7,635.79 and U.K.’s FTSE 100 loss 0.12% to 8,227.50.
Benchmark 10-year U.S. Treasury rose as demand for safe assets slipped again, today 10-year bond yields decrease 0.19% to 4.2500.
Oil prices inched down on Monday as concerns of higher-for-longer interest rates resurfaced and lifted the dollar, offsetting support for oil markets from geopolitical tensions and OPEC+ supply cuts.
Spot Brent crude oil either up or down 0.02% to $84.33 per barrel. US West Texas Intermediate crude is decrease 0.06% to $80.68 a barrel.
The yellow metal gold is up 0.38% to 2,340.00 dollars per ounce.
Market Wrap: Forex
The Japanese yen was fragile on Monday, with the USDJPY pair nearing key intervention levels even as government officials reiterated warnings that they would step in to support the currency.
Today, the U.S. dollar index measures the Greenback against a trade-weighted basket of six major currencies, which descend 0.04% to 105.402.
The Euro US Dollar (EUR/USD) is a widely traded pair that is increase 0.12% today. This left the pair trading around $1.07040.
The Japanese yen was negative against the U.S. dollar on Monday. Today USD/JPY is trades pair that increases 0.02% to the 159.750 level.
Another commodity-related currency mixed against the U.S dollar, AUD/USD increase 0.12% to 0.66470, and NZD/USD descend 0.03% to 0.61160 level.
EUR/USD Intraday: Trend on the upside
Our pivot point is at 1.07040
Preferable Price Action: Take buy positions above pivot level with targets at 1.07160 & 1.07250 in extension.
Alternative Price Action: Sell pivot looks for a further downside to 1.06920 & 1.06820.
Comment: RSI is above 50 levels and pairs are above its 20MA & 55MA.
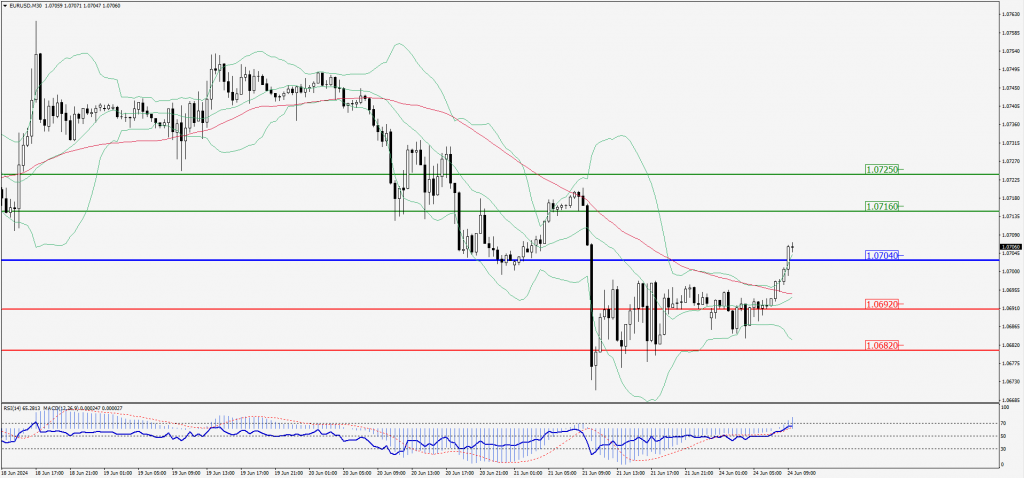
Green Lines Indicate Resistance Levels – Red Lines Indicate Support Levels
Light Blue is a Pivot Point – Black represents the price when the report was produced
GBP/USD Intraday: Trend on the upside
Our pivot point is at 1.26470
Preferable Price Action: Buy positions above pivot with targets at 1.26620 & 1.26760 in extension.
Alternative Price Action: The price below pivot would call for further downside to 1.26320 & 1.26200.
Comment: RSI is above 50 levels and pairs are above its 20MA & 55MA.
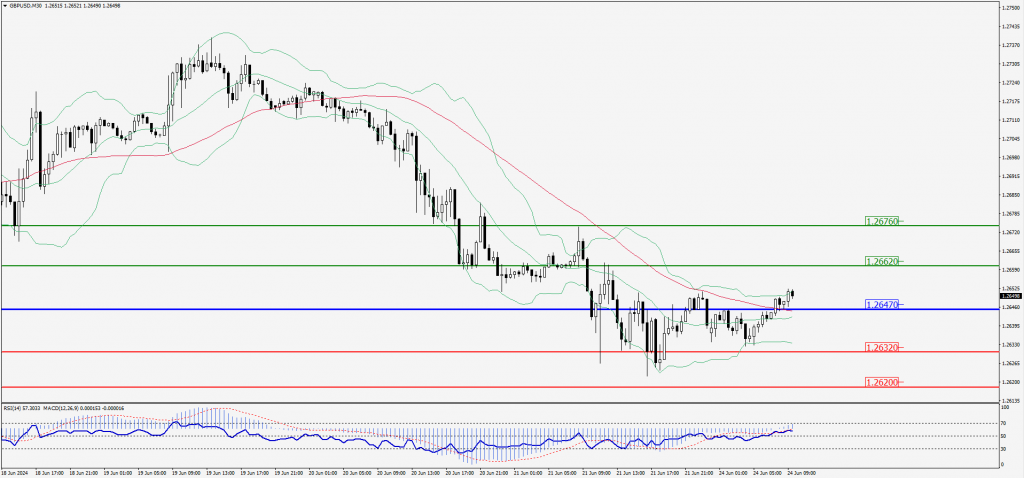
Green Lines Indicate Resistance Levels – Red Lines Indicate Support Levels
Light Blue is a Pivot Point – Black represents the price when the report was produced
USD/JPY Intraday: Trend on the upside
Our pivot point is at 159.630
Preferable Price Action: Buy position above pivot with the target at 159.930 and 160.180 in extension.
Alternative Price Action: The downside breakout of the pivot would call for 159.330 and 159.110.
Comment: MACD is above 50 levels and pairs above its 55MA.
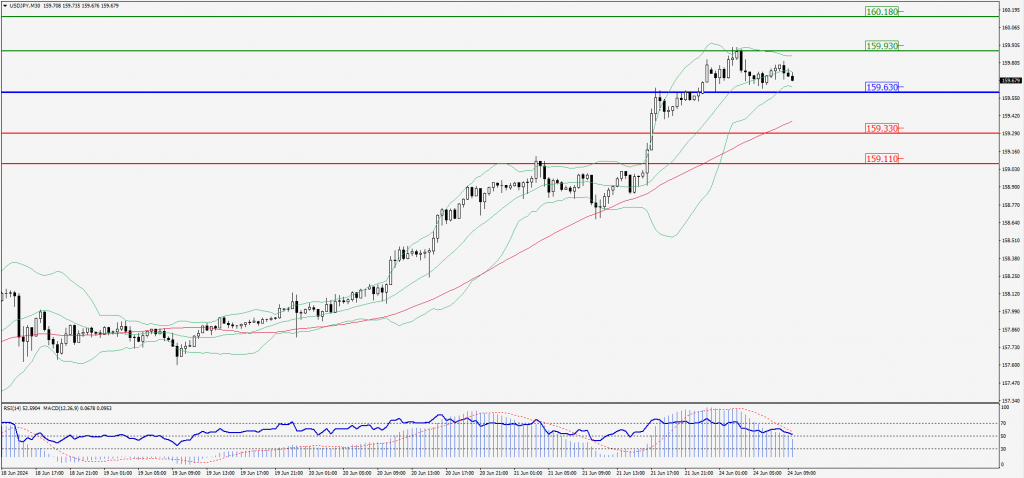
Green Lines Indicate Resistance Levels – Red Lines Indicate Support Levels
Light Blue is a Pivot Point – Black represents the price when the report was produced
AUD/USD Intraday: Trend on the upside
Our pivot point is at 0.66420
Preferable Price Action: Buy positions above pivot with targets at 0.66510 & 0.66590 in extension.
Alternative Price Action: Below pivot a further downside with 0.66330 & 0.66260 as targets.
Comment: RSI is above 50 levels and pairs above its 20MA.
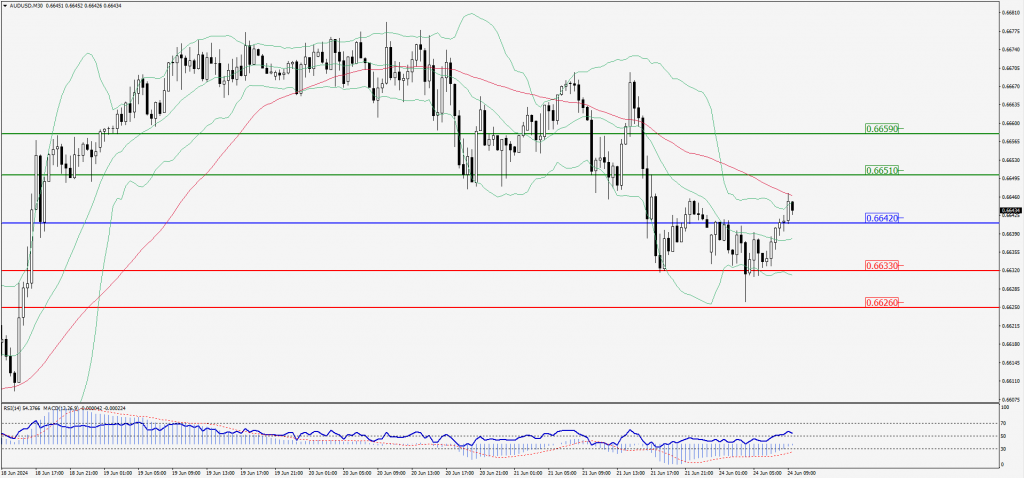
Green Lines Indicate Resistance Levels – Red Lines Indicate Support Levels
Light Blue is a Pivot Point – Black represents the price when the report was produced
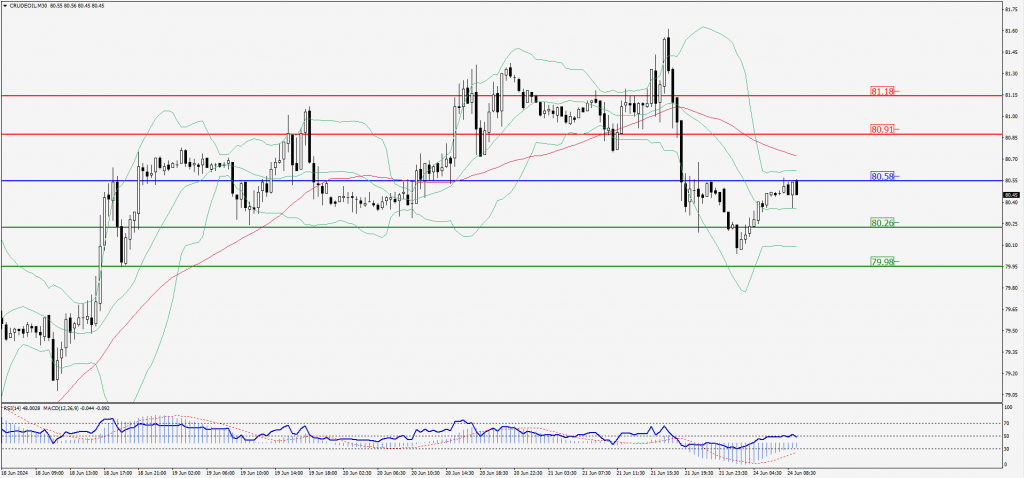
CRUDEOIL Intraday: Trend on the downside
Our pivot point is at 80.58
Preferable Price Action: Below pivot sell oil with 80.26 & 79.98 as targets.
Alternative Price Action: Buy crude above pivot with targets at 80.91 and 81.18 in extension.
Comment: RSI is below 50 levels and pairs below its 55MA.
Green Lines Indicate Resistance Levels – Red Lines Indicate Support Levels
Light Blue is a Pivot Point – Black represents the price when the report was produced
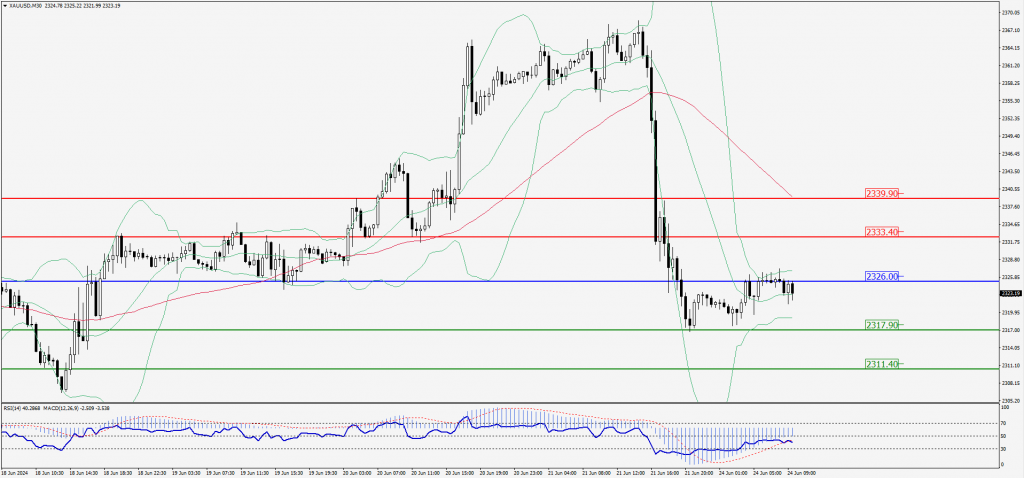
XAU/USD Intraday: Trend on the downside
Our pivot point is 2326.00
Preferable Price Action: Further downside to 2317.90 and 2311.40.
Alternative Price Action: If the price gives an upside breakout of a pivot, then the price extends to 2333.40 and 2339.90.
Comment: MACD is below 50 levels and Paris below its 55MA.
Green Lines Indicate Resistance Levels – Red Lines Indicate Support Levels
Light Blue is a Pivot Point – Black represents the price when the report was produced
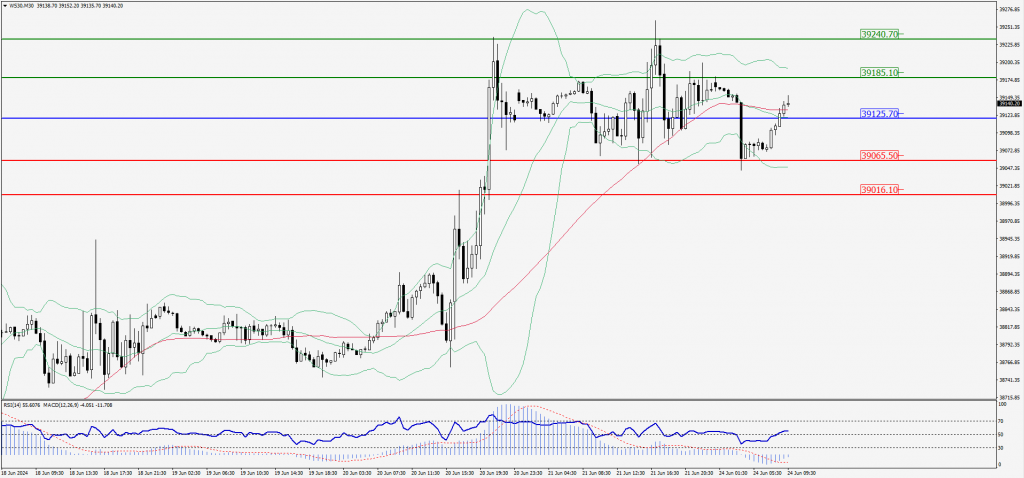
Dow Jones Intraday: Support level at 39,125.70
Our pivot point is 39,125.70
Preferable Price Action: Take buy positions above the pivot with targets at 39,185.10 & 39,240.70.
Alternative Price Action: Below 39,125.70 looks for further downside to 39,065.50 & 39,016.10.
Comment: RSI is above 50 levels and pairs above its 20MA & 55MA.
Green Lines Indicate Resistance Levels – Red Lines Indicate Support Levels
Light Blue is a Pivot Point – Black represents the price when the report was produced