Market Wrap: Stocks, Bonds, Commodities
The dollar held firm on Monday, while the euro traded around more than one-month lows, as political turmoil in Europe ramped up the level of uncertainty among traders, while investors awaited more data to gauge the strength of the U.S. economy.
The Dow Jones Industrial Average fell 57.94 points to 38,589.16, the S&P 500 loss 0.04% to 5,431.60 and the Nasdaq Composite ascend 25.87 points to 17,693.43.
MSCI’s index of Asia-Pacific stocks outside Japan is below 0.22% to 692.47 levels. The Australian index was lower by 0.31% to 7,700.30. Japanese Nikkei Index decrease 2.01% today.
European stocks were positive on Monday, with the Stoxx Europe 50 Index increase 0.81% to 4,878.25, Germany’s DAX ascend 0.39% to 18,091.35, and France’s CAC higher 0.50% to 7,540.77 and U.K.’s FTSE 100 gain 0.14% to 8,158.50.
Benchmark 10-year U.S. Treasury rose as demand for safe assets slipped again, today 10-year bond yields increase 0.67% to 4.2390.
Oil was steady on Monday after Chinese economic data underscoring a bumpy recovery for the world’s biggest crude importer offset hopes for a boost to demand from the summer driving season in the northern hemisphere.
Spot Brent crude oil up 0.25% to $82.83 per barrel. US West Texas Intermediate crude is up 0.26% to $78.25 a barrel.
The yellow metal gold is decrease 0.67% to 2,333.35 dollars per ounce.
Market Wrap: Forex
The dollar gained on Monday despite a soft U.S. producer price inflation report for May, after the Federal Reserve adopted a hawkish tone at the conclusion of its meeting on Monday.
Today, the U.S. dollar index measures the Greenback against a trade-weighted basket of six major currencies, which ascend 0.01% to 105.175.
The Euro US Dollar (EUR/USD) is a widely traded pair that is increase 0.08% today. This left the pair trading around $1.07090.
The Japanese yen was positive against the U.S. dollar on Monday. Today USD/JPY is trades pair that increases 0.16% to the 157.620 level.
Another commodity-related currency negative against the U.S dollar, AUD/USD slipped 0.12% to 0.66060 , and NZD/USD descend 0.39% to 0.61180 level.
EUR/USD Intraday: Trend on the downside
Our pivot point is at 1.07160
Preferable Price Action: Take sell positions below pivot level with targets at 1.06660 & 1.06240 in extension.
Alternative Price Action: Buy pivot looks for a further upside to 1.07680 & 1.08150.
Comment: RSI is below 50 levels.
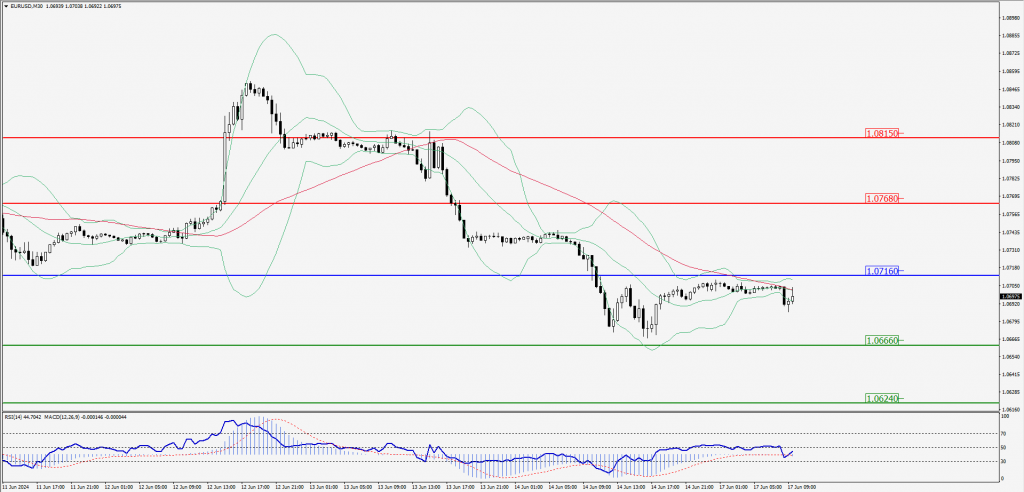
Green Lines Indicate Resistance Levels – Red Lines Indicate Support Levels
Light Blue is a Pivot Point – Black represents the price when the report was produced
GBP/USD Intraday: Resistance level at 1.26970
Our pivot point is at 1.26970
Preferable Price Action: Sell positions below pivot with targets at 1.26340 & 1.25820 in extension.
Alternative Price Action: The price above pivot would call for further upside to 1.27640 & 1.28190.
Comment: RSI is below 50 levels and pairs are below its 55MA & 20MA.
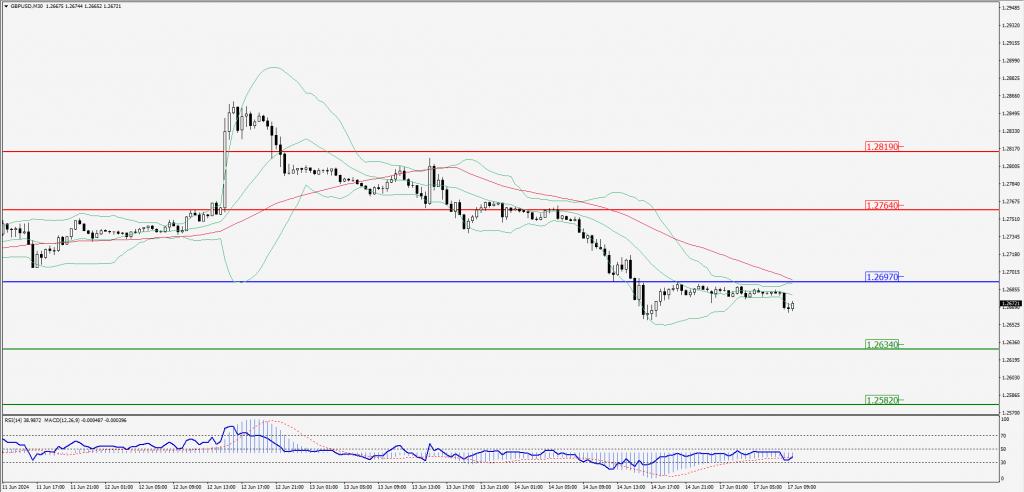
Green Lines Indicate Resistance Levels – Red Lines Indicate Support Levels
Light Blue is a Pivot Point – Black represents the price when the report was produced
USD/JPY Intraday: Trend on the downside
Our pivot point is at 157.650
Preferable Price Action: Sell position below pivot with the target at 156.830 and 156.030 in extension.
Alternative Price Action: The upside breakout of the pivot would call for 158.480 and 159.260.
Comment: MACD is below 50 levels.
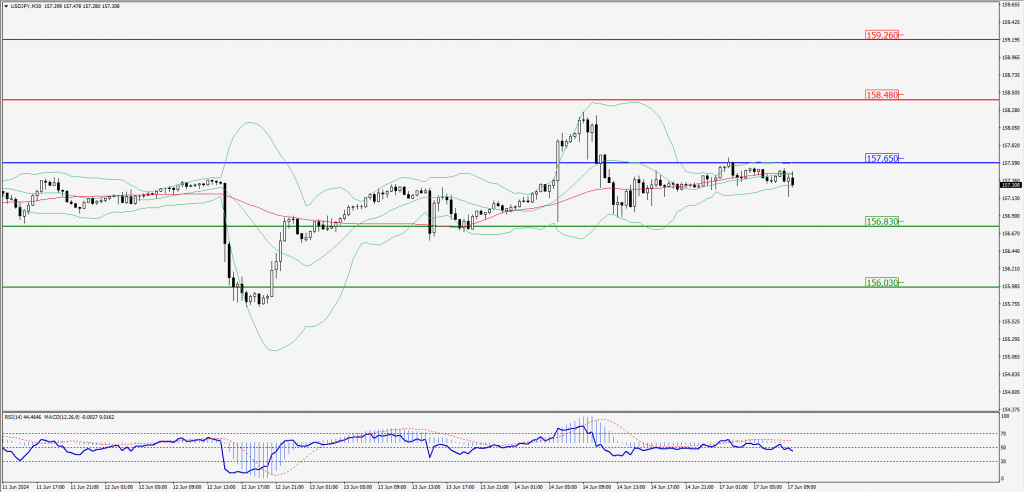
Green Lines Indicate Resistance Levels – Red Lines Indicate Support Levels
Light Blue is a Pivot Point – Black represents the price when the report was produced
AUD/USD Intraday: Trend on the downside
Our pivot point is at 0.66070
Preferable Price Action: Sell positions below pivot with targets at 0.65730 & 0.65440 in extension.
Alternative Price Action: Above pivot a further upside with 0.66400 & 0.66710 as targets.
Comment: RSI is below 50 levels and pairs below its 55MA & 20MA.
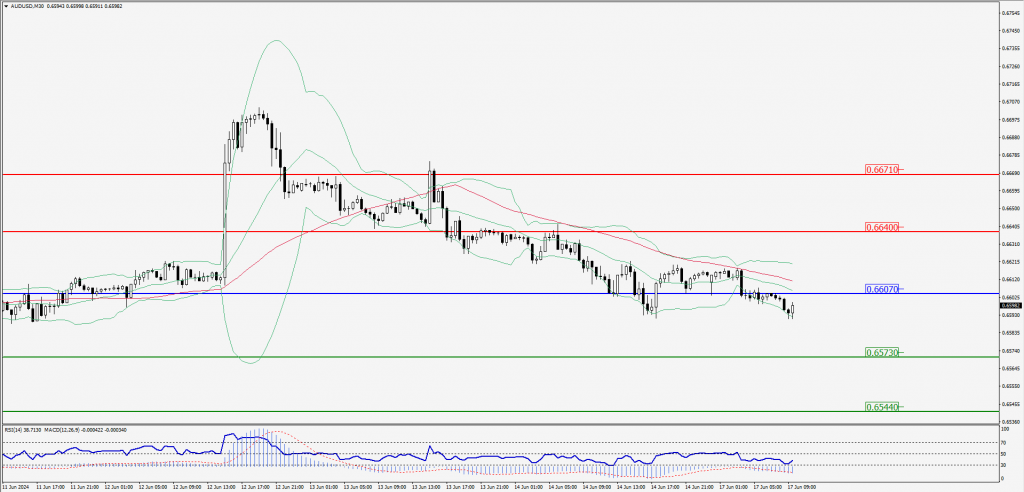
Green Lines Indicate Resistance Levels – Red Lines Indicate Support Levels
Light Blue is a Pivot Point – Black represents the price when the report was produced
CRUDEOIL Intraday: Trend on the downside
Our pivot point is at 77.92
Preferable Price Action: Below pivot sell oil with 77.14 & 76.45 as targets.
Alternative Price Action: Buy crude above pivot with targets at 78.73 and 79.45 in extension.
Comment: RSI is below 50 levels and Pairs below its 55MA.
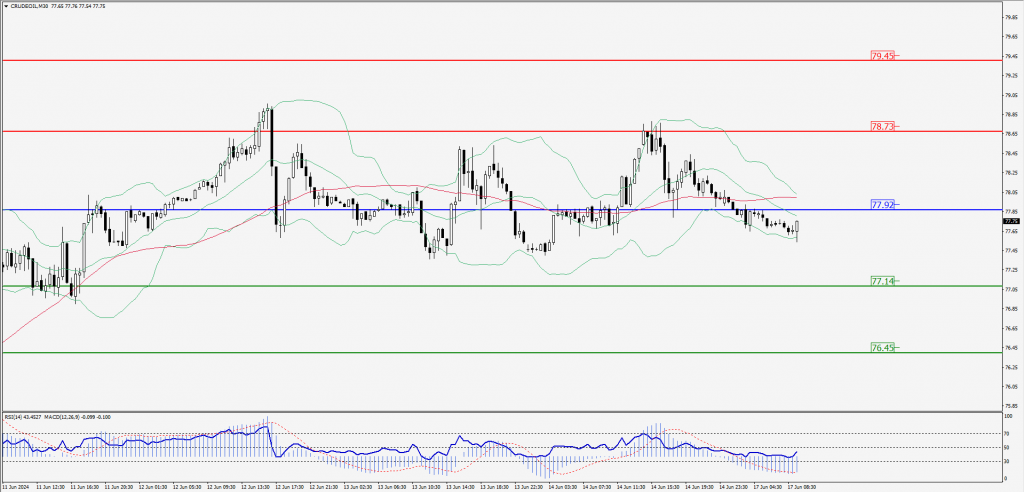
Green Lines Indicate Resistance Levels – Red Lines Indicate Support Levels
Light Blue is a Pivot Point – Black represents the price when the report was produced
XAU/USD Intraday: Trend on the downside
Our pivot point is 2324.60
Preferable Price Action: Further downside to 2308.00 and 2291.30.
Alternative Price Action: If the price gives an upside breakout of a pivot, then the price extends to 2341.90 and 2358.40.
Comment: MACD is below 50 levels and Pairs below its 20MA & 55MA.
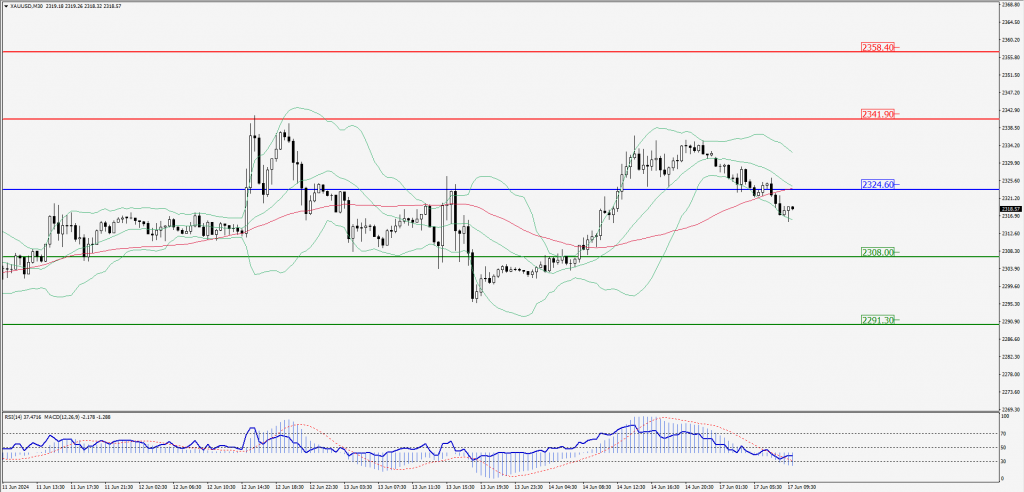
Green Lines Indicate Resistance Levels – Red Lines Indicate Support Levels
Light Blue is a Pivot Point – Black represents the price when the report was produced
Dow Jones Intraday: Support level at 38,516.90
Our pivot point is 38,516.90
Preferable Price Action: Take buy positions above the pivot with targets at 38,724.30 & 38,870.80.
Alternative Price Action: Below 38,516.90 looks for further downside to 38,408.70 & 38,270.10.
Comment: RSI is above 50 levels and pairs above its 20MA & 55MA.
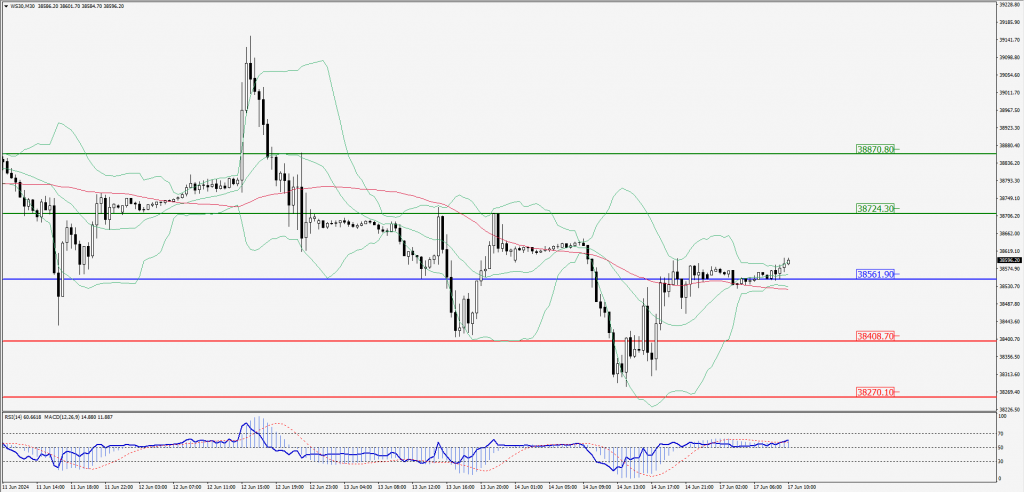
Green Lines Indicate Resistance Levels – Red Lines Indicate Support Levels
Light Blue is a Pivot Point – Black represents the price when the report was produced