Market Wrap: Stocks, Bonds, Commodities
Most European and Asian currencies were treading water on Monday, while the dollar steadied in thin trade, as markets awaited more cues on U.S. interest rates from key inflation data later in the week.
The Dow Jones Industrial Average rose 4.33 points to 39,069.59, the S&P 500 gain 0.70% to 5,304.72 and the Nasdaq Composite ascend 184.76 points to 16,920.79.
MSCI’s index of Asia-Pacific stocks outside Japan is above 1.03% to 698.52 levels. The Australian index was higher by 0.79% to 7,788.30. Japanese Nikkei Index increase 0.74% today.
European stocks were mixed on Monday, with the Stoxx Europe 50 Index increase 0.11% to 5,040.85, Germany’s DAX ascend 0.12% to 18,715.95, and France’s CAC higher 0.17% to 8,108.43 and U.K.’s FTSE 100 loss 0.26% to 8,317.59.
Benchmark 10-year U.S. Treasury rose as demand for safe assets slipped again, today 10-year bond yields decrease 0.11% to 4.4680.
Oil prices steadied in Asian trading on Monday as markets awaited an OPEC+ meeting on June 2 where producers are expected to discuss maintaining voluntary output cuts for the rest of the year.
Spot Brent crude oil ascend 0.33% to $82.11 per barrel. US West Texas Intermediate crude is up 0.32% to $77.97 a barrel.
The yellow metal gold is increase 1.43% to 2,367.80 dollars per ounce.
Market Wrap: Forex
The dollar made a steady start to the week on Monday, as investors were focused on U.S., European and Japanese inflation data to guide the global interest rate outlook.
Today, the U.S. dollar index measures the Greenback against a trade-weighted basket of six major currencies, which descend 0.04% to 104.600.
The Euro US Dollar (EUR/USD) is a widely traded pair that is increase 0.07% today. This left the pair trading around $1.08530.
The Japanese yen was negative against the U.S. dollar on Monday. Today USD/JPY is lower 0.07% to the 156.88 level.
Another commodity-related currency positive against the U.S dollar, AUD/USD surged 0.21% to 0.66410, and NZD/USD ascend 0.25% to 0.61350 level.
EUR/USD Intraday: Trend on the upside
Our pivot point is at 1.08460
Preferable Price Action: Take buy positions above pivot level with targets at 1.08640 & 1.08770 in extension.
Alternative Price Action: Sell pivot looks for a further downside to 1.08270 & 1.08130.
Comment: RSI is above 50 levels and pairs are above its 55MA.
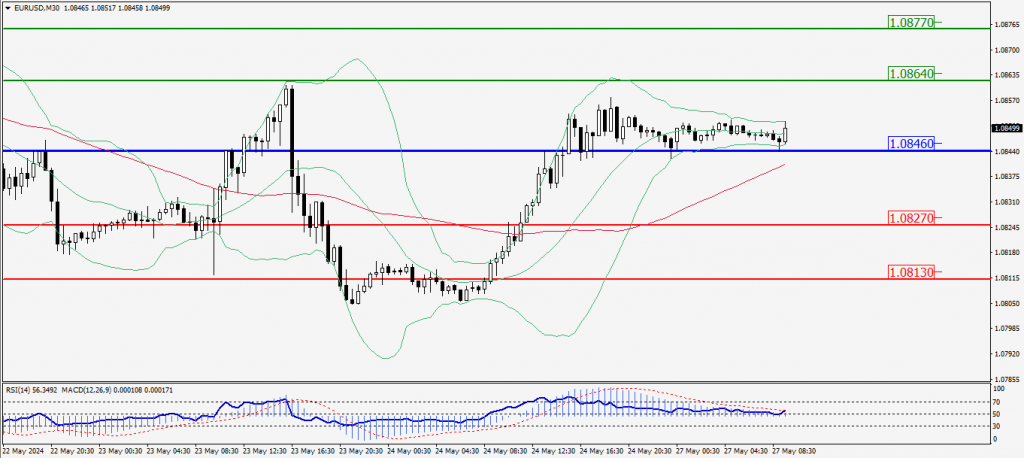
Green Lines Indicate Resistance Levels – Red Lines Indicate Support Levels
Light Blue is a Pivot Point – Black represents the price when the report was produced
GBP/USD Intraday: Trend on the upside
Our pivot point is at 1.27350
Preferable Price Action: Buy positions above pivot with targets at 1.27600 & 1.27760 in extension.
Alternative Price Action: The price below pivot would call for further downside to 1.27110 & 1.26940.
Comment: RSI is above 50 levels and pairs are above its 20MA & 55MA.
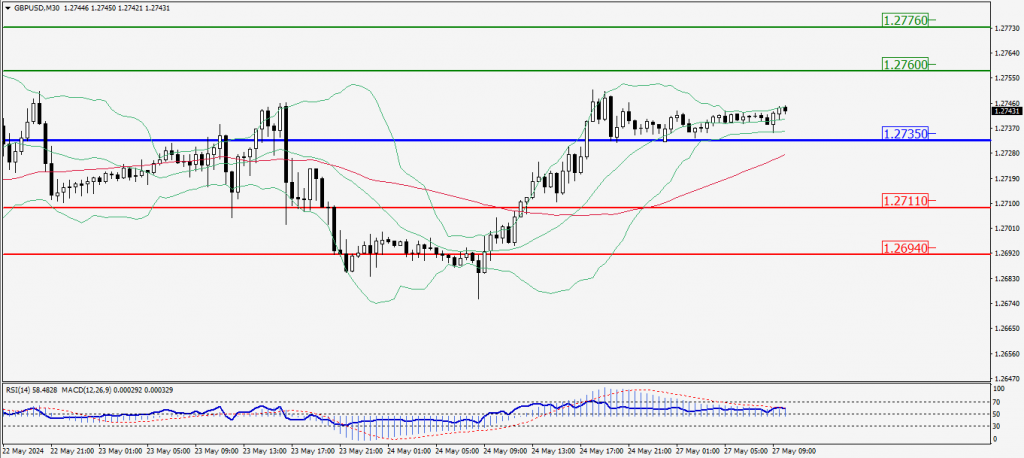
Green Lines Indicate Resistance Levels – Red Lines Indicate Support Levels
Light Blue is a Pivot Point – Black represents the price when the report was produced
USD/JPY Intraday: Trend on the upside
Our pivot point is at 156.830
Preferable Price Action: Buy position above pivot with the target at 157.040 and 157.160 in extension.
Alternative Price Action: The downside breakout of the pivot would call for 156.620 and 156.480.
Comment: MACD is above 50 levels and pairs above its 55MA.
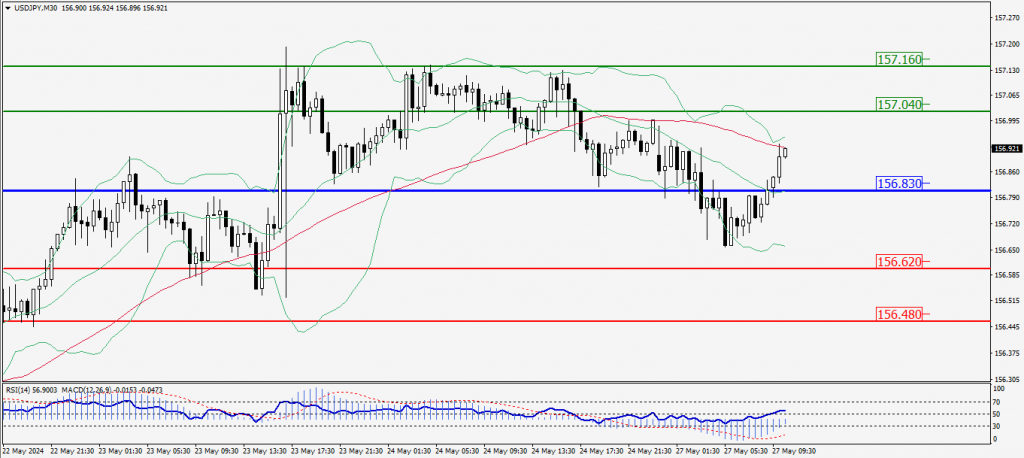
Green Lines Indicate Resistance Levels – Red Lines Indicate Support Levels
Light Blue is a Pivot Point – Black represents the price when the report was produced
AUD/USD Intraday: Trend on the upside
Our pivot point is at 0.66350
Preferable Price Action: Buy positions above pivot with targets at 0.65510 & 0.66620 in extension.
Alternative Price Action: Below pivot looks for a further downside with 0.66190 & 0.66060 as targets.
Comment: RSI is above 50 levels and pairs above its 20MA & 55MA.
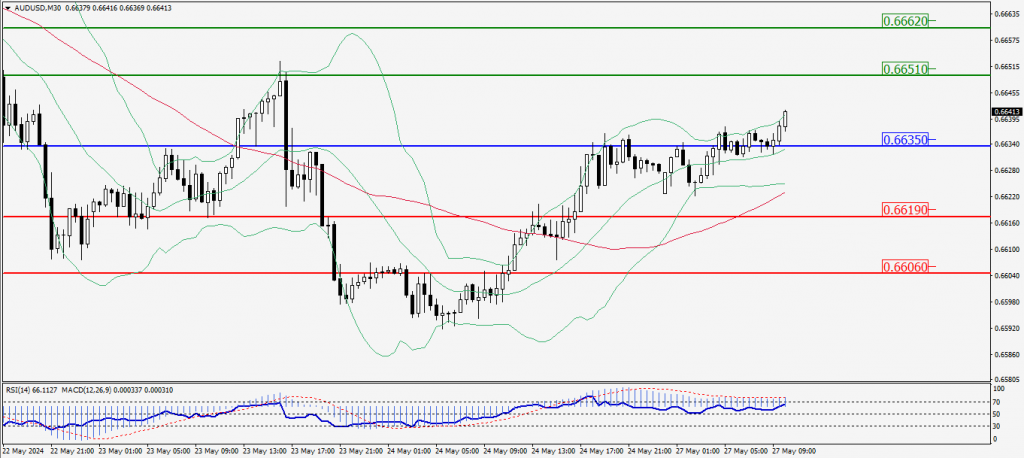
Green Lines Indicate Resistance Levels – Red Lines Indicate Support Levels
Light Blue is a Pivot Point – Black represents the price when the report was produced
CRUDEOIL Intraday: Trend on the upside
Our pivot point is at 77.57
Preferable Price Action: Above pivot buy oil with 78.15 & 78.58 as targets.
Alternative Price Action: Sell crude below pivot with targets at 76.99 and 76.56 in extension.
Comment: MACD is positive territory and pairs Above its 55MA.
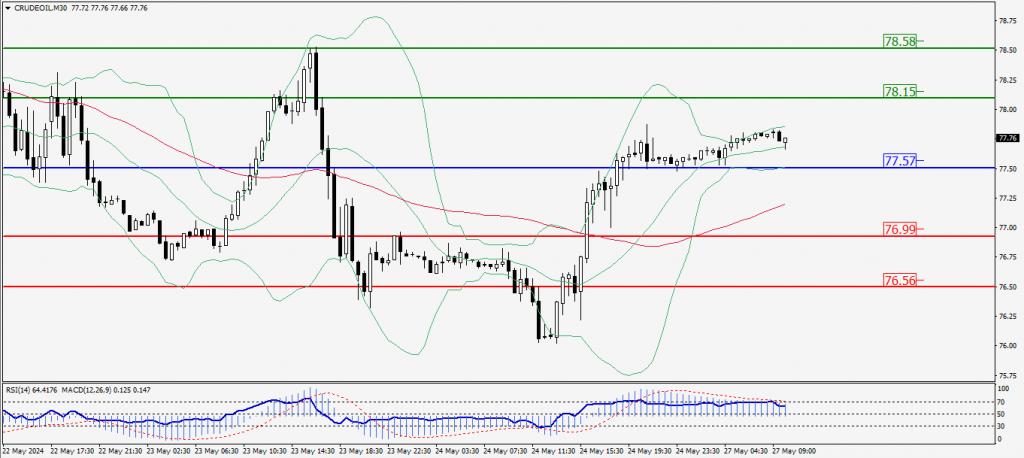
Green Lines Indicate Resistance Levels – Red Lines Indicate Support Levels
Light Blue is a Pivot Point – Black represents the price when the report was produced
XAU/USD Intraday: In consolidation state at 2336.10
Our pivot point is 2336.10
Preferable Price Action: Further upside to 2356.30 and 2373.40.
Alternative Price Action: If the price gives a downside breakout of a pivot, then the price extends to 2313.90 and 2296.80.
Comment: MACD is at 50 levels and pairs above its 55MA.
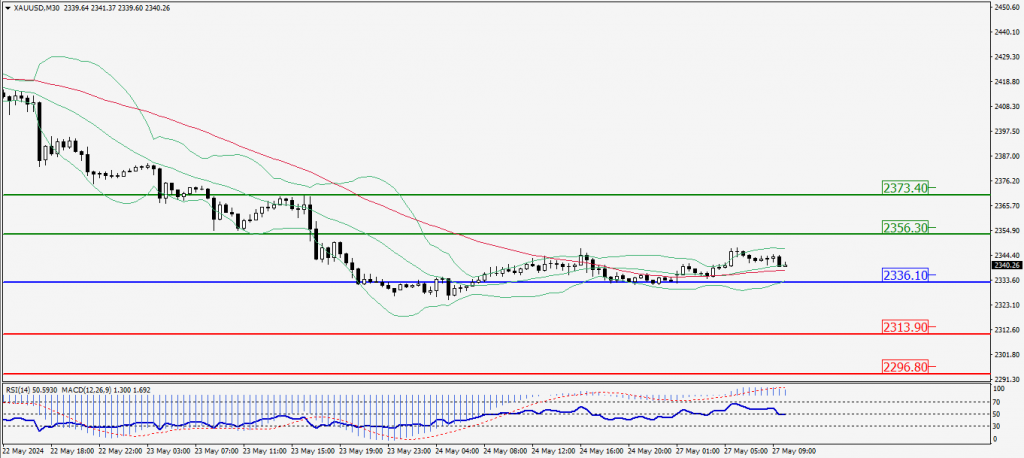
Green Lines Indicate Resistance Levels – Red Lines Indicate Support Levels
Light Blue is a Pivot Point – Black represents the price when the report was produced
Dow Jones Intraday: Trend on the downside
Our pivot point is 39,143.00
Preferable Price Action: Take sell positions below the pivot with targets at 38,917.10 & 38,747.70.
Alternative Price Action: Above 39,143.00 looks for further upside to 39,360.80 & 39,539.50.
Comment: RSI is below 50 levels and pairs below its 55MA.
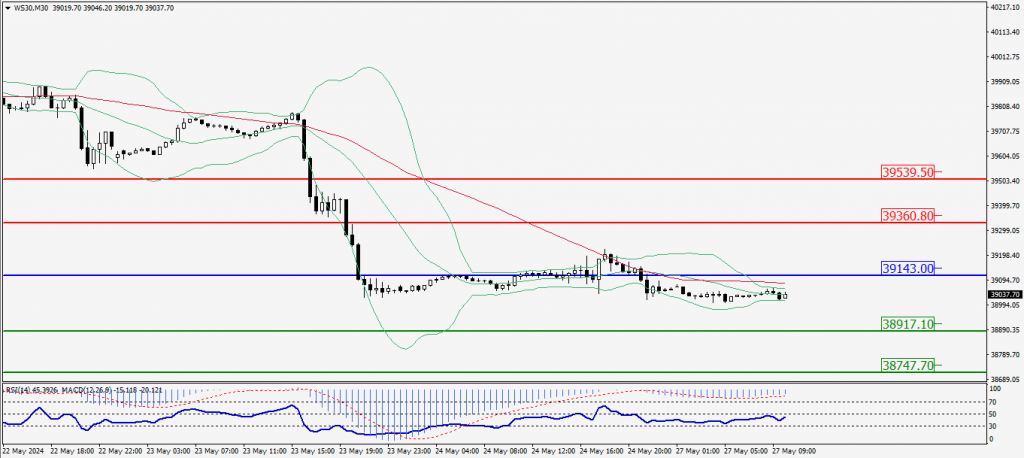
Green Lines Indicate Resistance Levels – Red Lines Indicate Support Levels
Light Blue is a Pivot Point – Black represents the price when the report was produced