Market Wrap: Stocks, Bonds, Commodities
The dollar hovered near a one-week high on Thursday after its biggest daily percentage gain this month against a basket of peers a day before as minutes of the last Fed meeting revealed a willingness to raise interest rates among some officials,
The Dow Jones Industrial Average fell 201.95 points to 39,671.04, the S&P 500 loos 0.27% to 5,307.01 and the Nasdaq Composite drop 31.08 points to 16,801.54.
MSCI’s index of Asia-Pacific stocks outside Japan is below 0.24% to 697.38 levels. The Australian index was low by 0.46% to 7,811.80. Japanese Nikkei Index increase 1.28% today.
European stocks were mixed on Thursday, with the Stoxx Europe 50 Index increase 0.30% to 5,040.35, Germany’s DAX ascend 0.04% to 18,689.65, and France’s CAC higher 0.07% to 8,098.04 and U.K.’s FTSE 100 loss 0.15% to 8,357.70.
Benchmark 10-year U.S. Treasury rose as demand for safe assets slipped again, today 10-year bond yields increase 0.16% to 4.4420.
Oil prices eased for a fourth straight session on Thursday after the minutes of a U.S. Federal Reserve meeting revealed discussions of a further tightening of interest rates if inflation remained sticky, a move that could hurt oil demand.
Spot Brent crude oil ascend 0.18% to $82.05 per barrel. US West Texas Intermediate crude is up 0.13% to $77.67 a barrel.
The yellow metal gold is decrease 1.23% to 2,363.40 dollars per ounce.
Market Wrap: Forex
The U.S. dollar handed back some of the previous session’s gains Thursday, but remained near a one-week high after the release of hawkish minutes from the last Federal Reserve meeting suggested U.S. interest rates would remain elevated for some time.
Today, the U.S. dollar index measures the Greenback against a trade-weighted basket of six major currencies, which descend 0.12% to 104.705.
The Euro US Dollar (EUR/USD) is a widely traded pair that is increase 0.19% today. This left the pair trading around $1.08420.
The Japanese yen was positive against the U.S. dollar on Thursday. Today USD/JPY is lower 0.02% to the 156.750 level.
Another commodity-related currency positive against the U.S dollar, AUD/USD surged 0.14% to 0.66270, and NZD/USD ascend 0.31% to 0.61150 level.
EUR/USD Intraday: Trend on the downside
Our pivot point is at 1.08320
Preferable Price Action: Take sell positions below pivot level with targets at 1.08200 & 1.08110 in extension.
Alternative Price Action: Buy pivot looks for a further upside to 1.08430 & 1.08530.
Comment: RSI is below 50 levels and pairs are below its 55MA.
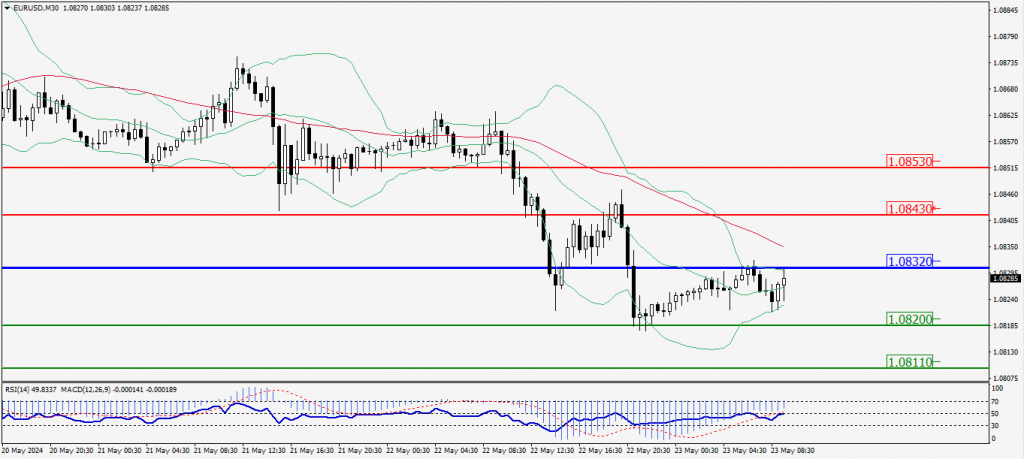
Green Lines Indicate Resistance Levels – Red Lines Indicate Support Levels
Light Blue is a Pivot Point – Black represents the price when the report was produced
GBP/USD Intraday: Support level at 1.27200
Our pivot point is at 1.27200
Preferable Price Action: Buy positions above pivot with targets at 1.27340 & 1.27450 in extension.
Alternative Price Action: The price below pivot would call for further downside to 1.27060 & 1.26950.
Comment: RSI is above 50 level.
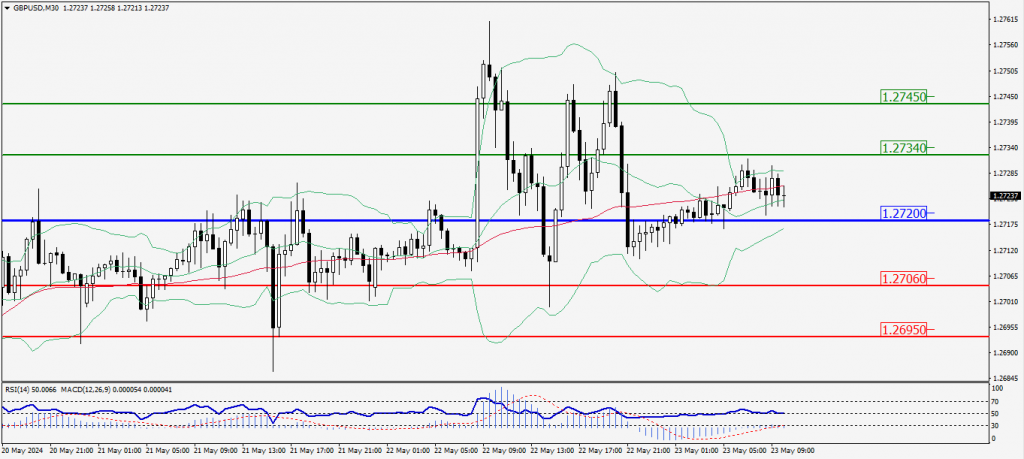
Green Lines Indicate Resistance Levels – Red Lines Indicate Support Levels
Light Blue is a Pivot Point – Black represents the price when the report was produced
USD/JPY Intraday: Trend on the downside
Our pivot point is at 156.670
Preferable Price Action: Sell position below pivot with the target at 156.480 and 156.320 in extension.
Alternative Price Action: The upside breakout of the pivot would call for 156.870 and 157.010.
Comment: MACD is below 50 levels and pairs below its 20MA.
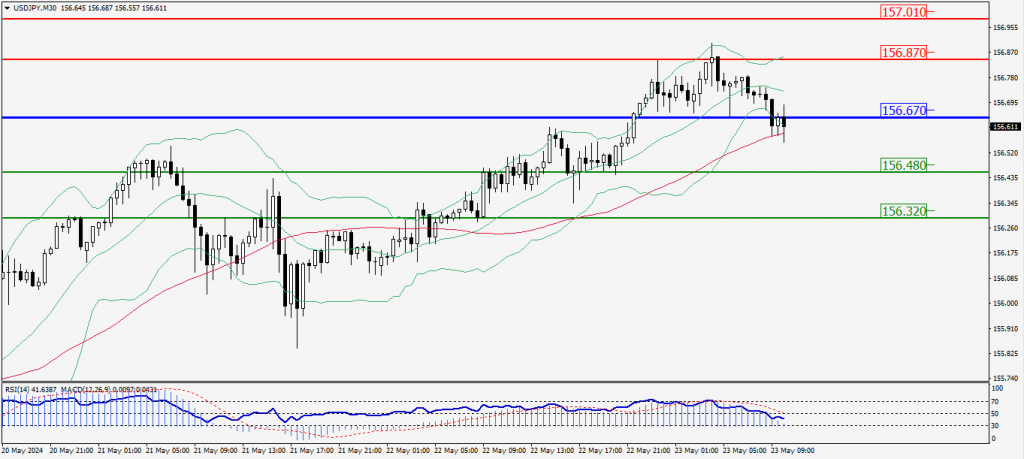
Green Lines Indicate Resistance Levels – Red Lines Indicate Support Levels
Light Blue is a Pivot Point – Black represents the price when the report was produced
AUD/USD Intraday: Trend on the downside
Our pivot point is at 0.66280
Preferable Price Action: Sell positions below pivot with targets at 0.66130 & 0.66010 in extension.
Alternative Price Action: Above pivot looks for a further upside with 0.66430 & 0.66540 as targets.
Comment: RSI is below 50 levels and pairs below its 55MA.
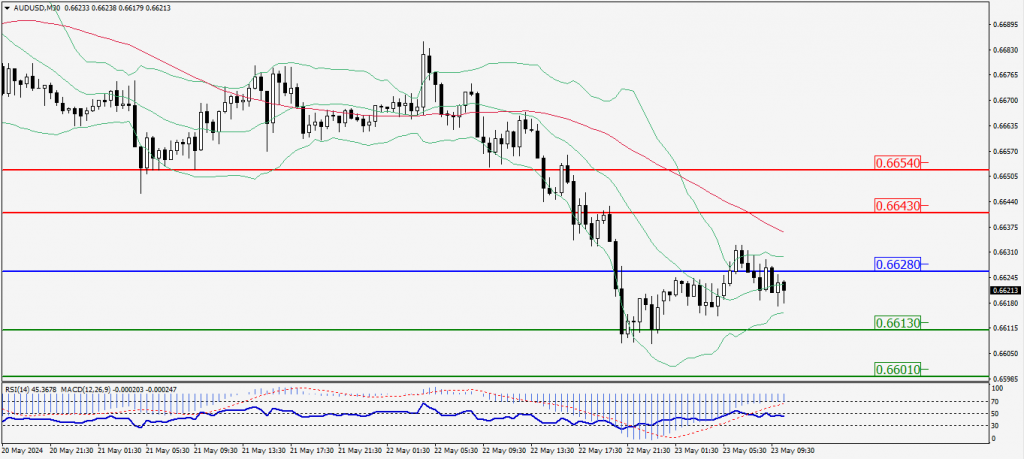
Green Lines Indicate Resistance Levels – Red Lines Indicate Support Levels
Light Blue is a Pivot Point – Black represents the price when the report was produced
CRUDEOIL Intraday: Trend on the upside
Our pivot point is at 77.09
Preferable Price Action: Above pivot buy oil with 77.94 & 78.55 as targets.
Alternative Price Action: Sell crude below pivot with targets at 76.28 and 75.63 in extension.
Comment: MACD is positive territory and pairs above its 55MA.
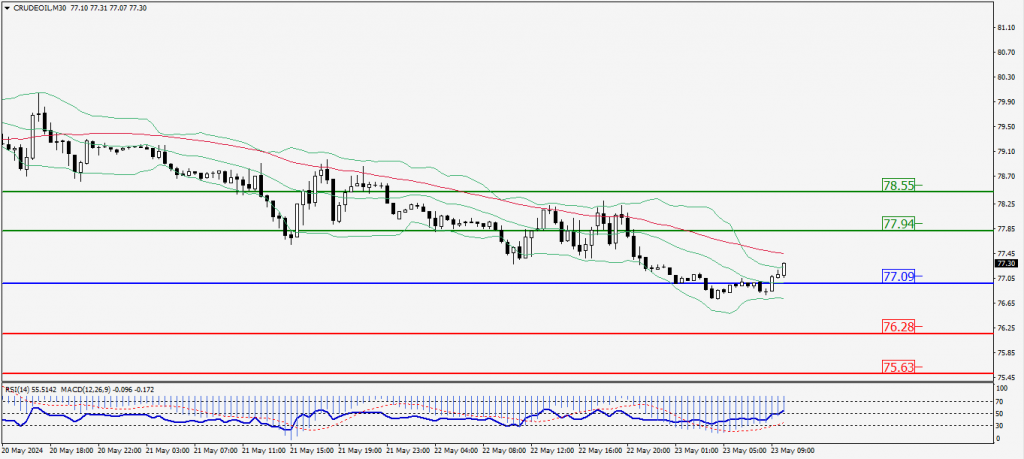
Green Lines Indicate Resistance Levels – Red Lines Indicate Support Levels
Light Blue is a Pivot Point – Black represents the price when the report was produced
XAU/USD Intraday: Major trend on the downside
Our pivot point is 2368.50
Preferable Price Action: Further downside to 2344.10 and 2327.10.
Alternative Price Action: If the price gives an upside breakout of a pivot, then the price extends to 2391.80 and 2409.00.
Comment: MACD is below 50 levels and pairs below its 20MA & 55MA.
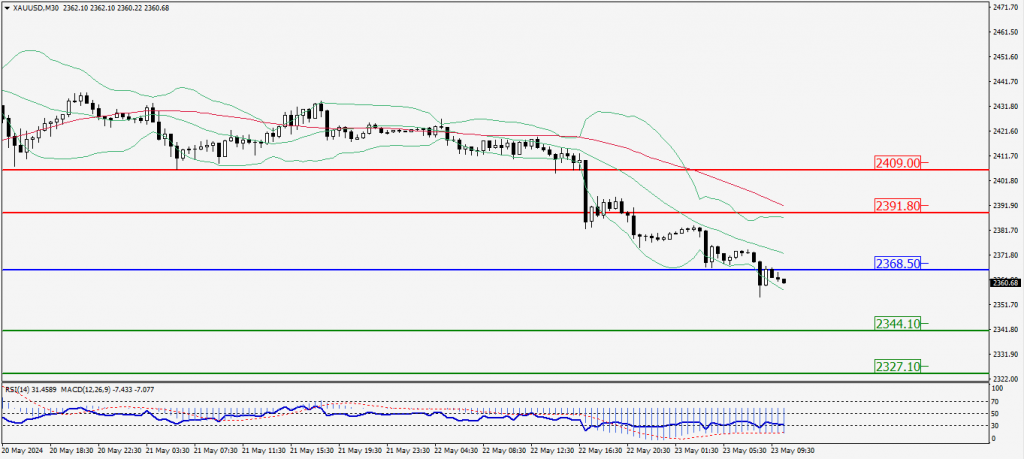
Green Lines Indicate Resistance Levels – Red Lines Indicate Support Levels
Light Blue is a Pivot Point – Black represents the price when the report was produced
Dow Jones Intraday: In consolidation state at 39,744.10
Our pivot point is 39,744.10
Preferable Price Action: Take sell positions below the pivot with targets at 39,624.70 & 39,542.10.
Alternative Price Action: Above 39,744.10 looks for further upside to 39,860.90 & 39,947.00.
Comment: RSI is at 50 levels and pairs below its 55MA.
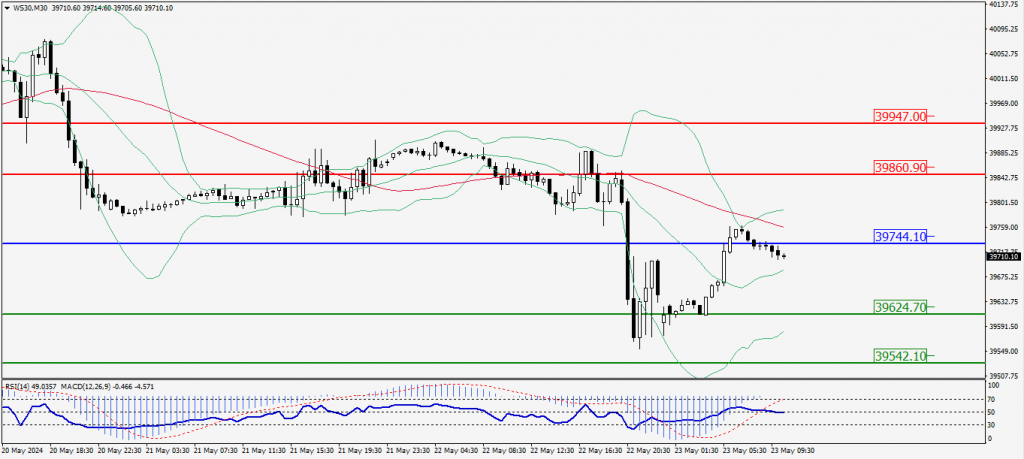
Green Lines Indicate Resistance Levels – Red Lines Indicate Support Levels
Light Blue is a Pivot Point – Black represents the price when the report was produced