Market Wrap: Stocks, Bonds, Commodities
On Monday, the upcoming release of the Purchasing Managers’ Index (PMI) reports is expected to shed light on the current economic growth sentiment in the eurozone.
The Dow Jones Industrial Average rose 134.2 points to 40,003.59, the S&P 500 gain 0.12% to 5,303.27and the Nasdaq Composite drop 12.36 points to 16,685.97.
MSCI’s index of Asia-Pacific stocks outside Japan is surged 0.36% to 7,863.70 levels. The Australian index was high by 0.63% to 39088.50. Japanese Nikkei Index increase 0.83% today.
European stocks were positive on Monday, with the Stoxx Europe 50 Index increase 0.09% to 5,068.55, Germany’s DAX surged 0.27% to 18,758.55, and France’s CAC higher 0.23% to 8,185.89 and U.K.’s FTSE 100 gain 0.24% to 8,440.74.
Benchmark 10-year U.S. Treasury rose as demand for safe assets slipped again, today 10-year bond yields increace 0.16% to 4.4270.
Oil prices rose in early Asian trading on Monday, adding to last week’s gains as rescuers searched for Iran’s president after a helicopter crash in the oil-producing nation and after the U.S. bought crude to help refill the national stockpile.
Spot Brent crude oil ascend 0.05% to $84.02 per barrel. US West Texas Intermediate crude is down 0.06% to $79.53 a barrel.
The yellow metal gold is increase 1.05% to 2,442.90 dollars per ounce.
Market Wrap: Forex
The U.S. dollar traded in a steady fashion Monday, at the start of a new week that is set to provide more clues over the future path of U.S. interest rates.
Today, the U.S. dollar index measures the Greenback against a trade-weighted basket of six major currencies, which surged 0.02% to 104.355.
The Euro US Dollar (EUR/USD) is a widely traded pair that is increase 0.03% today. This left the pair trading around $1.0873.
The Japanese yen was negative against the U.S. dollar on Monday. Today USD/JPY is higher 0.03% to the 155.70 level.
Another commodity-related currency mixed against the U.S dollar, AUD/USD either up or down 0.02% to 0.66920, and NZD/USD descend 0.20% to 0.61190 level.
EUR/USD Intraday: Support level at 1.08740
Our pivot point is at 1.08740
Preferable Price Action: Take buy positions above pivot level with targets at 1.08950 & 1.09120 in extension.
Alternative Price Action: Below pivot looks for a further downside to 1.08530 & 1.08350.
Comment: RSI is above 50 levels and pairs above its 20MA & 55MA.
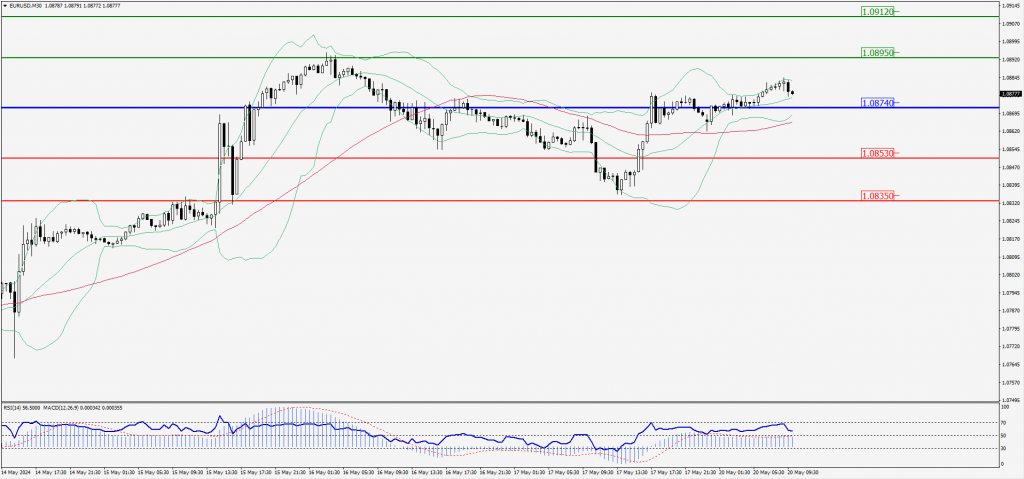
Green Lines Indicate Resistance Levels – Red Lines Indicate Support Levels
Light Blue is a Pivot Point – Black represents the price when the report was produced
GBP/USD Intraday: Trend on the downside
Our pivot point is at 1.27090
Preferable Price Action: Sell positions below pivot with targets at 1.26770 & 1.26470 in extension.
Alternative Price Action: The price above pivot would call for further upside to 1.27410 & 1.27680.
Comment: RSI is below 50 levels.
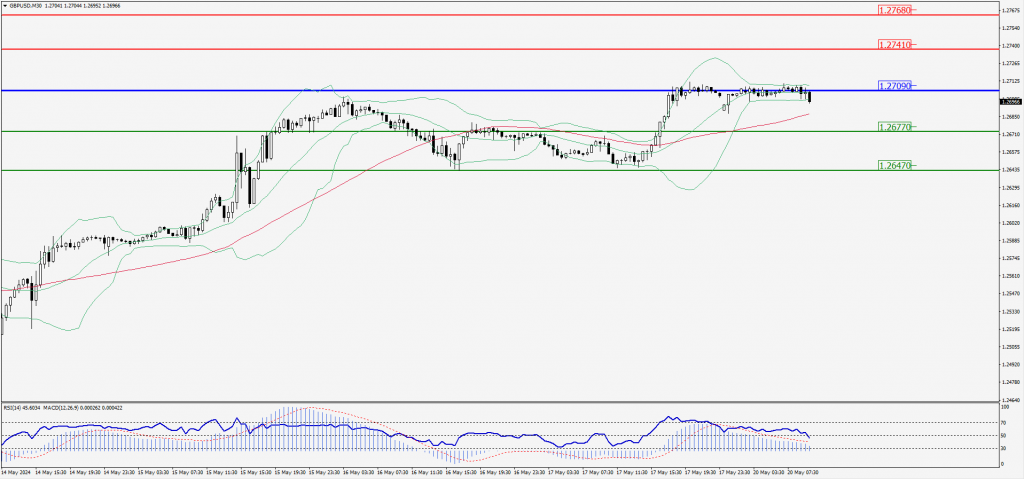
Green Lines Indicate Resistance Levels – Red Lines Indicate Support Levels
Light Blue is a Pivot Point – Black represents the price when the report was produced
USD/JPY Intraday: Trend on the downside
Our pivot point is at 155.760
Preferable Price Action: Sell position below pivot with the target at 155.320 and 154.950 in extension.
Alternative Price Action: The upside breakout of the pivot would call for 156.210 and 156.580.
Comment: MACD is below 50 levels and pairs below its 20MA & 55MA.
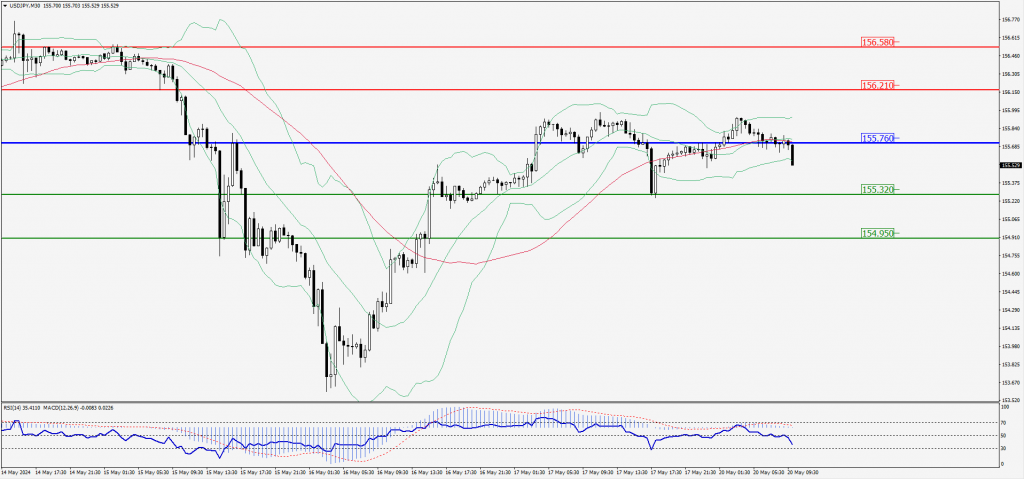
Green Lines Indicate Resistance Levels – Red Lines Indicate Support Levels
Light Blue is a Pivot Point – Black represents the price when the report was produced
AUD/USD Intraday: Trend on the downside
Our pivot point is at 0.67020
Preferable Price Action: Sell positions below pivot with targets at 0.66790 & 0.66600 in extension.
Alternative Price Action: Above pivot looks for a further upside with 0.67240 & 0.67430 as targets.
Comment: RSI is below 50 levels and pairs below its 20MA.
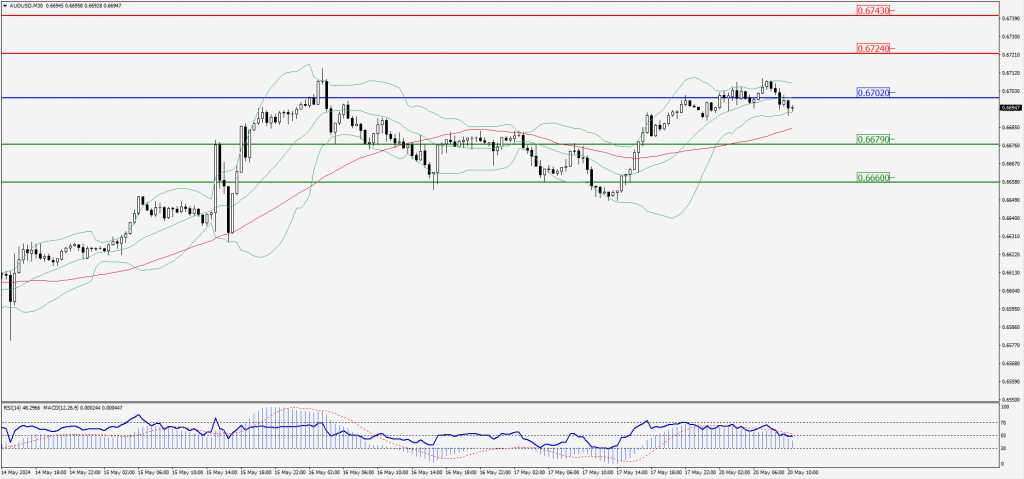
Green Lines Indicate Resistance Levels – Red Lines Indicate Support Levels
Light Blue is a Pivot Point – Black represents the price when the report was produced
CRUDEOIL Intraday: Trend on the upside
Our pivot point is at 79.64
Preferable Price Action: Above pivot buy oil with 80.26 & 80.78 as targets.
Alternative Price Action: Sell crude below pivot with targets at 79.06 and 78.49 in extension.
Comment: MACD is positive territory and pairs above its 20MA & 55MA.
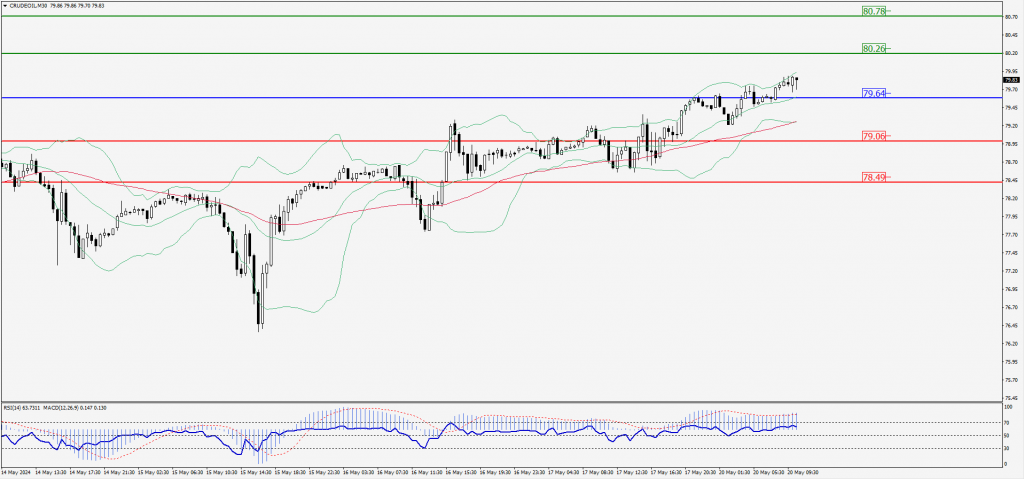
Green Lines Indicate Resistance Levels – Red Lines Indicate Support Levels
Light Blue is a Pivot Point – Black represents the price when the report was produced
XAU/USD Intraday: Trend on the upside
Our pivot point is 2436.10
Preferable Price Action: Further upside to 2450.70 and 2463.20.
Alternative Price Action: If the price gives an downside breakout of a pivot, then the price extends to 2421.80 and 2408.70.
Comment: MACD is above 50 levels and pairs above its 20MA & 55MA.
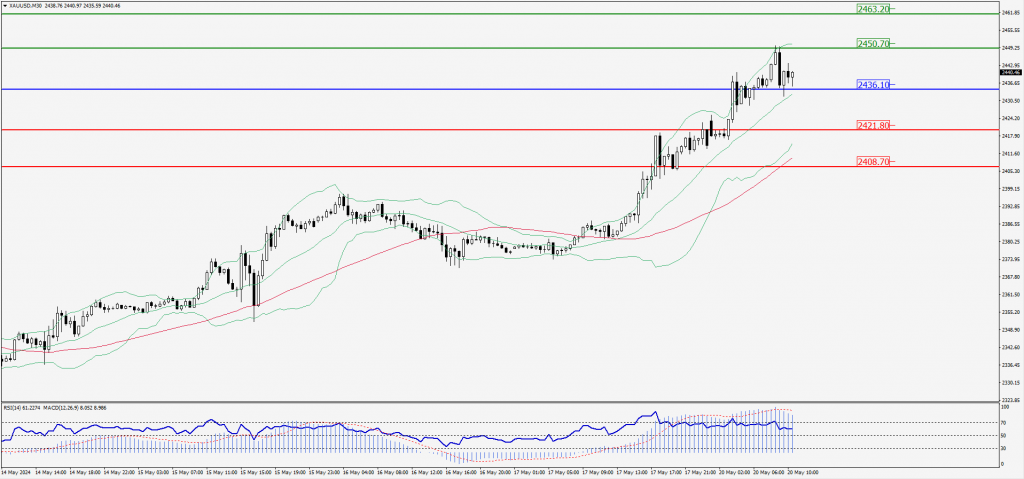
Green Lines Indicate Resistance Levels – Red Lines Indicate Support Levels
Light Blue is a Pivot Point – Black represents the price when the report was produced
Dow Jones Intraday: Trend on the upside
Our pivot point is 39,998.90
Preferable Price Action: Take buy positions above the pivot with targets at 40,108.50 & 40,186.70.
Alternative Price Action: Below 39,998.90 looks for further downside to 39,892.10 & 39,808.20.
Comment: RSI is above 50 levels and pairs above its 55MA.
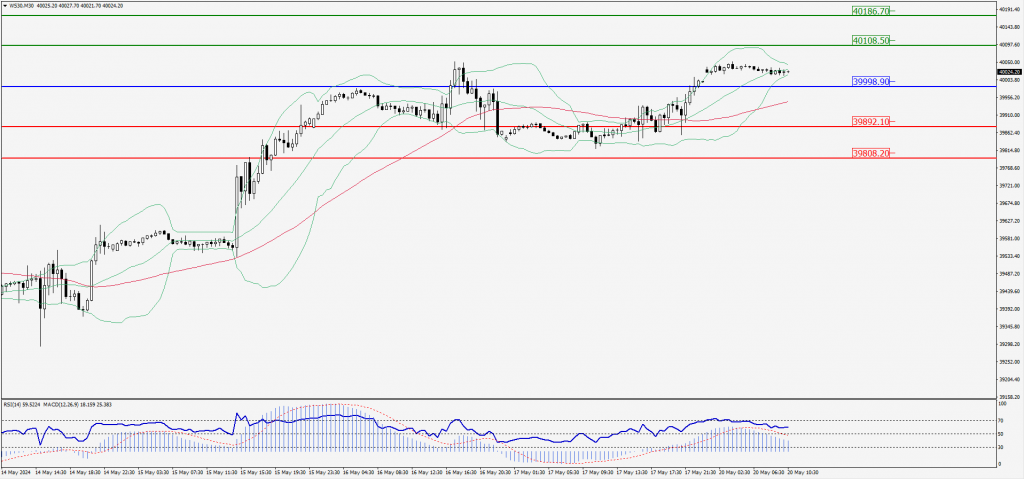
Green Lines Indicate Resistance Levels – Red Lines Indicate Support Levels
Light Blue is a Pivot Point – Black represents the price when the report was produced