Market Wrap: Stocks, Bonds, Commodities
Wall Street hit record highs as bond yields dropped on news of slower inflation, boosting expectations for Fed rate cuts by September. The S&P 500 marked its 23rd record of 2024 after consumer prices cooled for the first time in six months.
The Dow Jones Industrial Average rose 349.89 points to 39,908.00, the S&P 500 gain 1.17% to 5,308.15 and the Nasdaq Composite surged 231.21 points to 16,742.39.
MSCI’s index of Asia-Pacific stocks outside Japan is surged 1.33% to 699.46 levels. The Australian index was high by 1.65% to 7,881.30. Japanese Nikkei Index increase 1.41% today.
European stocks were negative on Thursday, with the Stoxx Europe 50 Index decrease 0.40% to 5,080.25, Germany’s DAX drop 0.28% to 18,821.85, and France’s CAC lower 0.67% to 8,184.47 and U.K.’s FTSE 100 loss 0.34% to 8,417.05.
Benchmark 10-year U.S. Treasury rose as demand for safe assets slipped again, today 10-year bond yields decline 0.34% to 4.3380.
Oil prices extended gains from the previous session on Thursday on signs of stronger demand in the U.S., where data showed slower inflation than markets expected, bolstering the argument for an interest rate cut that could drive greater consumption.
Spot Brent crude oil drop 0.10% to $82.67 per barrel. US West Texas Intermediate crude is down 0.10% to $78.55 a barrel.
The yellow metal gold is decrease 0.17% to 2,390.85 dollars per ounce.
Market Wrap: Forex
The U.S. dollar steadied in European trade Thursday, after dropping to multi-week lows overnight in the wake of a milder U.S. inflation report, which brought Fed rate cuts back into focus.
Today, the U.S. dollar index measures the Greenback against a trade-weighted basket of six major currencies, which surged 0.04% to 104.255.
The Euro US Dollar (EUR/USD) is a widely traded pair that is decrease 0.09% today. This left the pair trading around $1.08720.
The Japanese yen was negative against the U.S. dollar on Thursday. Today USD/JPY is lower 0.14% to the 154.66 level.
Another commodity-related currency negative against the U.S dollar, AUD/USD fell 0.15% to 0.66820, and NZD/USD descend 0.13% to 0.61130 level.
EUR/USD Intraday: Trend on the downside
Our pivot point is at 1.08820
Preferable Price Action: Take sell positions below pivot level with targets at 1.08630 & 1.08470 in extension.
Alternative Price Action: Above pivot looks for a further upside to 1.09020 & 1.09170.
Comment: RSI is below 50 levels and pairs below its 20MA.
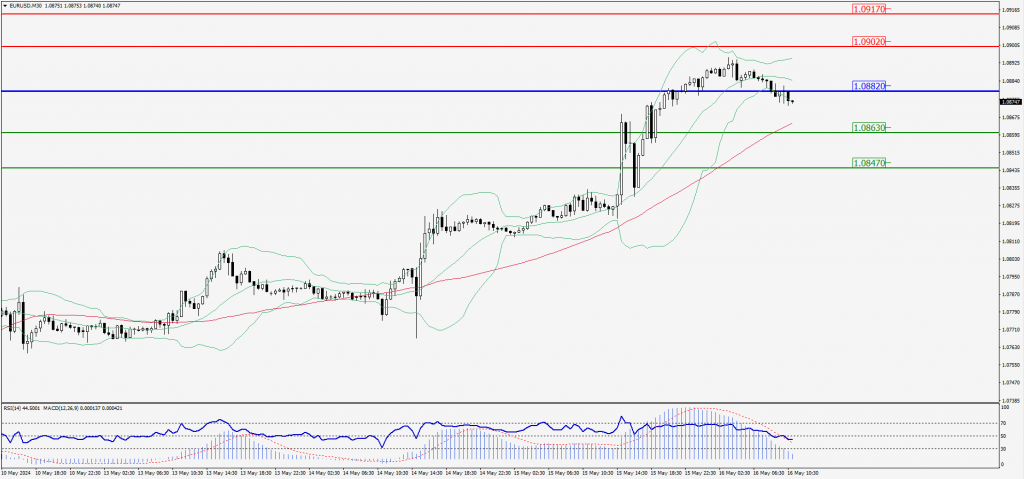
Green Lines Indicate Resistance Levels – Red Lines Indicate Support Levels
Light Blue is a Pivot Point – Black represents the price when the report was produced
GBP/USD Intraday: In consolidation state at 1.26730
Our pivot point is at 1.26730
Preferable Price Action: Buy positions above pivot with targets at 1.27010 & 1.27220 in extension.
Alternative Price Action: The price below pivot would call for further downside to 1.26440 & 1.26200.
Comment: RSI is at 50 levels and pairs above its 55MA.
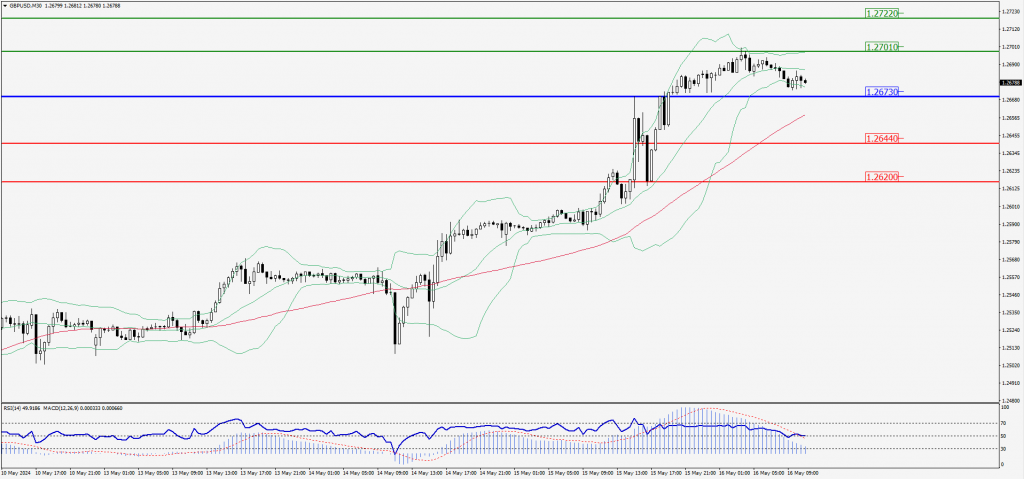
Green Lines Indicate Resistance Levels – Red Lines Indicate Support Levels
Light Blue is a Pivot Point – Black represents the price when the report was produced
USD/JPY Intraday: Trend on the upside
Our pivot point is at 154.340
Preferable Price Action: Buy position above pivot with the target at 154.730 and 155.020 in extension.
Alternative Price Action: The downside breakout of the pivot would call for 153.950 and 153.660.
Comment: MACD is above 50 levels and pairs above its 20MA.
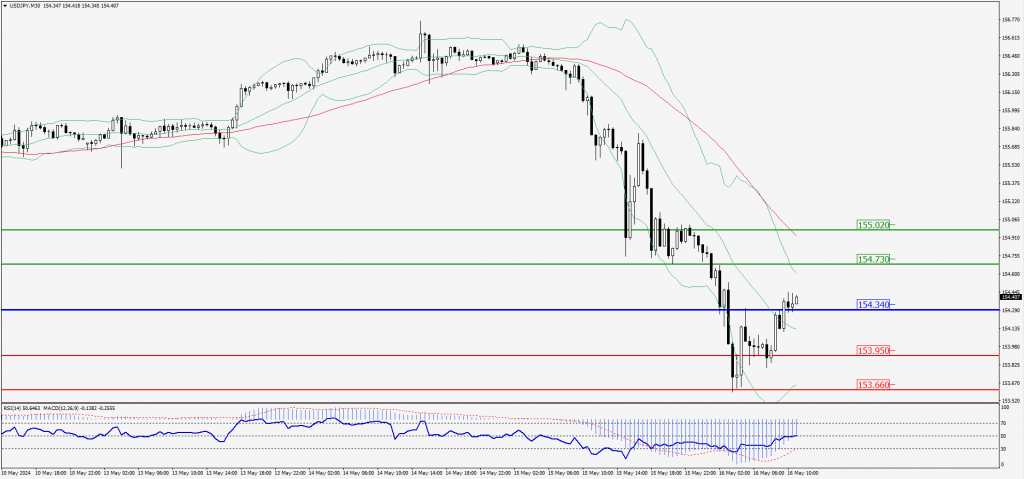
Green Lines Indicate Resistance Levels – Red Lines Indicate Support Levels
Light Blue is a Pivot Point – Black represents the price when the report was produced
AUD/USD Intraday: Trend on the upside
Our pivot point is at 0.66840
Preferable Price Action: Buy positions above pivot with targets at 0.67010 & 0.67140 in extension.
Alternative Price Action: Below pivot looks for a further downside with 0.66670 & 0.66540 as targets.
Comment: RSI is above 50 levels and pairs above its 55MA.
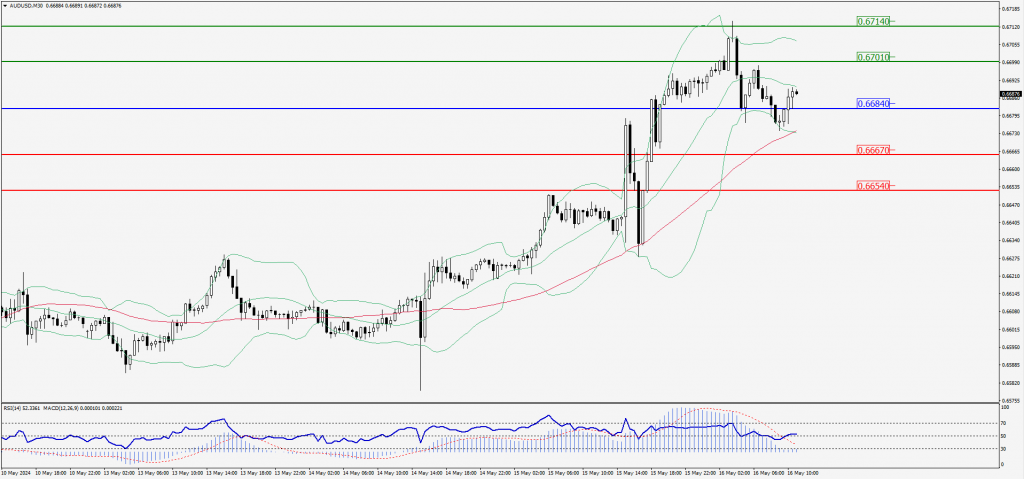
Green Lines Indicate Resistance Levels – Red Lines Indicate Support Levels
Light Blue is a Pivot Point – Black represents the price when the report was produced
CRUDEOIL Intraday: Trend on the upside
Our pivot point is at 78.37
Preferable Price Action: Above pivot buy oil with 78.79 & 79.11 as targets.
Alternative Price Action: Sell crude below pivot with targets at 77.98 and 77.65 in extension.
Comment: MACD is positive territory and pairs above its 55MA.
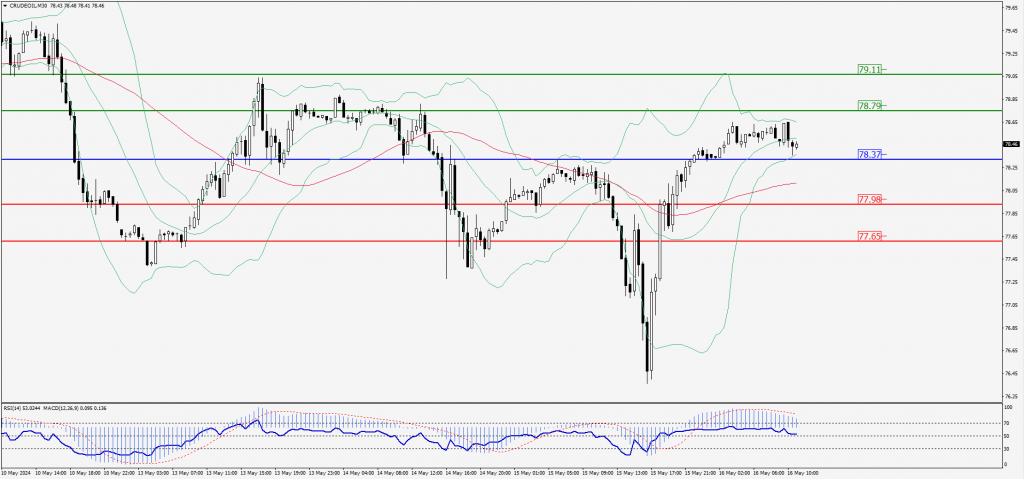
Green Lines Indicate Resistance Levels – Red Lines Indicate Support Levels
Light Blue is a Pivot Point – Black represents the price when the report was produced
XAU/USD Intraday: Trend on the upside
Our pivot point is 2389.20
Preferable Price Action: Further upside to 2398.80 and 2407.00.
Alternative Price Action: If the price gives an downside breakout of a pivot, then the price extends to 2379.60 and 2371.20.
Comment: MACD is above 50 levels and pairs above its 55MA.
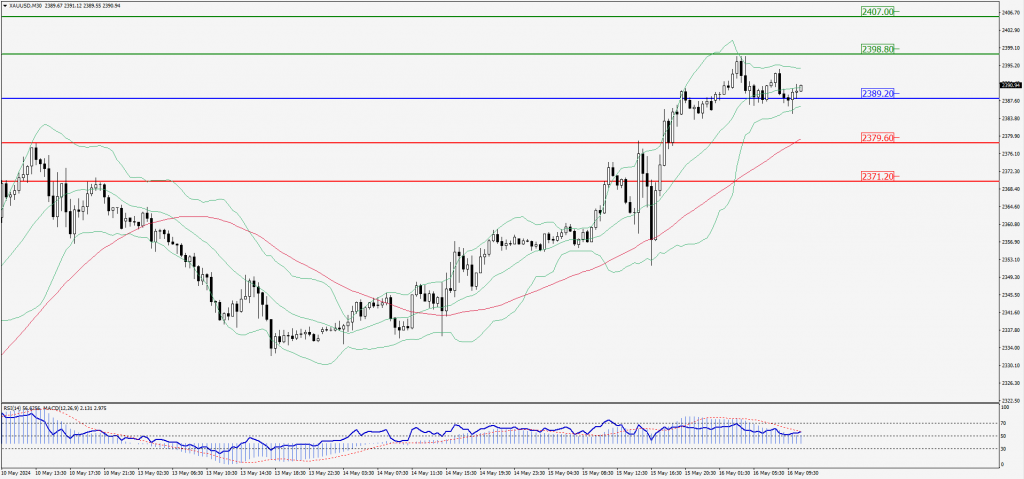
Green Lines Indicate Resistance Levels – Red Lines Indicate Support Levels
Light Blue is a Pivot Point – Black represents the price when the report was produced
Dow Jones Intraday: Trend on the upside
Our pivot point is 39,900.10
Preferable Price Action: Take buy positions above the pivot with targets at 39,998.00 & 40,059.80.
Alternative Price Action: Below 39,900.10 looks for further downside to 39,804.60 & 39,734.60.
Comment: RSI is above 50 levels and pairs above its 55MA.
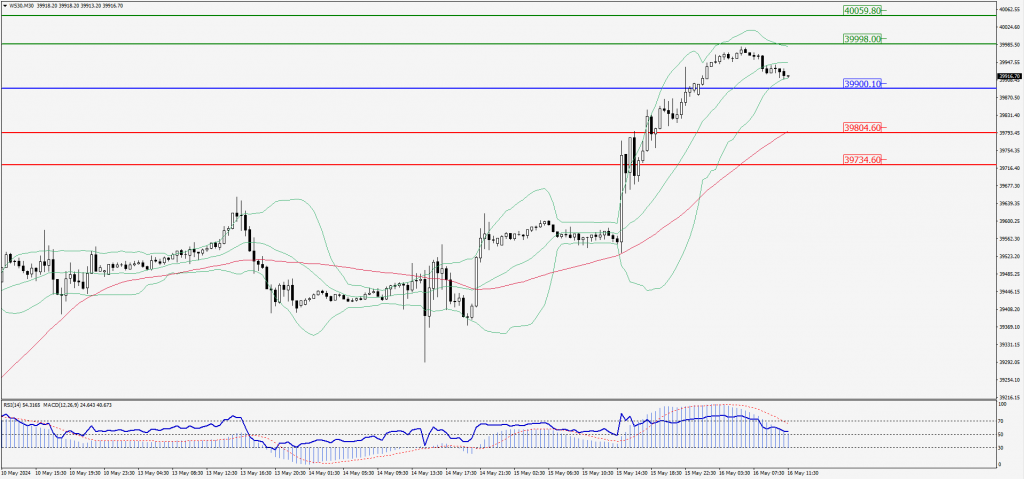
Green Lines Indicate Resistance Levels – Red Lines Indicate Support Levels
Light Blue is a Pivot Point – Black represents the price when the report was produced