Market Wrap: Stocks, Bonds, Commodities
The U.S. dollar drifted marginally lower Monday, consolidating after recent swings as the focus turned squarely to upcoming U.S. inflation data for more cues on interest rates.
The Dow Jones Industrial Average rose 125.08 points to 39,512.84, the S&P 500 gain 0.16% to 5,222.68 and the Nasdaq Composite drop 5.40 points to 16,340.87.
MSCI’s index of Asia-Pacific stocks outside Japan is surged 0.65% to 685.27 levels. The Australian index was high by 0.01% to 7,750.00. Japanese Nikkei Index decline 0.24% today.
European stocks were mixed on Monday, with the Stoxx Europe 50 Index decrease 0.17% to 5,076.45, Germany’s DAX drop 0.06% to 18,744.95, and France’s CAC lower 0.13% to 8,208.82 and U.K.’s FTSE 100 gain 0.02% to 8,435.25.
Benchmark 10-year U.S. Treasury rose as demand for safe assets slipped again, today 10-year bond yields decline 0.33% to 4.4880.
Oil prices extended declines on Monday amid signs of weak fuel demand and as comments from U.S. Federal Reserve officials dampened hopes of interest rate cuts, which could slow growth and crimp energy use in the world’s biggest economy.
Spot Brent crude oil surged 0.1% to $82.96 per barrel. US West Texas Intermediate crude is up 0.27% to $78.47 a barrel.
The yellow metal gold is decrease 1.20% to 2,346.45 dollars per ounce.
Market Wrap: Forex
The dollar consolidated against major peers on Monday as market participants awaited U.S. inflation data to assess the prospects of interest rate cuts this year.
Today, the U.S. dollar index measures the Greenback against a trade-weighted basket of six major currencies, which drop 0.03% to 105.140.
The Euro US Dollar (EUR/USD) is a widely traded pair that is increase 0.14% today. This left the pair trading around $1.07840.
The Japanese yen was negative against the U.S. dollar on Monday. Today USD/JPY is higher 0.10% to the 155.88 level.
Another commodity-related currency mixed against the U.S dollar, AUD/USD fell 0.12% to 0.66090, and NZD/USD ascend 0.13% to 0.60110 level.
EUR/USD Intraday: Trend on the upside
Our pivot point is at 1.07800
Preferable Price Action: Take buy positions above pivot level with targets at 1.07900 & 1.07970 in extension.
Alternative Price Action: Below pivot looks for a further downside to 1.07700 & 1.07620.
Comment: RSI is above 50 levels and pairs above its 20MA & 55MA.
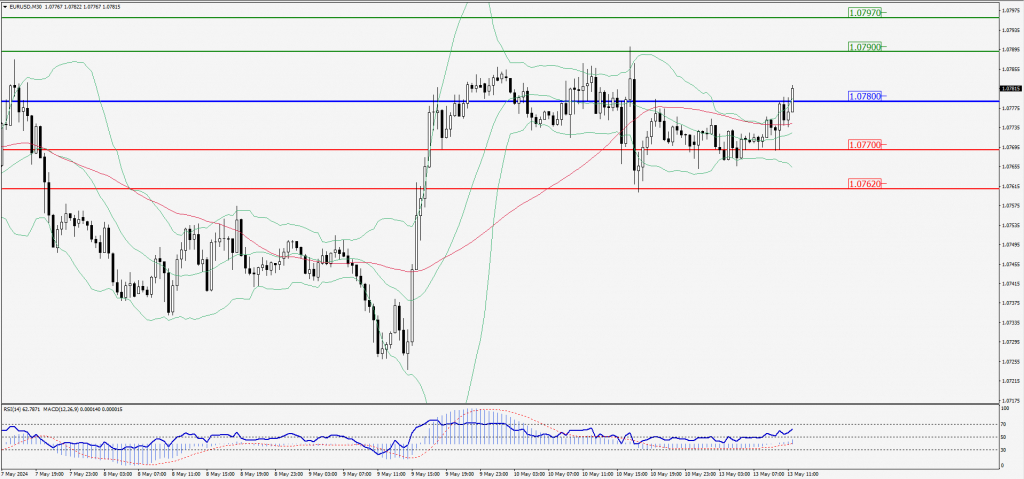
Green Lines Indicate Resistance Levels – Red Lines Indicate Support Levels
Light Blue is a Pivot Point – Black represents the price when the report was produced
GBP/USD Intraday: Support level at 1.25280
Our pivot point is at 1.25280
Preferable Price Action: Buy positions above pivot with targets at 1.25470 & 1.25610 in extension.
Alternative Price Action: The price below pivot would call for further downside to 1.25100 & 1.24960.
Comment: RSI is above 50 levels and pairs above its 20MA & 55MA.
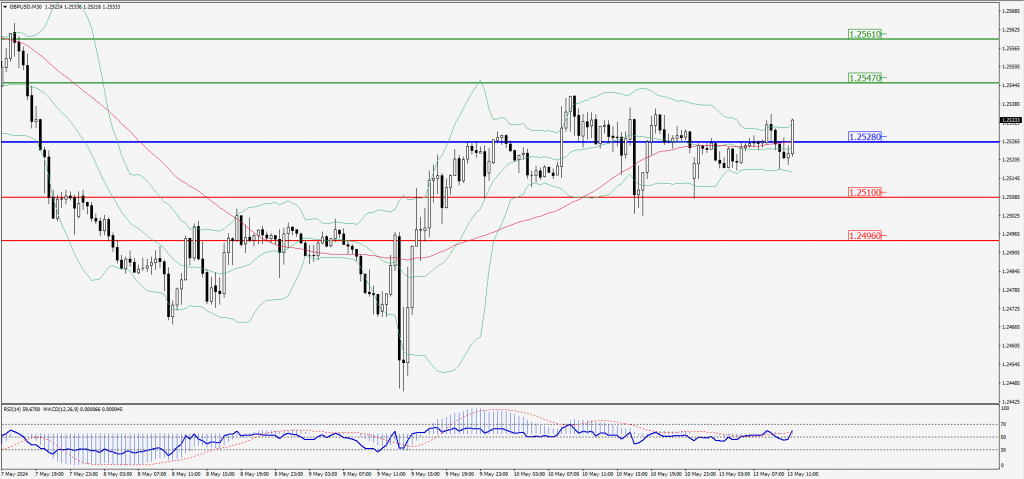
Green Lines Indicate Resistance Levels – Red Lines Indicate Support Levels
Light Blue is a Pivot Point – Black represents the price when the report was produced
USD/JPY Intraday: Trend on the upside
Our pivot point is at 155.770
Preferable Price Action: Buy position above pivot with the target at 156.230 and 156.540 in extension.
Alternative Price Action: The downside breakout of the pivot would call for 155.350 and 155.030.
Comment: MACD is above 50 levels and pairs above its 55MA.
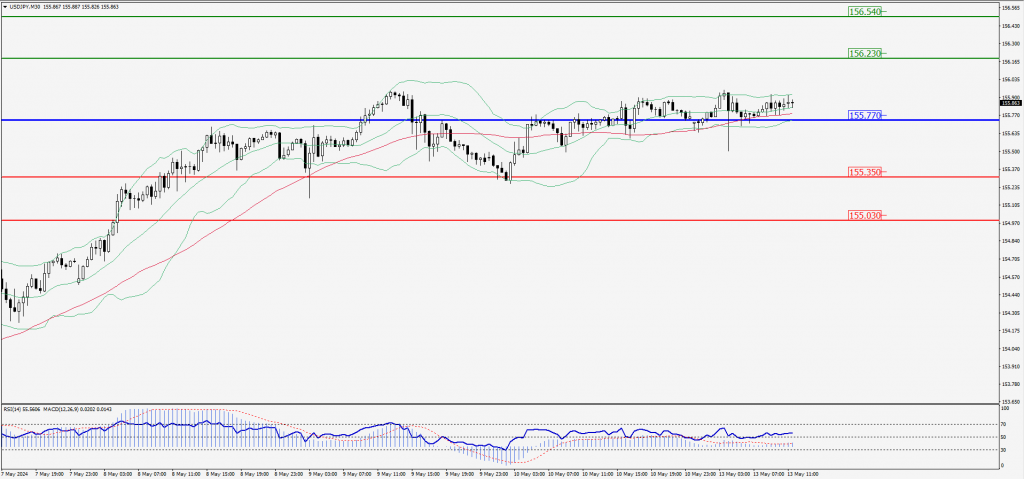
Green Lines Indicate Resistance Levels – Red Lines Indicate Support Levels
Light Blue is a Pivot Point – Black represents the price when the report was produced
AUD/USD Intraday: Trend on the upside
Our pivot point is at 0.66080
Preferable Price Action: Buy positions above pivot with targets at 0.66210 & 066320 in extension.
Alternative Price Action: Below pivot looks for a further downside with 0.65950 & 0.65840 as targets.
Comment: RSI is above 50 levels and pairs above its 20MA & 55MA.
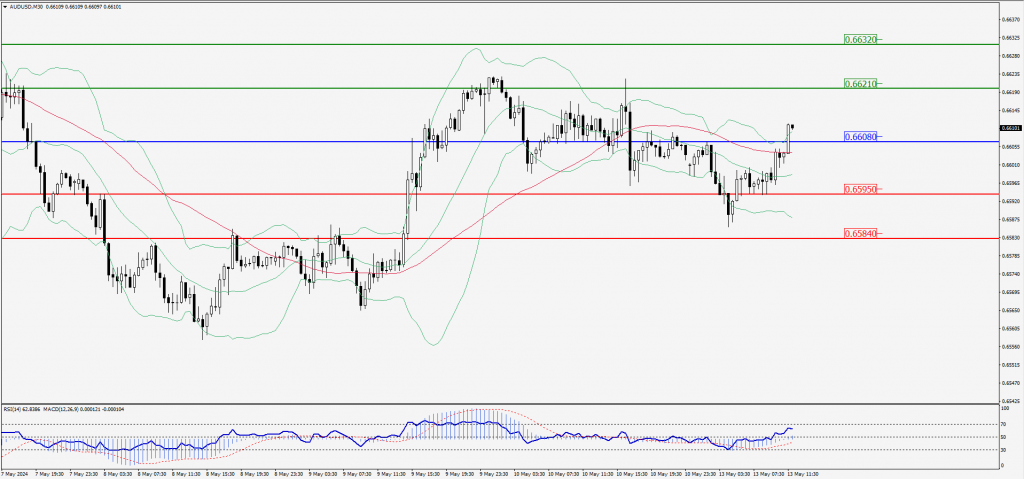
Green Lines Indicate Resistance Levels – Red Lines Indicate Support Levels
Light Blue is a Pivot Point – Black represents the price when the report was produced
CRUDEOIL Intraday: Trend on the upside
Our pivot point is at 78.05
Preferable Price Action: Above pivot buy oil with 78.68 & 79.19 as targets.
Alternative Price Action: Sell crude below pivot with targets at 77.43 and 76.94 in extension.
Comment: MACD is positive territory and Pairs above its 20MA.
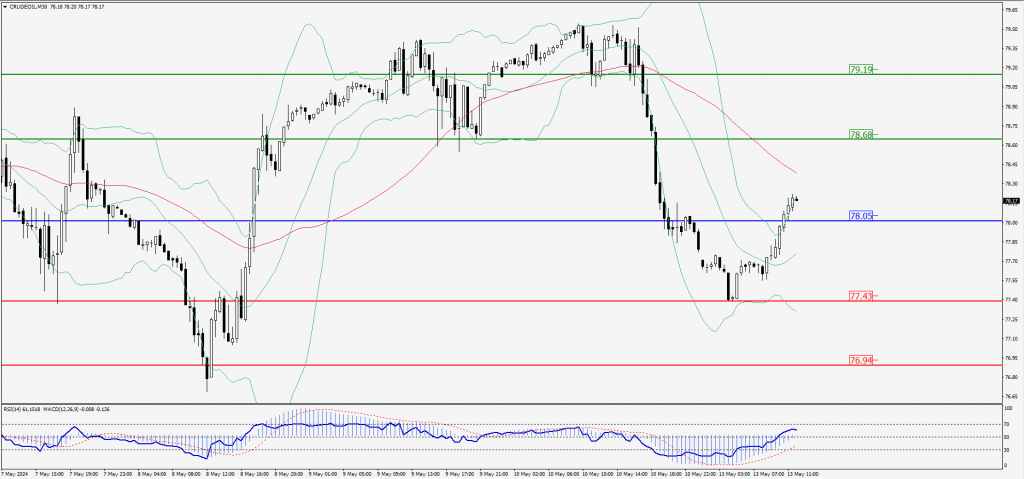
Green Lines Indicate Resistance Levels – Red Lines Indicate Support Levels
Light Blue is a Pivot Point – Black represents the price when the report was produced
XAU/USD Intraday: Major trend on the downside
Our pivot point is 2349.20
Preferable Price Action: Further downside to 2332.00 and 2319.10.
Alternative Price Action: If the price gives an upside breakout of a pivot, then the price extends to 2367.40 and 2380.40.
Comment: MACD is below 50 levels and pairs below its 20MA & 55MA.
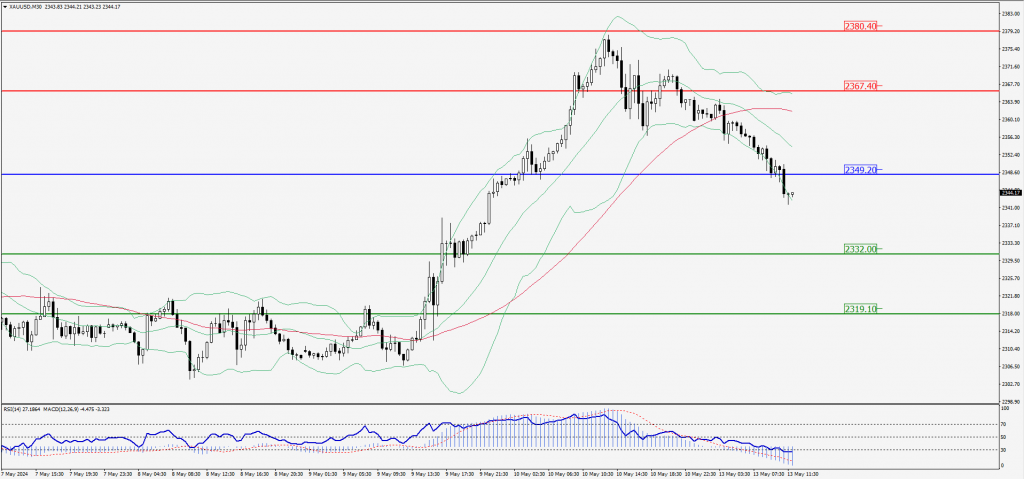
Green Lines Indicate Resistance Levels – Red Lines Indicate Support Levels
Light Blue is a Pivot Point – Black represents the price when the report was produced
Dow Jones Intraday: Trend on the upside
Our pivot point is 39,512.40
Preferable Price Action: Take buy positions above the pivot with targets at 39,633.10 & 39,730.00.
Alternative Price Action: Below 39,512.40 looks for further downside to 39,391.60 & 39,287.30.
Comment: RSI is above 50 levels and pairs above its 55MA.
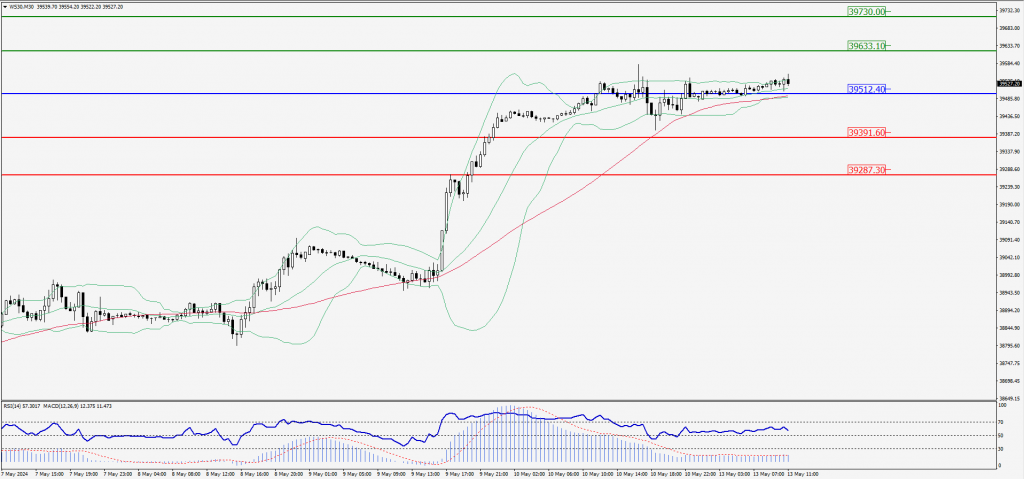
Green Lines Indicate Resistance Levels – Red Lines Indicate Support Levels
Light Blue is a Pivot Point – Black represents the price when the report was produced