Market Wrap: Stocks, Bonds, Commodities
US stocks closed higher on Friday, buoyed by a rally in megacap growth stocks following robust quarterly results from technology heavyweights Alphabet and Microsoft in addition to moderate inflation data.
The Dow Jones Industrial Average rose 153.86 points to 38,239.96, the S&P 500 gain 1.02% to 5,099.96 and the Nasdaq Composite ascend 316.14 points to 15,927.90.
MSCI’s index of Asia-Pacific stocks outside Japan is advance 0.81% to 663.45 levels. The Australian index was higher by 0.81% to 7,637.40. Japanese Nikkei Index surged 0.81% today.
European stocks were mixed on Monday, with the Stoxx Europe 50 Index decline 0.08% to 5,002.75, Germany’s DAX surged 0.01% to 18,166.95, and France’s CAC higher 0.15% to 8,100.05 and U.K.’s FTSE 100 gain 0.57% to 8,186.09.
Benchmark 10-year U.S. Treasury rose as demand for safe assets slipped again, today 10-year bond yields negative 0.84% to 4.631.
Oil prices fell in early Asian trading on Monday, reversing gains from Friday as US inflation data further dimmed the prospects of interest rate cuts anytime soon and boosted the dollar, which hurts oil demand.
Spot Brent crude oil descend 0.37% to $87.89 per barrel. US West Texas Intermediate crude is down 0.29% to $83.61 a barrel.
The yellow metal gold is increase 0.08% to 2,349.00 dollars per ounce.
Market Wrap: Forex
The yen jumped suddenly against the dollar on Monday, with traders citing yen-buying intervention by Japanese authorities to try to underpin a currency languishing at levels last seen over three decades ago.
Today, the U.S. dollar index measures the Greenback against a trade-weighted basket of six major currencies, which drop 0.19% to 105.605.
The Euro US Dollar (EUR/USD) is a widely traded pair that is up 0.16% today. This left the pair trading around $1.0707.
The Japanese yen was negative against the U.S. dollar on Monday. Today USD/JPY is slipped 1.55% to the 155.88 level.
Another commodity-related currency positive against the U.S dollar, AUD/USD rose 0.38% to 0.6558, and NZD/USD surged 0.58% to 0.5968 level.
EUR/USD Intraday: Support level at 1.07140
Our pivot point is at 1.07140
Preferable Price Action: Take buy positions above pivot level with targets at 1.07310 & 1.07430 in extension.
Alternative Price Action: Below pivot looks for a further downside to 1.06980 & 1.06850.
Comment: RSI is above 50 levels and pairs above its 20MA & 55MA.
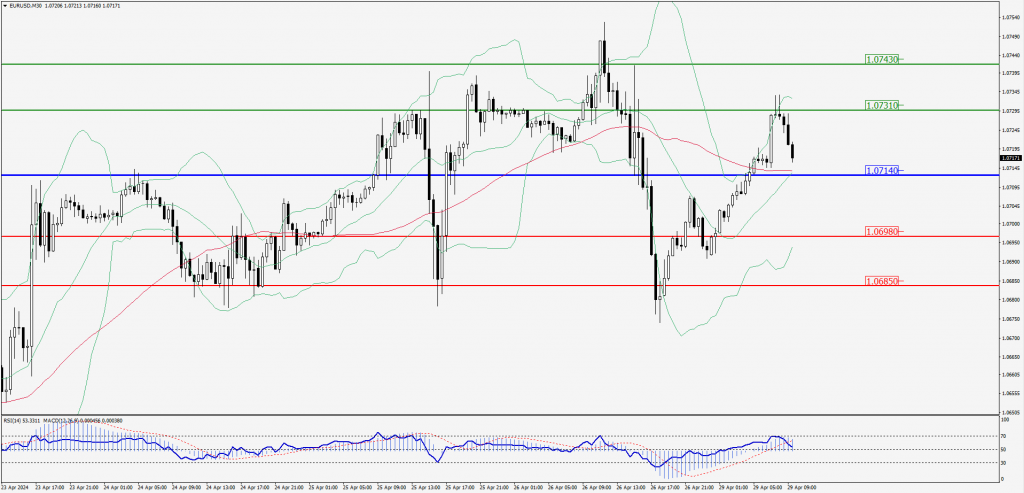
Green Lines Indicate Resistance Levels – Red Lines Indicate Support Levels
Light Blue is a Pivot Point – Black represents the price when the report was produced
GBP/USD Intraday: Trend on the upside
Our pivot point is at 1.25190
Preferable Price Action: Buy positions above pivot with targets at 1.25480 & 1.25730 in extension.
Alternative Price Action: The price below pivot would call for further downside to 1.24900 & 1.24620.
Comment: RSI is above 50 levels and Pairs above its 55MA & 20MA.
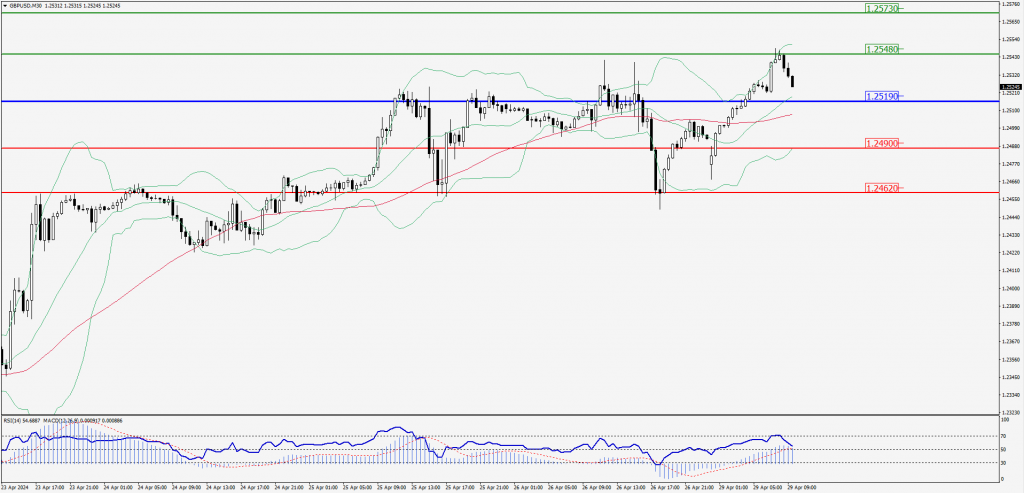
Green Lines Indicate Resistance Levels – Red Lines Indicate Support Levels
Light Blue is a Pivot Point – Black represents the price when the report was produced
USD/JPY Intraday: Trend on the downside
Our pivot point is at 157.360
Preferable Price Action: Sell position below pivot with the target at 156.580 and 155.970 in extension.
Alternative Price Action: The upside breakout of the pivot would call for 156.580 and 155.970.
Comment: MACD is below 50 levels and Paris below its 20MA & 55MA.
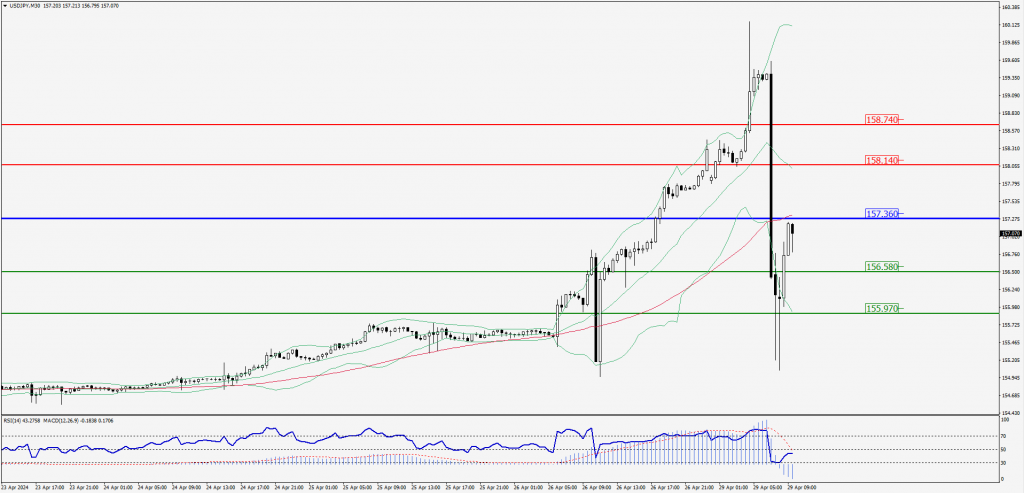
Green Lines Indicate Resistance Levels – Red Lines Indicate Support Levels
Light Blue is a Pivot Point – Black represents the price when the report was produced
AUD/USD Intraday: Trend on the upside
Our pivot point is at 0.65490
Preferable Price Action: Buy positions above pivot with targets at 0.65690 & 0.65860 in extension.
Alternative Price Action: Below pivot looks for a further downside with 0.65300 & 0.65120 as targets.
Comment: RSI is above 50 levels and pairs above its 55MA.
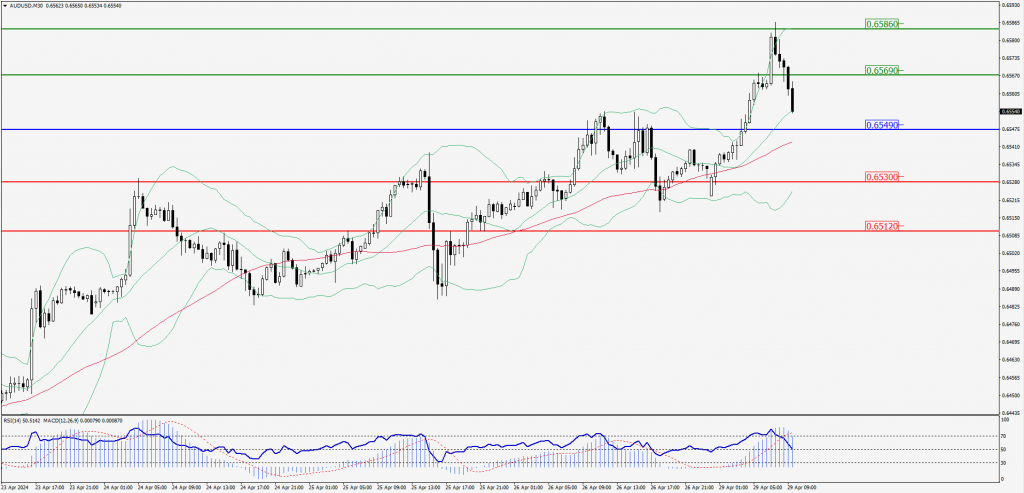
Green Lines Indicate Resistance Levels – Red Lines Indicate Support Levels
Light Blue is a Pivot Point – Black represents the price when the report was produced
CRUDEOIL Intraday: Trend on the downside
Our pivot point is at 82.98
Preferable Price Action: Below pivot sell oil with 82.49 & 82.08 as targets.
Alternative Price Action: Buy crude above pivot with targets at 83.45 and 83.85 in extension.
Comment: MACD is negative territory and pairs below its 20MA & 55MA.
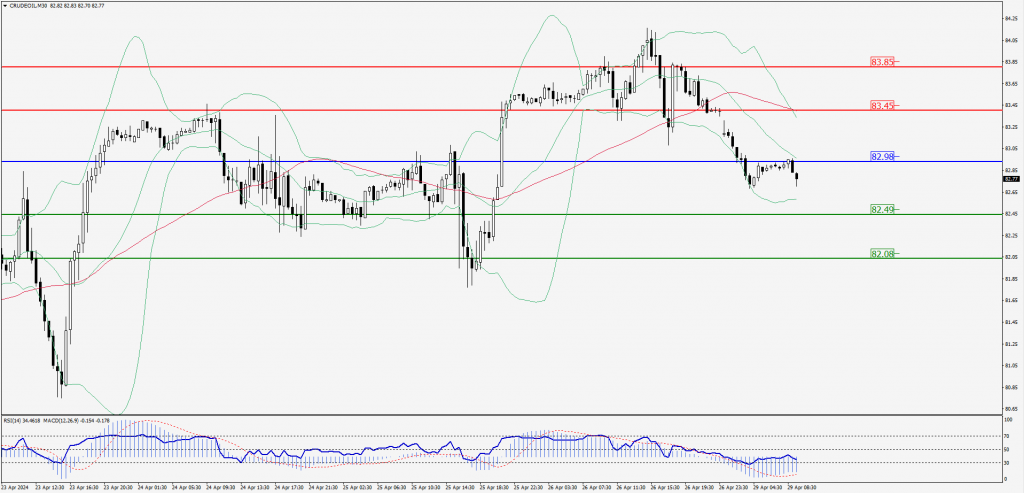
Green Lines Indicate Resistance Levels – Red Lines Indicate Support Levels
Light Blue is a Pivot Point – Black represents the price when the report was produced
XAU/USD Intraday: Trend at the downside
Our pivot point is 2333.10
Preferable Price Action: Further downside to 2324.40 and 2317.60.
Alternative Price Action: If the price gives a upside breakout of a pivot, then the price extends to 2341.50 and 2348.50.
Comment: MACD is below 50 levels and pairs below its 20MA & 55MA.
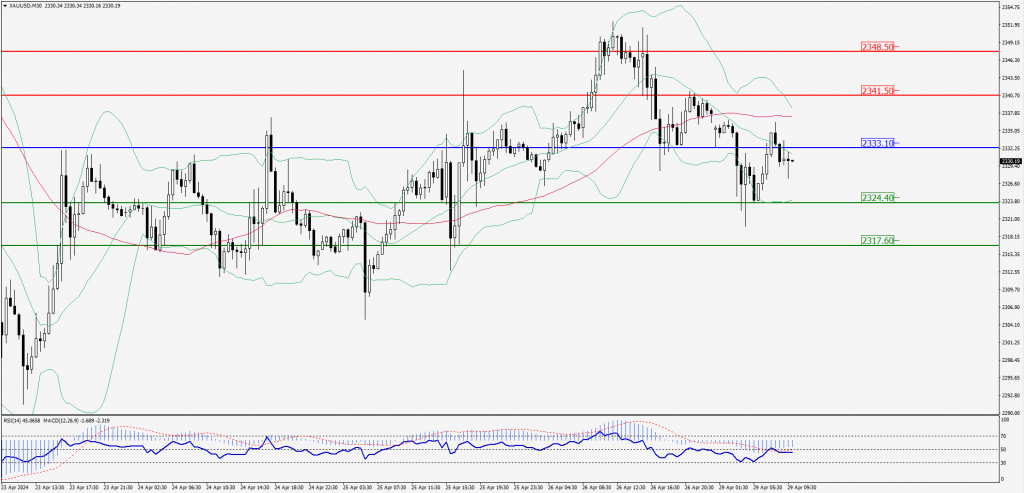
Green Lines Indicate Resistance Levels – Red Lines Indicate Support Levels
Light Blue is a Pivot Point – Black represents the price when the report was produced
Dow Jones Intraday: Trend on the upside
Our pivot point is 38,303.60
Preferable Price Action: Take buy positions above the pivot with targets at 38,434.90 & 38,529.00.
Alternative Price Action: Below 38,303.60 looks for further downside to 38,185.10 & 38,088.70.
Comment: RSI is at 50 levels and pairs above its 55MA.
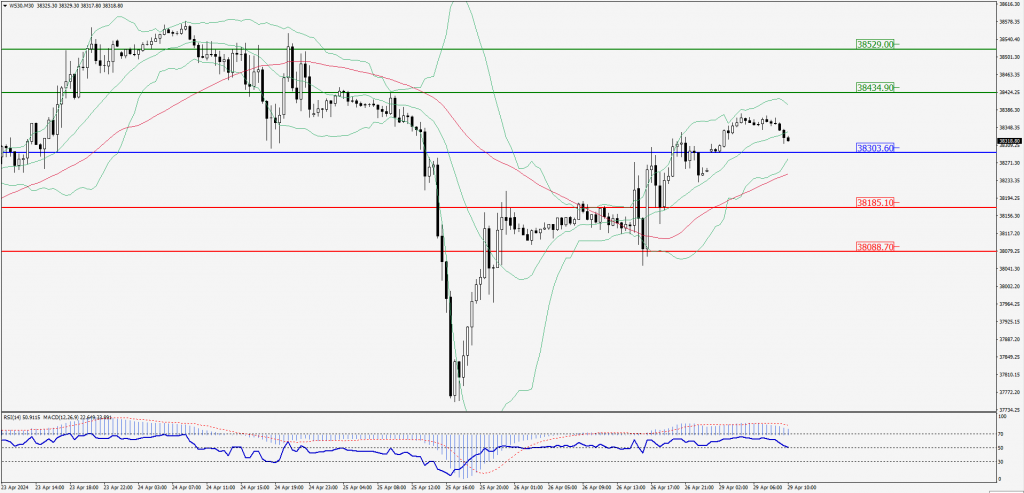
Green Lines Indicate Resistance Levels – Red Lines Indicate Support Levels
Light Blue is a Pivot Point – Black represents the price when the report was produced