Market Wrap: Stocks, Bonds, Commodities
US stocks fell on Tuesday as investors weighed chances that the Federal Reserve could delay cutting interest rates, while Tesla shares dropped after the electric car maker posted fewer quarterly deliveries for the first time in nearly four years.
The Dow Jones Industrial Average fell 396.61 points to 39,170.24, the S&P 500 lose 0.72% to 5,205.81 and the Nasdaq Composite slipped 156.38 points to 16,240.45.
MSCI’s index of Asia-Pacific stocks outside Japan is decline 0.79% to 655.61 levels. The Australian index was lower by 1.34% to 7,782.50. Japanese Nikkei Index ascend 0.98% today.
European stocks were mixed on Wednesday, with the Stoxx Europe 50 Index rose 0.24% to 5,065.75, Germany’s DAX ascend 0.30% to 18,345.25, and France’s CAC advance 0.31% to 8,155.16 and U.K.’s FTSE 100 lose 0.41% to 7,901.97.
Benchmark 10-year U.S. Treasury rose as demand for safe assets drop again, today 10-year bond yields positive 0.37% to 4.3840.
Global oil benchmark Brent on Tuesday rose above $89 a barrel for the first time since October, albeit briefly, as oil supplies faced fresh threats from Ukrainian attacks on Russian energy facilities and escalating conflict in the Middle East.
Spot Brent crude oil ascend 0.30% to $89.19 per barrel. US West Texas Intermediate crude is up 0.26% to $85.38 a barrel.
The yellow metal gold is advance 0.40% to 2,291.95 dollars per ounce.
Market Wrap: Forex
The dollar held near an over four-month peak on Wednesday, pinning the yen close to its lowest its decades though the heightened threat of currency intervention by Tokyo capped further declines in the Japanese currency.
Today, the U.S. dollar index measures the Greenback against a trade-weighted basket of six major currencies, which surged 0.01% to 104.565.
The Euro US Dollar (EUR/USD) is a widely traded pair that is down 0.02% today. This left the pair trading around $1.07650.
The Japanese yen was positive against the U.S. dollar on Wednesday. Today USD/JPY is surged 0.14% to the 151.750 level.
Another commodity-related currency negative against the U.S dollar, AUD/USD fell 0.14% to 0.65090, and NZD/USD slipped 0.09% to 0.59640 level.
EUR/USD Intraday: Trend on the upside
Our pivot point is at 1.07690
Preferable Price Action: Take buy positions above pivot level with targets at 1.07840 & 1.07970 in extension.
Alternative Price Action: Below pivot looks for a further downside to 1.07540 & 1.07420.
Comment: RSI is above 50 levels and pairs above 55MA.
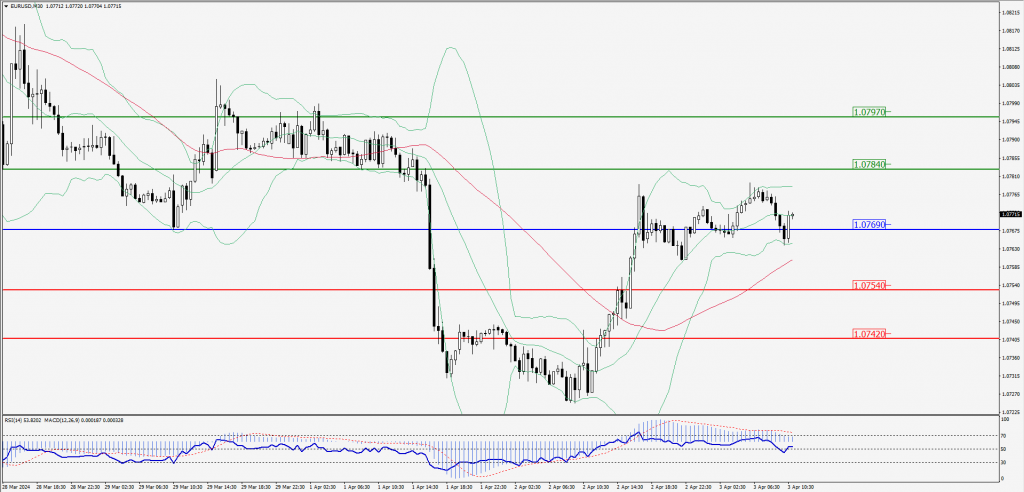
Green Lines Indicate Resistance Levels – Red Lines Indicate Support Levels
Light Blue is a Pivot Point – Black represents the price when the report was produced
GBP/USD Intraday: Resistance level at 1.25780
Our pivot point is at 1.25780
Preferable Price Action: Sell positions below pivot with targets at 1.25610 & 1.25470 in extension.
Alternative Price Action: The price above pivot would call for further upside to 1.25940 & 1.26080.
Comment: RSI is below 50 levels and pairs below 20MA.
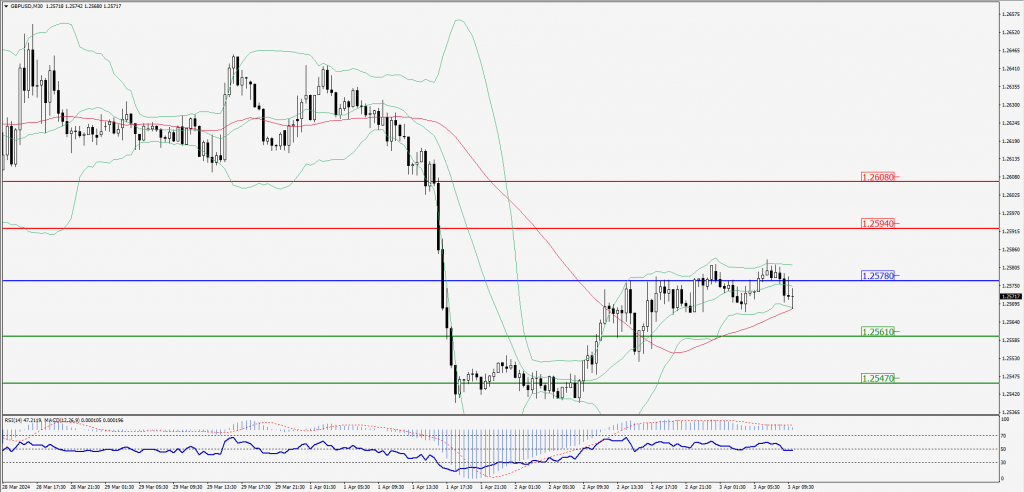
Green Lines Indicate Resistance Levels – Red Lines Indicate Support Levels
Light Blue is a Pivot Point – Black represents the price when the report was produced
USD/JPY Intraday: Trend on the upside
Our pivot point is at 151.680
Preferable Price Action: Buy position above pivot with the target at 151.770 and 151.830 in extension.
Alternative Price Action: The downside breakout of the pivot would call for 151.590 and 151.520.
Comment: MACD is above 50 levels and Pairs above its 20MA & 55MA.
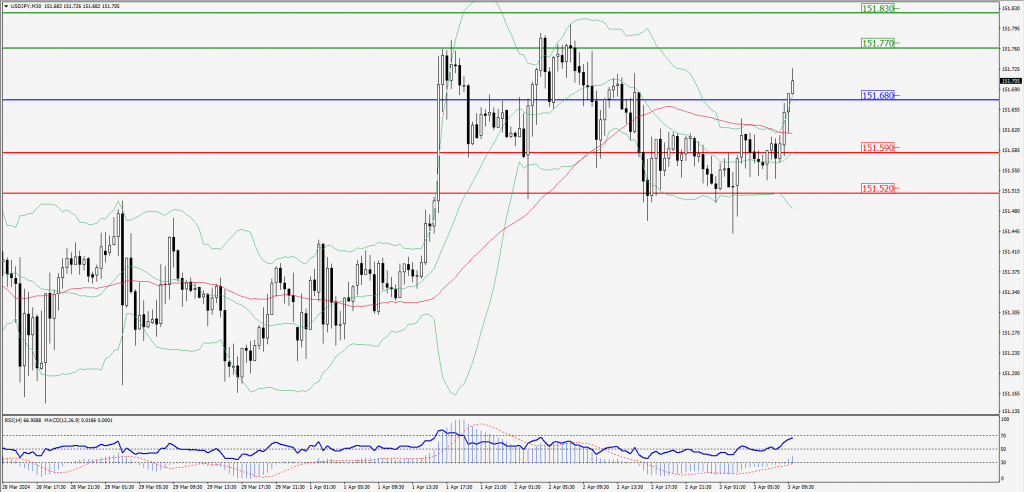
Green Lines Indicate Resistance Levels – Red Lines Indicate Support Levels
Light Blue is a Pivot Point – Black represents the price when the report was produced
AUD/USD Intraday: Trend on the downside
Our pivot point is at 0.65130
Preferable Price Action: Sell positions below pivot with targets at 0.65040 & 0.64970 in extension.
Alternative Price Action: Above pivot looks for a further upside with 0.65220 & 0.65290 as targets.
Comment: RSI is below 50 levels and pairs below 20MA.
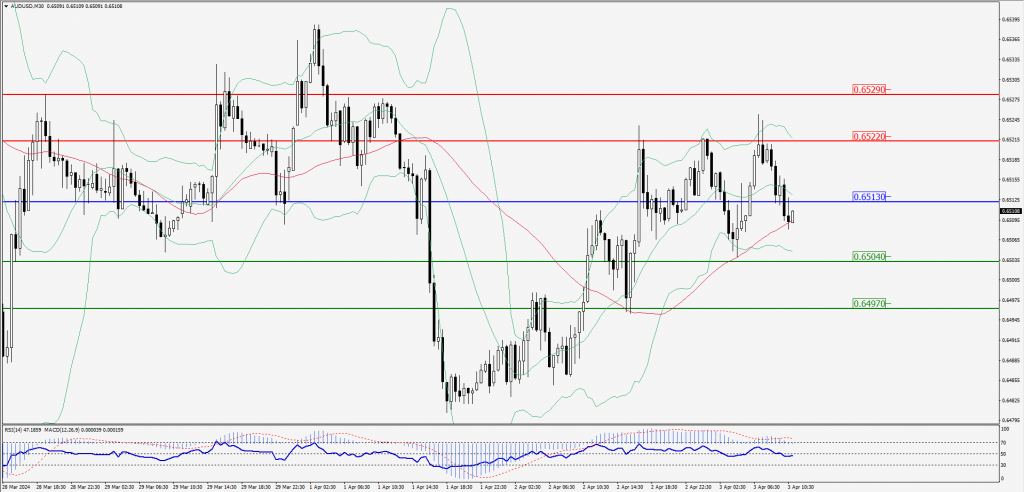
Green Lines Indicate Resistance Levels – Red Lines Indicate Support Levels
Light Blue is a Pivot Point – Black represents the price when the report was produced
CRUDEOIL Intraday: Support level at 84.46
Our pivot point is at 84.46
Preferable Price Action: Above pivot buy oil with 85.33 & 85.89 as targets.
Alternative Price Action: Sell crude below pivot with targets at 83.63 and 83.03 in extension.
Comment: MACD is positive territory and Pairs above 55MA.
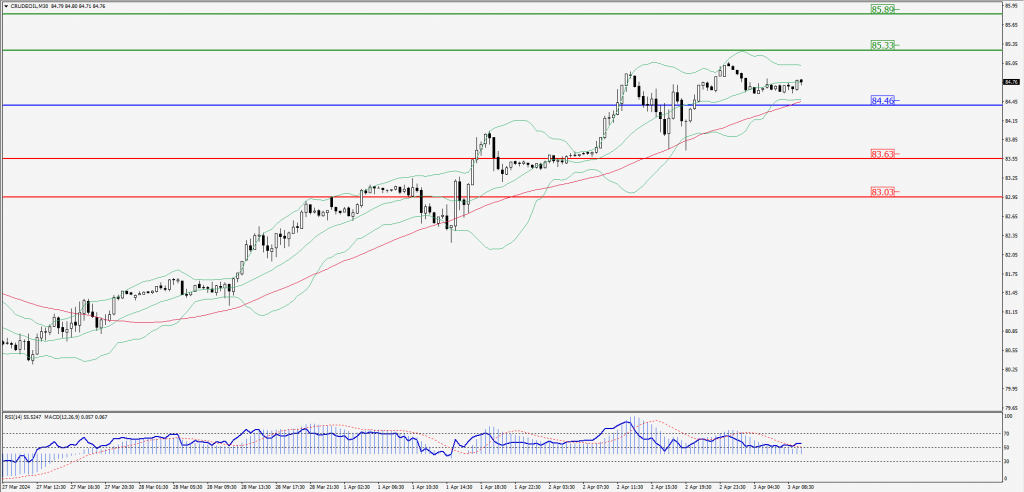
Green Lines Indicate Resistance Levels – Red Lines Indicate Support Levels
Light Blue is a Pivot Point – Black represents the price when the report was produced
XAU/USD Intraday: Trend on the downside
Our pivot point is 2280.00
Preferable Price Action: Further downside to 2263.80 and 2249.40.
Alternative Price Action: If the price gives an upside breakout of a pivot, then the price extends to 2296.00 and 2208.10.
Comment: MACD is below 50 levels and pairs below 20MA.
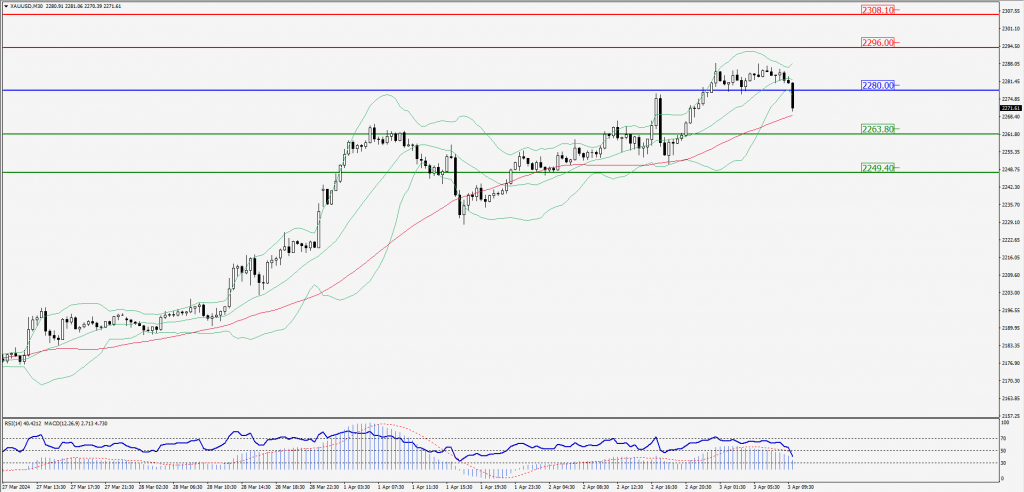
Green Lines Indicate Resistance Levels – Red Lines Indicate Support Levels
Light Blue is a Pivot Point – Black represents the price when the report was produced
Dow Jones Intraday: Trend on the downside
Our pivot point is 39,194.00
Preferable Price Action: Take sell positions below the pivot with targets at 39,045.30 & 38,918.30.
Alternative Price Action: Above 39,194.00 looks for further upside to 39,356.80 & 39,499.80.
Comment: RSI is below 50 levels and Pairs below 55MA.
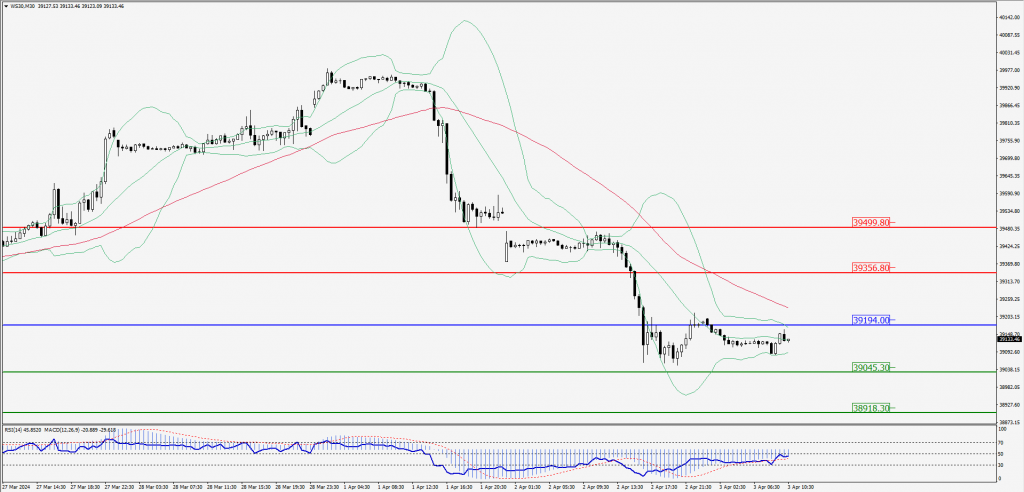
Green Lines Indicate Resistance Levels – Red Lines Indicate Support Levels
Light Blue is a Pivot Point – Black represents the price when the report was produced