Market Wrap: Stocks, Bonds, Commodities
Stock futures rose modestly on Thursday evening ahead of a key jobs report with Wall Street trying to shake off a sluggish start in January.
The Dow Jones Industrial Average fell 284.85 points to 37,430.19, the S&P 500 lose 0.80% to 4,704.81 and the Nasdaq Composite subtract 173.73 points to 14,592.21.
MSCI’s index of Asia-Pacific stocks outside Japan is advance 0.06% to 628.64 levels. The Australian index was lower by 0.39% to 7,494.10. Japanese Nikkei Index drop 0.56% today.
European stocks were positive on Friday, with the Stoxx Europe 50 Index rose 0.39% to 4,464.65, Germany’s DAX ascend 0.34% to 16,594.82, and France’s CAC advance 0.28% to 7,431.91 and U.K.’s FTSE 100 add 0.22% to 7,698.44.
Benchmark 10-year U.S. Treasury fell as deman for safe assets ascend again, today 10-year bond yields positive 0.70% to 3.9320.
Oil prices fell 2 percent on Friday, largely unwinding an earlier rally, as massive weekly gasoline and distillate stock builds overshadowed a larger-than-expected crude stock draw.
Spot Brent crude oil ascend 1.09% to $79.10 per barrel. US West Texas Intermediate crude is down 1.36% to $73.69 a barrel.
The yellow metal gold is advance 0.62% to 2,055.65 dollars per ounce.
Market Wrap: Forex
The U.S. dollar gained in early European trade Friday, on course for its strongest week since July ahead of the release of the widely-watched monthly official jobs report.
Today, the U.S. dollar index measures the Greenback against a trade-weighted basket of six major currencies, which slipped 0.23% to 101.965.
The Euro US Dollar (EUR/USD) is a widely traded pair that is up 0.35% today. This left the pair trading around $1.09580.
The Japanese yen was negative against the U.S. dollar on Friday. Today USD/JPY is surged 0.37% to the 143.810 level.
Another commodity-related currency positive against the U.S dollar, AUD/USD rose 0.30% to 0.67500, and NZD/USD surged 0.30% to 0.62660 level.
EUR/USD Intraday: Trend on the downside
Preferable Price Action: Take sell positions below pivot level with targets at 1.09040 & 1.08820 in extension.
Alternative Price Action: Above pivot looks for a further upside to 1.09740 & 1.09970.
Comment: RSI is below 50 levels and Pairs below its 20MA & 55MA.
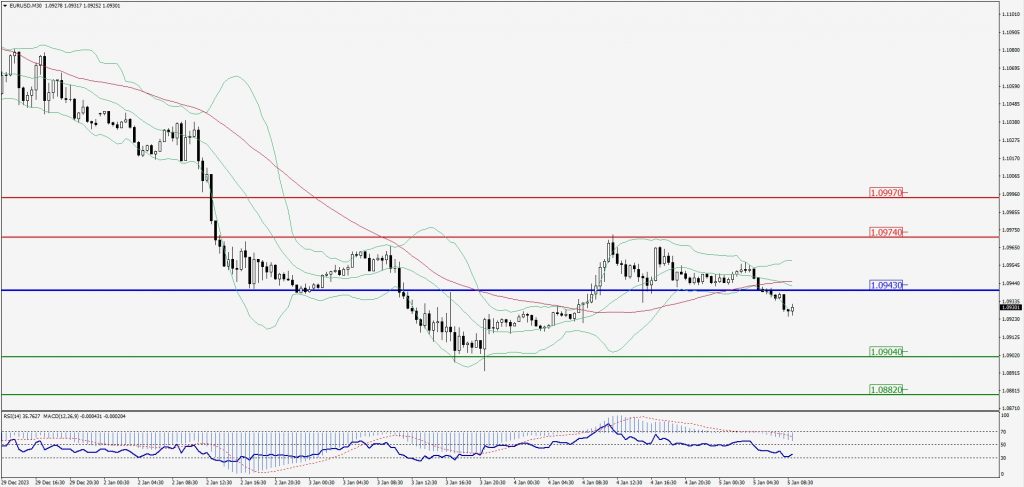
Green Lines Indicate Resistance Levels – Red Lines Indicate Support Levels
Light Blue is a Pivot Point – Black represents the price when the report was produced
GBP/USD Intraday: Resistance level at 1.26860
Our pivot point is at 1.26860
Preferable Price Action: Sell positions below pivot with targets at 1.26530 & 1.26320 in extension.
Alternative Price Action: The price above pivot would call for further upside to 1.27120 & 1.27320.
Comment: RSI is below 50 levels and Pairs below its 20MA & 55MA.
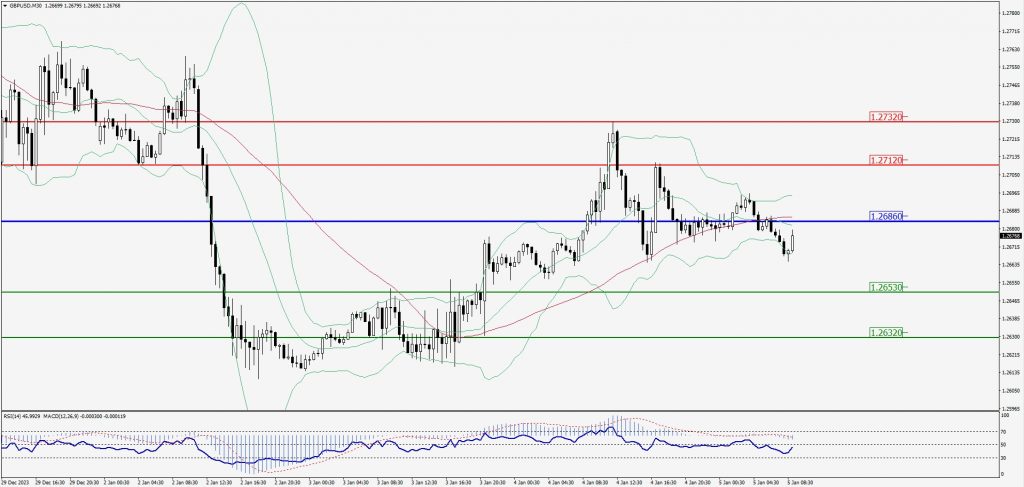
Green Lines Indicate Resistance Levels – Red Lines Indicate Support Levels
Light Blue is a Pivot Point – Black represents the price when the report was produced
USD/JPY Intraday: Major trend on the upside
Our pivot point is at 144.850
Preferable Price Action: Buy position above pivot with the target at 145.630 and 146.130 in extension.
Alternative Price Action: The downside breakout of the pivot would call for 144.190 and 143.690.
Comment: MACD is above 50 level and Pairs above its 20MA & 55MA.
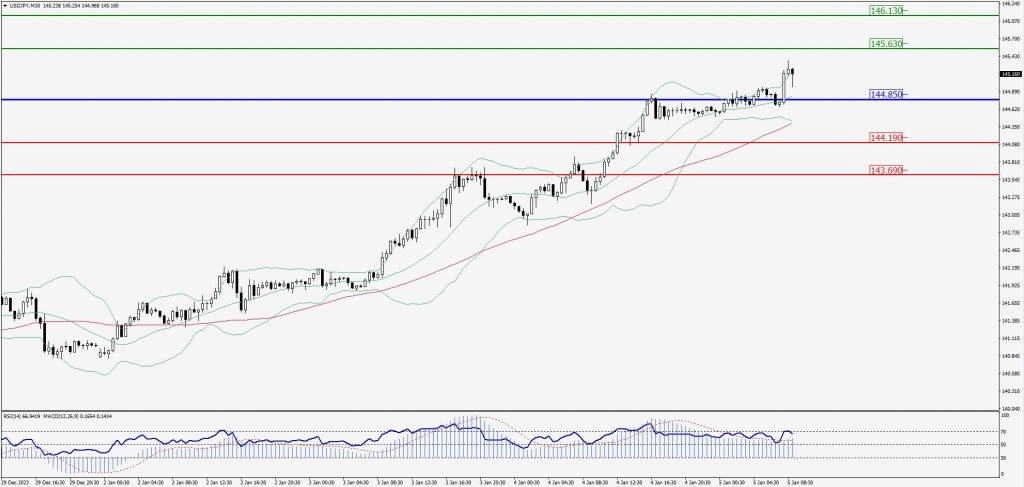
Green Lines Indicate Resistance Levels – Red Lines Indicate Support Levels
Light Blue is a Pivot Point – Black represents the price when the report was produced
AUD/USD Intraday: In a consolidation zone
Our pivot point is at 0.67140
Preferable Price Action: Sell positions below pivot with targets at 0.66900 & 0.66740 in extension.
Alternative Price Action: Above pivot looks for a further upside with 0.67360 & 0.67560 as targets.
Comment: RSI is at 50 levels and Pairs below 55MA.
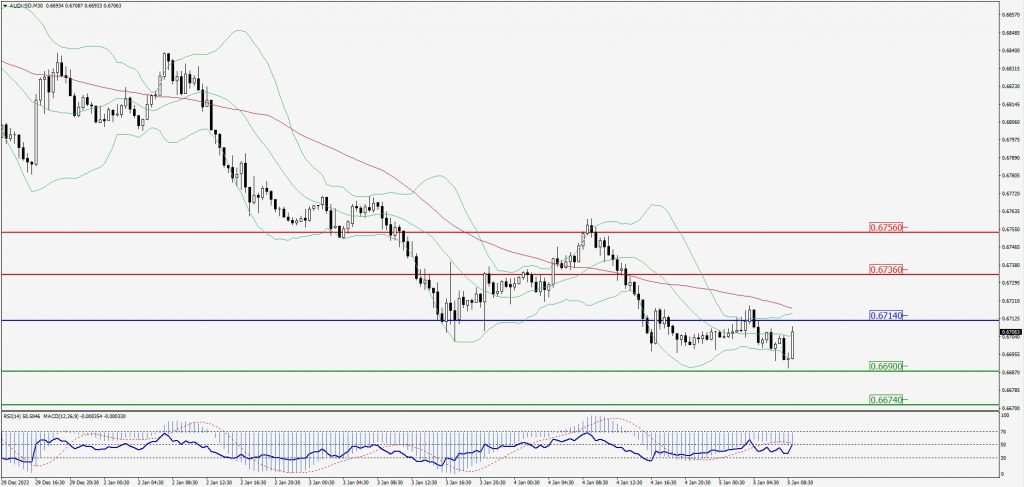
Green Lines Indicate Resistance Levels – Red Lines Indicate Support Levels
Light Blue is a Pivot Point – Black represents the price when the report was produced
CRUDEOIL Intraday: In a consolidation zone
Our pivot point is at 72.61
Preferable Price Action: Above pivot buy oil with 73.37 & 73.83 as targets.
Alternative Price Action: Sell crude below pivot with targets at 71.99 and 71.55 in extension.
Comment: MACD is positive territory and Pairs above 20MA.
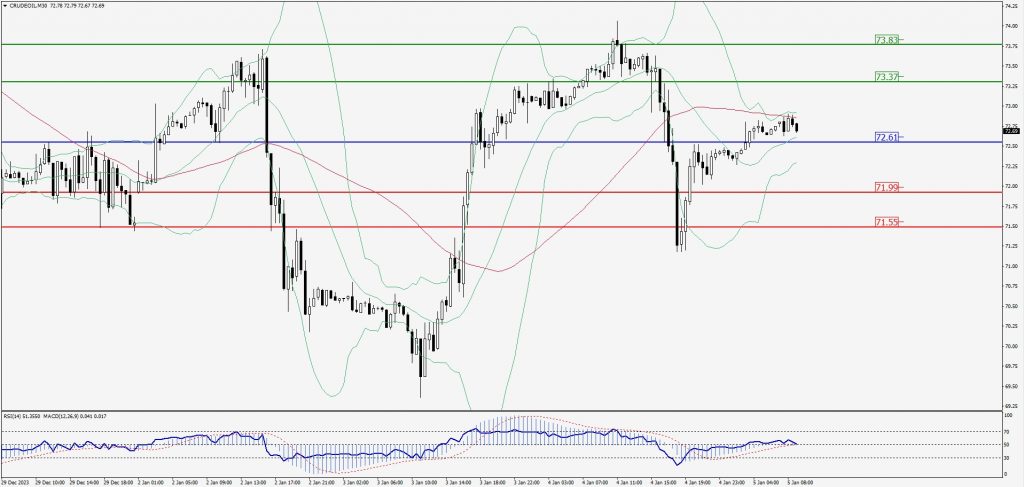
Green Lines Indicate Resistance Levels – Red Lines Indicate Support Levels
Light Blue is a Pivot Point – Black represents the price when the report was produced
XAU/USD Intraday: Trend on the upside
Our pivot point is 2043.70
Preferable Price Action: Further upside to 2050.80 and 2055.90.
Alternative Price Action: If the price gives a downside breakout of a pivot, then the price extends to 2037.80 and 2033.10.
Comment: MACD is at 50 level.
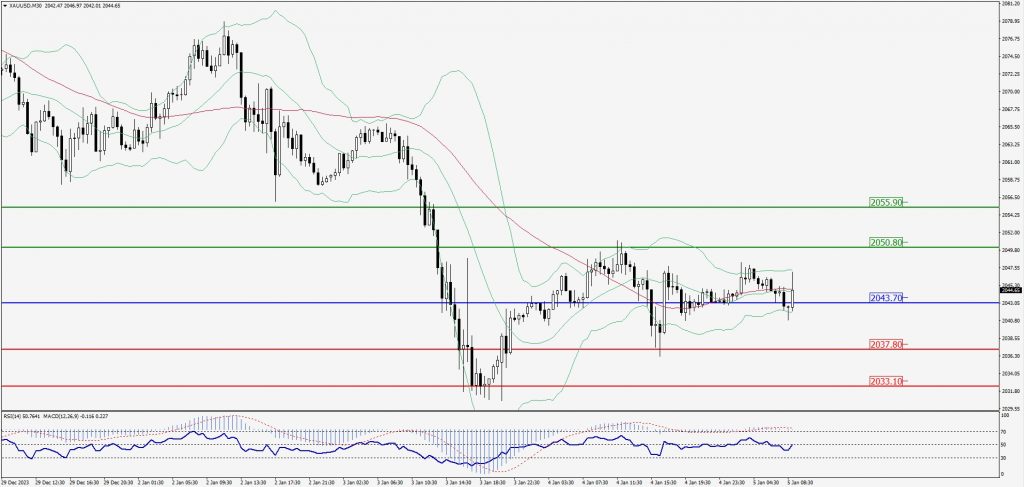
Green Lines Indicate Resistance Levels – Red Lines Indicate Support Levels
Light Blue is a Pivot Point – Black represents the price when the report was produced
Dow Jones Intraday: Trend on the downside
Our pivot point is 37,486.00
Preferable Price Action: Take sell positions below the pivot with targets at 37,411.00 & 37,374.00.
Alternative Price Action: Above 37,486.00 looks for further upside to 37,545.00 & 37,591.00.
Comment: RSI is below 50 levels and Pairs below its 20MA & 55MA.
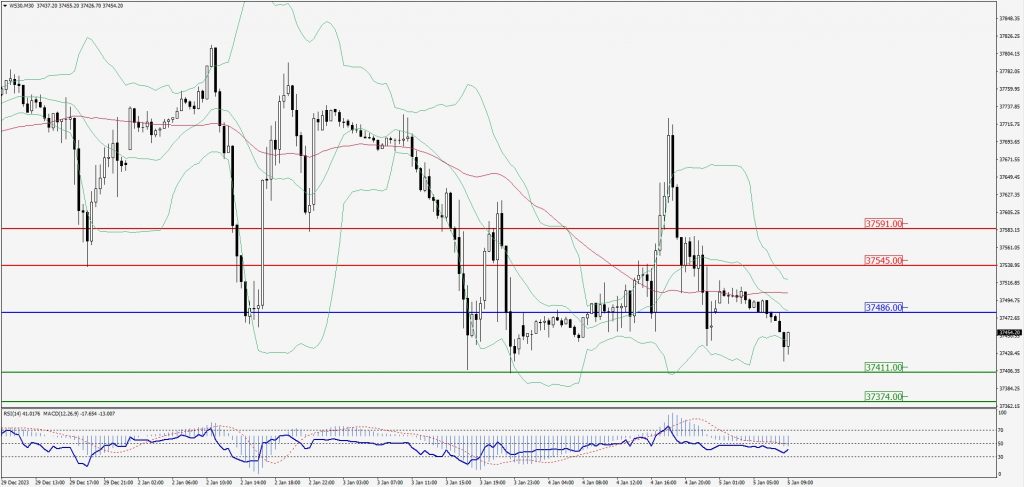
Green Lines Indicate Resistance Levels – Red Lines Indicate Support Levels
Light Blue is a Pivot Point – Black represents the price when the report was produced