Market Wrap: Stocks, Bonds, Commodities
US stocks closed higher on Thursday, winning back much of the previous day’s losses, as economic data fuelled optimism that the Federal Reserve would ease monetary policy and revived investor risk appetite.
The Dow Jones Industrial Average rose 322.35 points to 37,404.35, the S&P 500 gain 1.03% to 4,746.75 and the Nasdaq Composite add 185.92 points to 14,963.87.
MSCI’s index of Asia-Pacific stocks outside Japan is decline 0.64% to 619.15 levels. The Australian index was lower by 0.03% to 7,501.60. Japanese Nikkei Index ascend 0.03% today.
European stocks were negative on Friday, with the Stoxx Europe 50 Index fell 0.22% to 4,523.85, Germany’s DAX drop 0.27% to 16,687.42, and France’s CAC decline 0.16% to 7,571.40 and U.K.’s FTSE 100 subtract 0.27% to 7,694.73.
Benchmark 10-year U.S. Treasury fell as deman for safe assets ascend again, today 10-year bond yields positive 0.02% to 3.8850.
Oil prices fell by roughly $1 a barrel on December 21 after Angola said it would exit the Organization of the Petroleum Exporting Countries (OPEC), raising questions about the producer group’s efforts to support prices by limiting global supplies.
Spot Brent crude oil ascend 0.93% to $80.13 per barrel. US West Texas Intermediate crude is up 0.96% to $74.60 a barrel.
The yellow metal gold is advance 0.46% to 2,060.60 dollars per ounce.
Market Wrap: Forex
The U.S. dollar edged lower in early European trade Thursday ahead of key growth data, while sterling continued to fall in the wake of rapidly cooling U.K. inflation.
Today, the U.S. dollar index measures the Greenback against a trade-weighted basket of six major currencies, which slipped 0.01% to 101.460.
The Euro US Dollar (EUR/USD) is a widely traded pair that is down 0.08% today. This left the pair trading around $1.09990.
The Japanese yen was negative against the U.S. dollar on Friday. Today USD/JPY is surged 0.13% to the 142.280 level.
Another commodity-related currency negative against the U.S dollar, AUD/USD fell 0.29% to 0.67800, and NZD/USD slipped 0.16% to 0.62820 level.
EUR/USD Intraday: In a consolidation zone
Preferable Price Action: Take buy positions above pivot level with targets at 1.10140 & 1.10290 in extension.
Alternative Price Action: Below pivot looks for a further downside to 1.09730 & 1.09600.
Comment: RSI is at 50 levels and Pairs above 55MA.
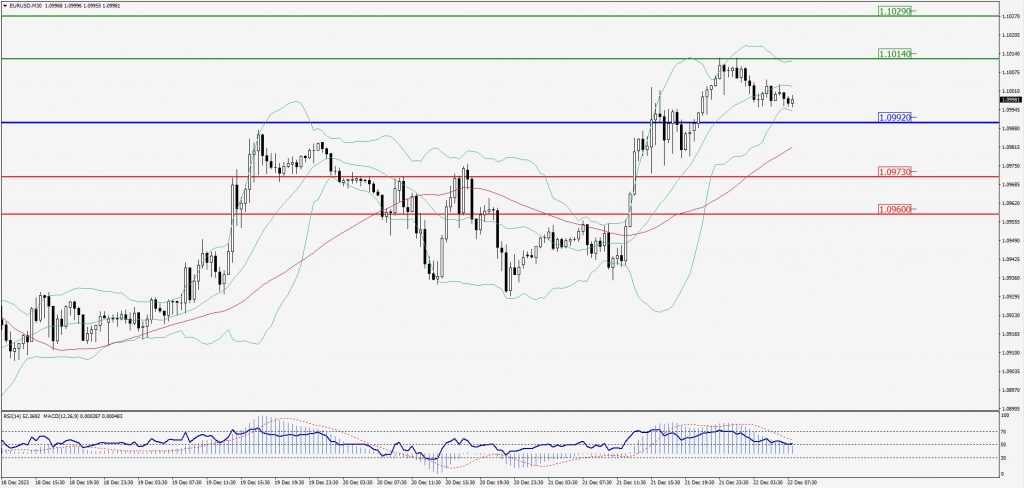
Green Lines Indicate Resistance Levels – Red Lines Indicate Support Levels
Light Blue is a Pivot Point – Black represents the price when the report was produced
GBP/USD Intraday: Trend on the upside
Our pivot point is at 1.26770
Preferable Price Action: Buy positions above pivot with targets at 1.27070 & 1.27240 in extension.
Alternative Price Action: The price below pivot would call for further downside to 1.26520 & 1.26370.
Comment: RSI is above 50 levels and Pairs above 55MA.
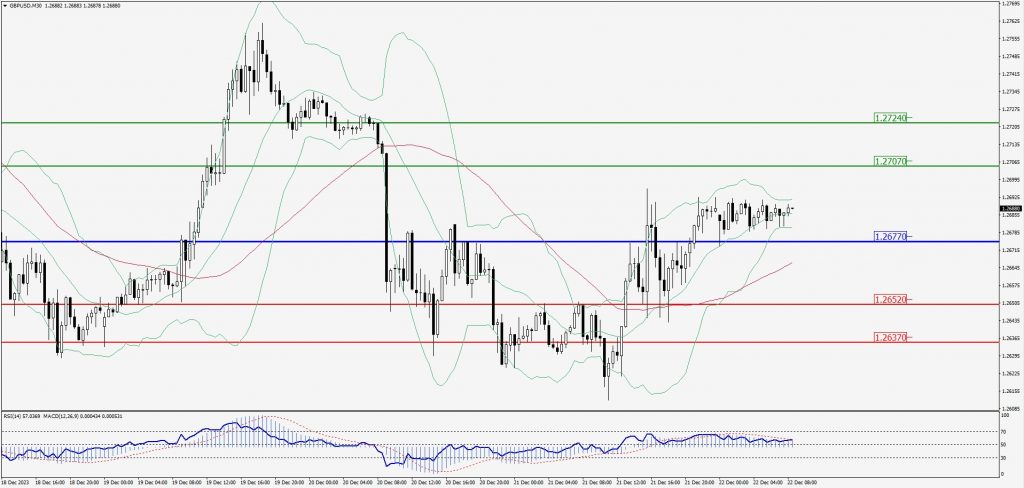
Green Lines Indicate Resistance Levels – Red Lines Indicate Support Levels
Light Blue is a Pivot Point – Black represents the price when the report was produced
USD/JPY Intraday: Resistance level at 142.590
Our pivot point is at 142.590
Preferable Price Action: Sell position below pivot with the target at 141.900 and 141.560 in extension.
Alternative Price Action: The upside breakout of the pivot would call for 143.130 and 143.530.
Comment: MACD is below 50 level and Pairs below 55MA.
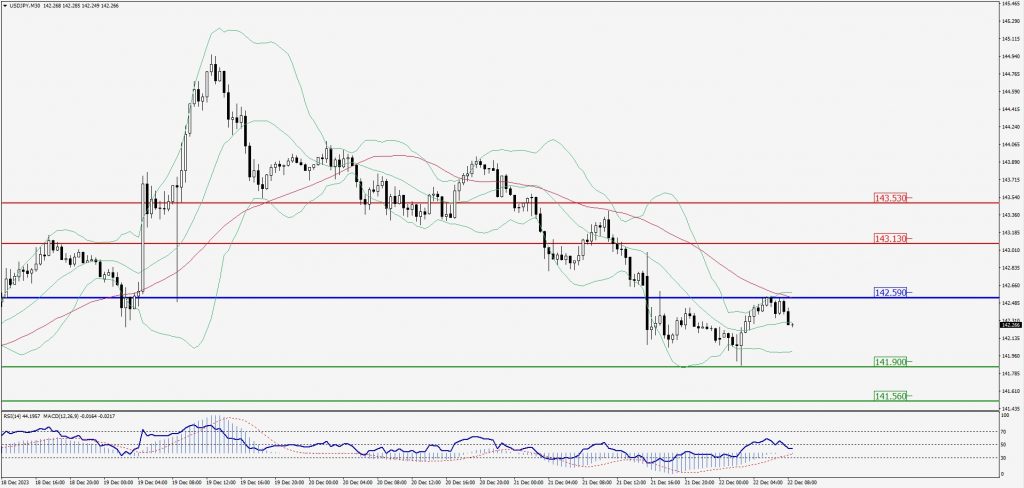
Green Lines Indicate Resistance Levels – Red Lines Indicate Support Levels
Light Blue is a Pivot Point – Black represents the price when the report was produced
AUD/USD Intraday: Trend on the downside
Our pivot point is at 0.67850
Preferable Price Action: Sell positions below pivot with targets at 0.67620 & 0.67460 in extension.
Alternative Price Action: Above pivot looks for a further upside with 0.68070 & 0.68230 as targets.
Comment: RSI is below 50 levels and Pairs below 20MA.
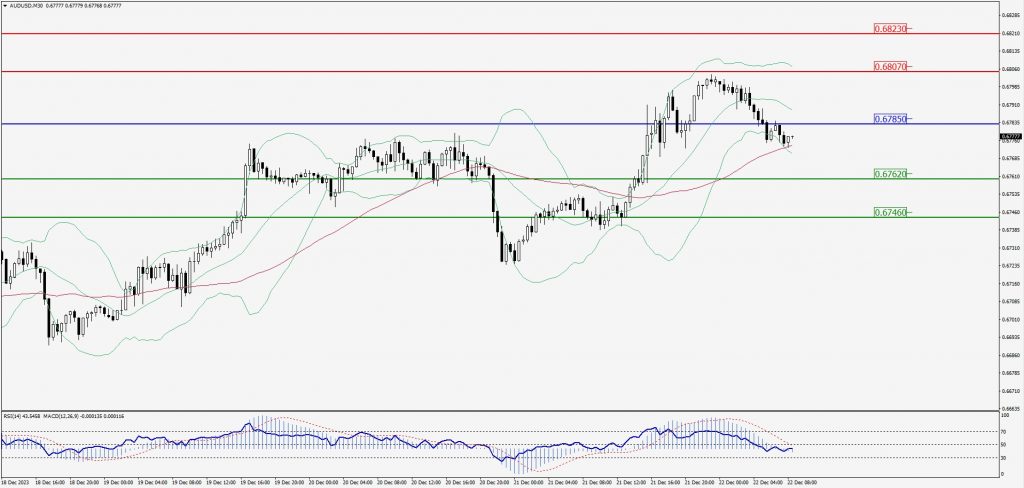
Green Lines Indicate Resistance Levels – Red Lines Indicate Support Levels
Light Blue is a Pivot Point – Black represents the price when the report was produced
CRUDEOIL Intraday: Trend on the upside
Our pivot point is at 74.27
Preferable Price Action: Above pivot buy oil with 75.14 & 75.73 as targets.
Alternative Price Action: Sell crude below pivot with targets at 73.52 and 72.96 in extension.
Comment: MACD is positive territory and Pairs above its 20MA & 55MA.
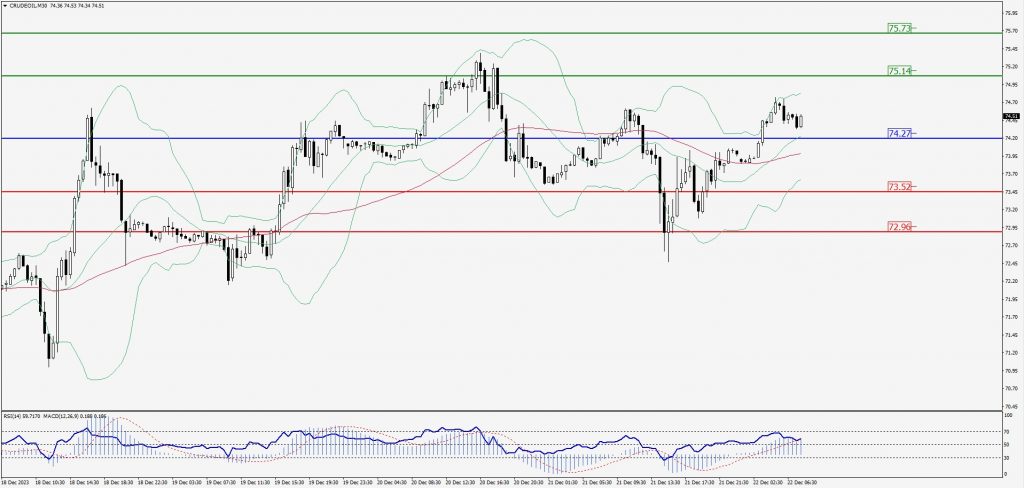
Green Lines Indicate Resistance Levels – Red Lines Indicate Support Levels
Light Blue is a Pivot Point – Black represents the price when the report was produced
XAU/USD Intraday: Trend on the upside
Our pivot point is 2047.20
Preferable Price Action: Further upside to 2053.50 and 2057.80.
Alternative Price Action: If the price gives a downside breakout of a pivot, then the price extends to 2042.10 and 2038.40.
Comment: MACD is above 50 level and Pairs above 55MA.
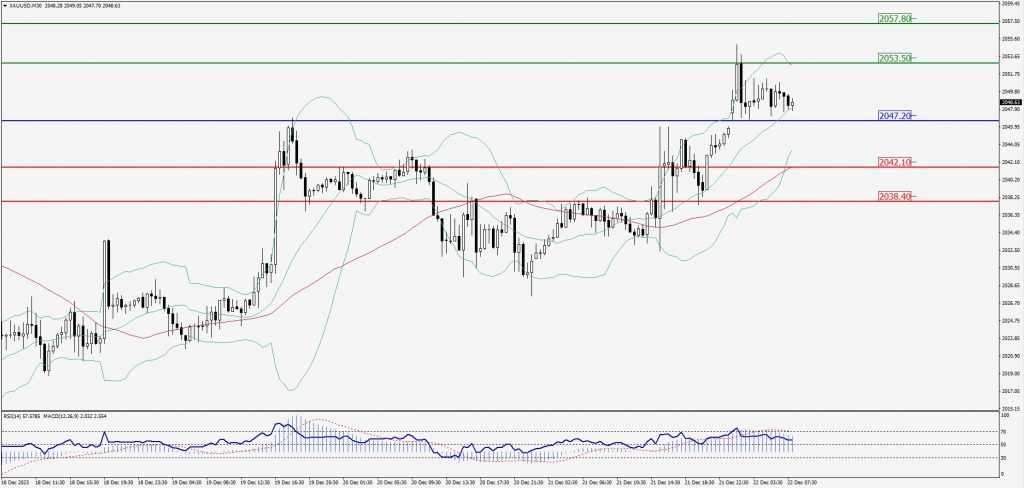
Green Lines Indicate Resistance Levels – Red Lines Indicate Support Levels
Light Blue is a Pivot Point – Black represents the price when the report was produced
Dow Jones Intraday: Trend on the downside
Our pivot point is 37,312.00
Preferable Price Action: Take sell positions below the pivot with targets at 37,201.00 & 37,130.00.
Alternative Price Action: Above 37,312.00 looks for further upside to 37,407.00 & 37,483.00.
Comment: RSI is below 50 levels and Pairs below 20MA.
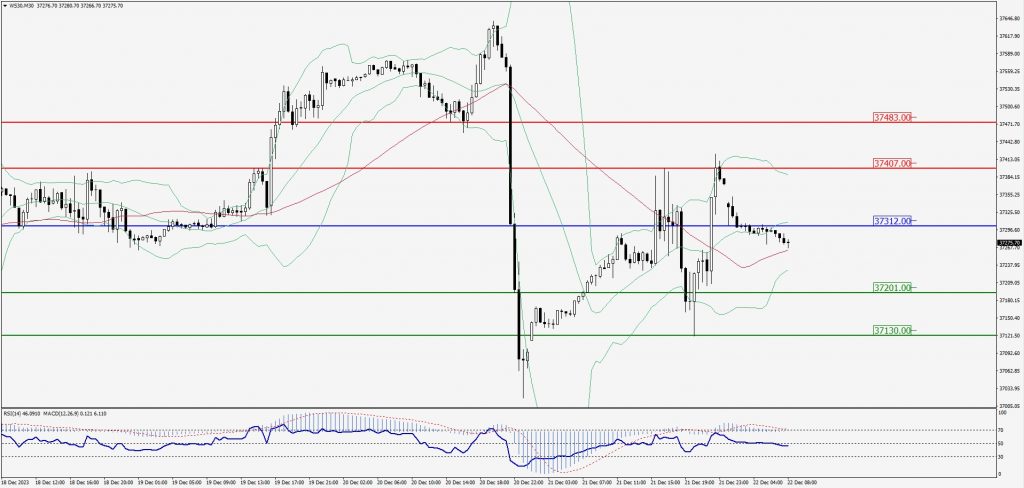
Green Lines Indicate Resistance Levels – Red Lines Indicate Support Levels
Light Blue is a Pivot Point – Black represents the price when the report was produced