Market Wrap: Stocks, Bonds, Commodities
Stock futures are flat Monday night as traders analyzed the strong gains seen throughout November and the trading month nears its end.
The Dow Jones Industrial Average fell 56.68 points to 35,333.47, the S&P 500 lose 0.20% to 4,550.43 and the Nasdaq Composite subtract 9.83 points to 14,241.02.
MSCI’s index of Asia-Pacific stocks outside Japan is advance 0.40% to 618.63 levels. The Australian index was higher by 0.39% to 7,015.20. Japanese Nikkei Index drop 0.11% today.
European stocks were negative on Tuesday, with the Stoxx Europe 50 Index fell 0.39% to 4,355.15, Germany’s DAX drop 0.39% to 15,966.37, and France’s CAC decline 0.37% to 7,265.49 and U.K.’s FTSE 100 subtract 0.37% to 7,460.70.
Benchmark 10-year U.S. Treasury fell as demand for safe assets ascend again, today 10-year bond yields negative 0.23% to 4.3790.
Oil prices slipped on Monday as investors waited for an OPEC+ meeting later this week for an agreement expected to curb supplies into 2024.
Spot Brent crude oil ascend 0.18% to $80.01 per barrel. US West Texas Intermediate crude is up 0.15% to $74.97 a barrel.
The yellow metal gold is advance 0.07% to 2,013.80 dollars per ounce.
Market Wrap: Forex
The dollar slipped against a basket of currencies on Friday on news of steady U.S. business activity in November, but private sector employment declined in line with expectations for a fourth-quarter economic slowdown.
Today, the U.S. dollar index measures the Greenback against a trade-weighted basket of six major currencies, which surged 0.10% to 103.207.
The Euro US Dollar (EUR/USD) is a widely traded pair that is down 0.14% today. This left the pair trading around $1.09380.
The Japanese yen was negative against the U.S. dollar on Tuesday. Today USD/JPY is slipped 0.14% to the 148.470 level.
Another commodity-related currency negative against the U.S dollar, AUD/USD fell 0.01% to 0.66070, and NZD/USD slipped 0.07% to 0.60920 level.
EUR/USD Intraday: Trend on the downside
Our pivot point is at 1.09570
Preferable Price Action: Take sell positions below pivot level with targets at 1.09280 & 1.09120 in extension.
Alternative Price Action: Above pivot looks for a further upside to 1.09820 & 1.09970.
Comment: RSI is below 50 levels and Pairs below 20MA.
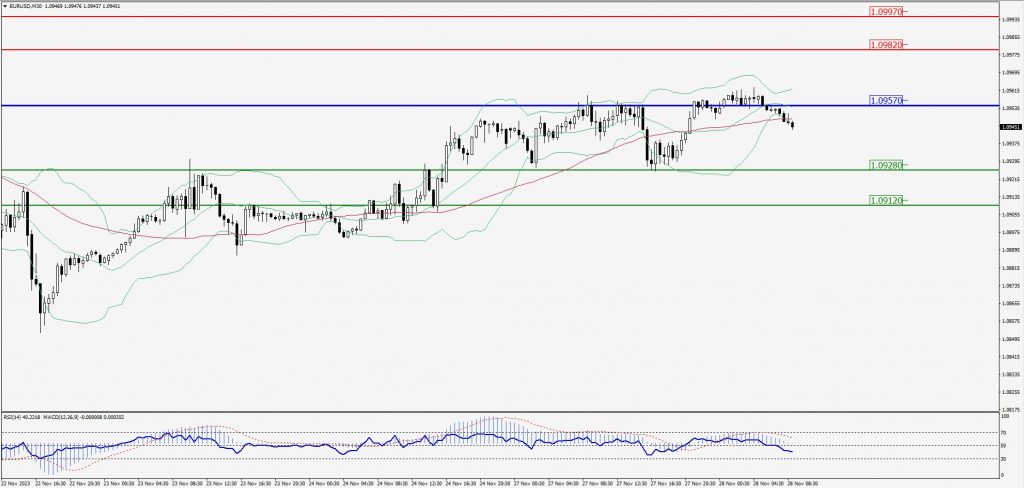
Green Lines Indicate Resistance Levels – Red Lines Indicate Support Levels
Light Blue is a Pivot Point – Black represents the price when the report was produced
GBP/USD Intraday: Resistance level at 1.26360
Our pivot point is at 1.26360
Preferable Price Action: Sell positions below pivot with targets at 1.25910 & 1.25640 in extension.
Alternative Price Action: The price above pivot would call for further upside to 1.26750 & 1.27000.
Comment: RSI is below 50 levels and Pairs below 55MA.
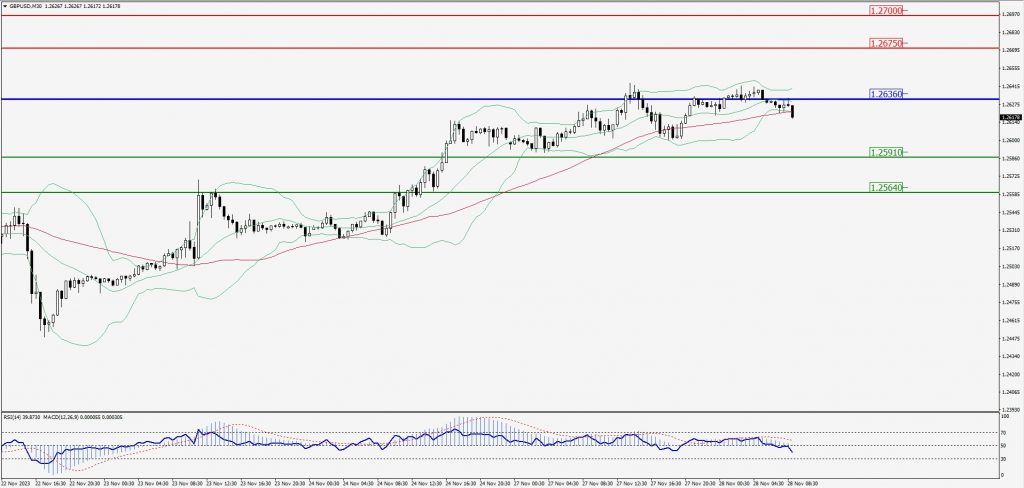
Green Lines Indicate Resistance Levels – Red Lines Indicate Support Levels
Light Blue is a Pivot Point – Black represents the price when the report was produced
USD/JPY Intraday: In a consolidation zone
Our pivot point is at 148.190
Preferable Price Action: Buy position above pivot with the target at 148.820 and 149.300 in extension.
Alternative Price Action: The downside breakout of the pivot would call for 147.570 and 147.170.
Comment: MACD is at 50 level and Pairs above 20MA.
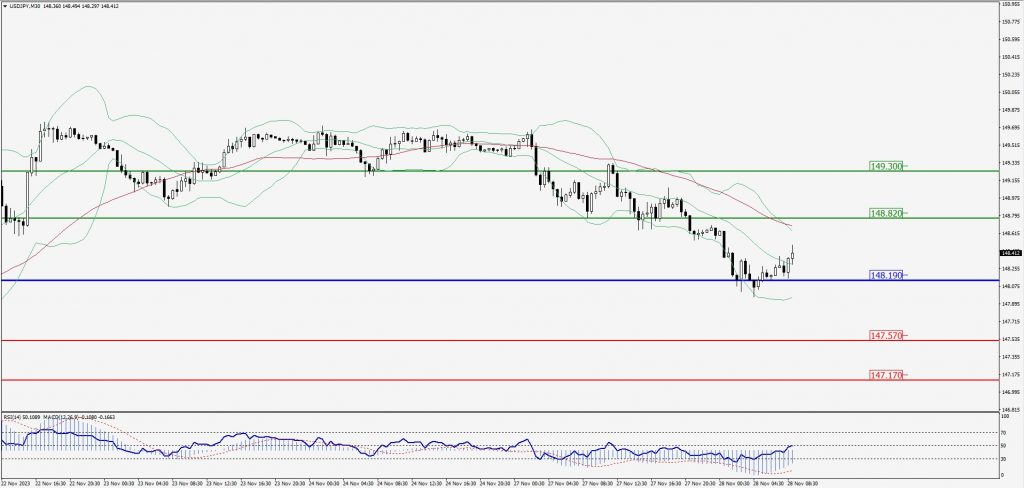
Green Lines Indicate Resistance Levels – Red Lines Indicate Support Levels
Light Blue is a Pivot Point – Black represents the price when the report was produced
AUD/USD Intraday: Trend on the downside
Our pivot point is at 0.66210
Preferable Price Action: Sell positions below pivot with targets at 0.65940 & 0.65770 in extension.
Alternative Price Action: Above pivot looks for a further upside with 0.66430 & 0.66610 as targets.
Comment: RSI is below 50 levels and Pairs below 55MA.
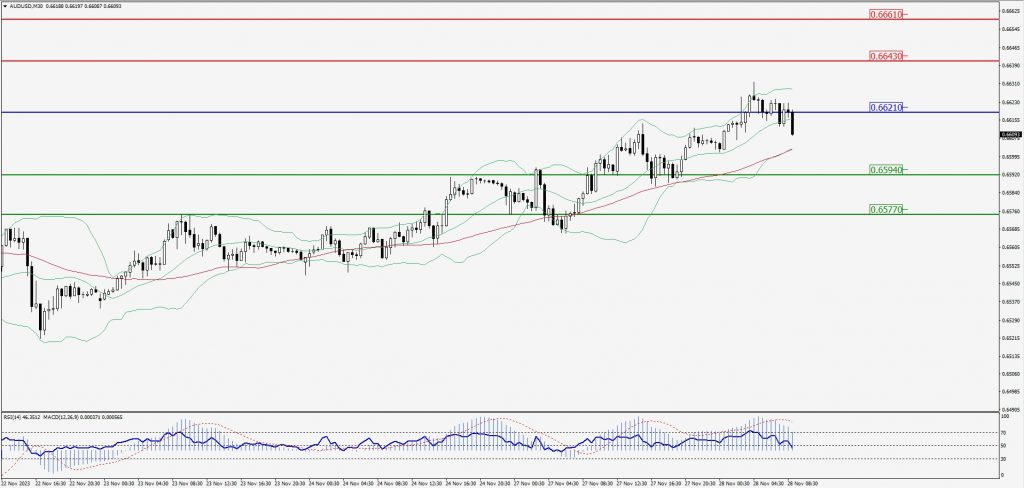
Green Lines Indicate Resistance Levels – Red Lines Indicate Support Levels
Light Blue is a Pivot Point – Black represents the price when the report was produced
CRUDEOIL Intraday: Resistance level at 75.29
Our pivot point is at 75.29
Preferable Price Action: Below pivot sell oil with 74.52 & 74.03 as targets.
Alternative Price Action: Buy crude above pivot with targets at 75.94 and 76.45 in extension.
Comment: MACD is negative territory and Pairs below 20MA.
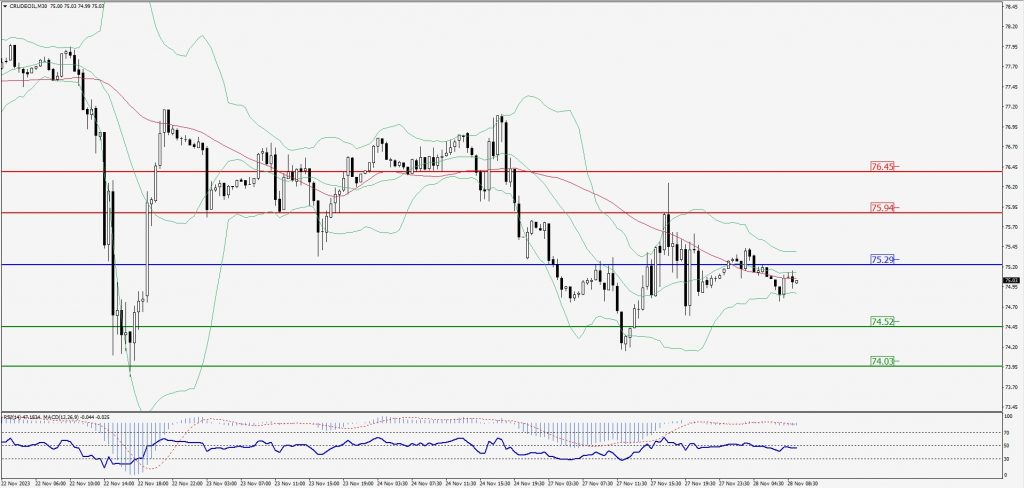
Green Lines Indicate Resistance Levels – Red Lines Indicate Support Levels
Light Blue is a Pivot Point – Black represents the price when the report was produced
XAU/USD Intraday: Trend on the upside
Our pivot point is 2014.10
Preferable Price Action: Further upside to 2020.30 and 2024.30.
Alternative Price Action: If the price gives a downside breakout of a pivot, then the price extends to 2008.90 and 2005.50.
Comment: MACD is above 50 level and Pairs above 55MA.
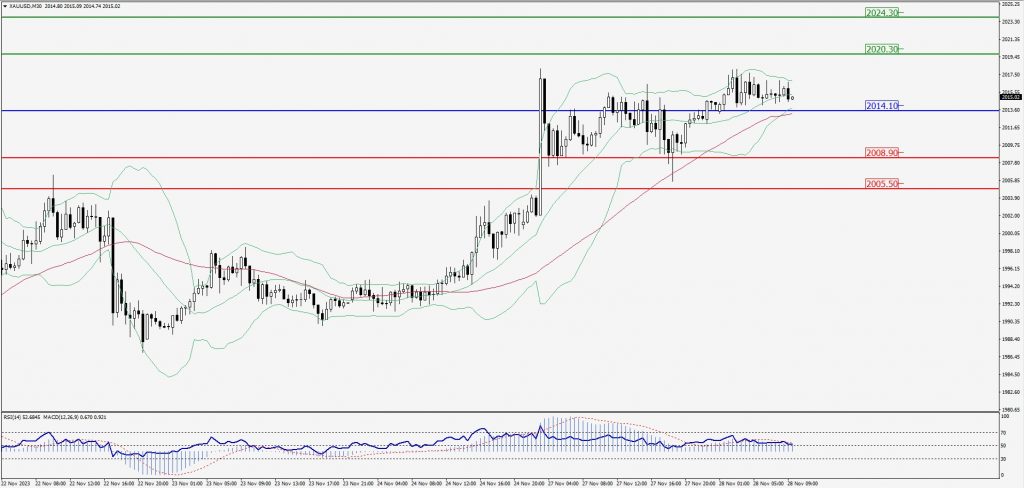
Green Lines Indicate Resistance Levels – Red Lines Indicate Support Levels
Light Blue is a Pivot Point – Black represents the price when the report was produced
Dow Jones Intraday: Trend on the downside
Our pivot point is 35,356.00
Preferable Price Action: Take sell positions below the pivot with targets at 35,301.00 & 35,268.00.
Alternative Price Action: Above 35,356.00 looks for further upside to 35,404.00 & 35,438.00.
Comment: RSI is below 50 levels and Pairs below 55MA.
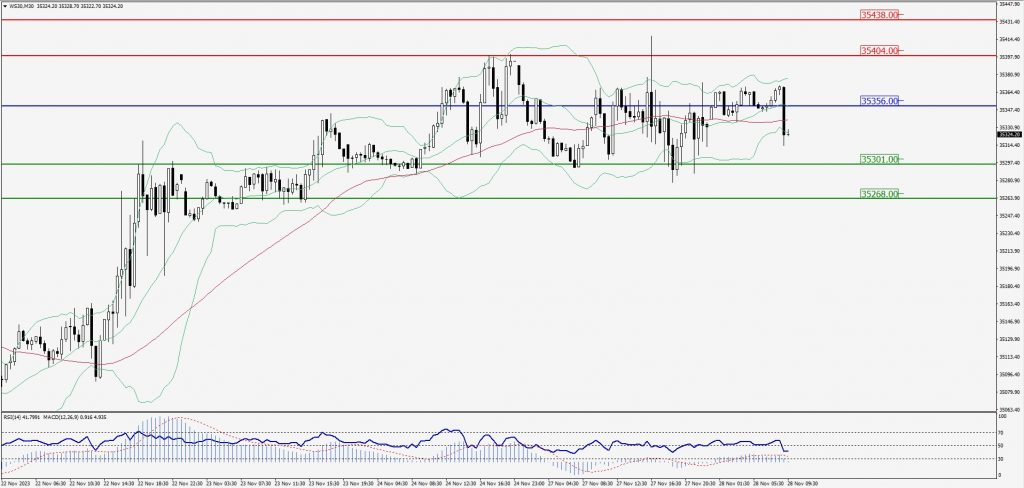
Green Lines Indicate Resistance Levels – Red Lines Indicate Support Levels
Light Blue is a Pivot Point – Black represents the price when the report was produced