Market Wrap: Stocks, Bonds, Commodities
S&P 500 futures inched higher Thursday night as investors shifted focus from the Federal Reserve’s policy decision to the latest batch of corporate earnings reports.
The Dow Jones Industrial Average rose 221.71 points to 33,274.58, the S&P 500 gain 1.05% to 4,237.86 and the Nasdaq Composite add 210.23 points to 13,061.47.
MSCI’s index of Asia-Pacific stocks outside Japan is advance 1.58% to 588.88 levels. The Australian index was higher by 0.90% to 6,899.70. Japanese Nikkei Index ascend 1.20% today.
European stocks were positive on Thursday, with the Stoxx Europe 50 Index rose 1.76% to 4,163.85, Germany’s DAX ascend 1.62% to 15,162.05, and France’s CAC advance 1.71% to 7,050.85 and U.K.’s FTSE 100 add 1.28% to 7,436.06.
Benchmark 10-year U.S. Treasury fell as demand for safe assets ascend again, today 10-year bond yields negative 1.50% to 4.7170.
Oil prices edged higher Wednesday ahead of key meetings of global central banks this week, including the US Federal Reserve, while the market closely watched the latest developments in the Israel-Hamas conflict.
Spot Brent crude oil ascend 1.71% to $86.08 per barrel. US West Texas Intermediate crude is up 1.84% to $81.92 a barrel.
The yellow metal gold is advance 0.46% to 1,996.55 dollars per ounce.
Market Wrap: Forex
The U.S. dollar fell against most currencies on Wednesday as investors perceived that Federal Reserve Chairman Jerome Powell’s statements after its two-day policy meeting suggested the U.S. central bank may be done raising interest rates.
Today, the U.S. dollar index measures the Greenback against a trade-weighted basket of six major currencies, which slipped 0.63% to 106.030.
The Euro US Dollar (EUR/USD) is a widely traded pair that is up 0.48% today. This left the pair trading around $1.06200.
The Japanese yen was negative against the U.S. dollar on Thursday. Today USD/JPY is slipped 0.44% to the 150.280 level.
Another commodity-related currency positive against the U.S dollar, AUD/USD rose 0.81% to 0.64440, and NZD/USD surged 1.04% to 0.59060 level.
EUR/USD Intraday: Trend on the upside
Our pivot point is at 1.05930
Preferable Price Action: Take buy positions above pivot level with targets at 1.06200 & 1.06390 in extension.
Alternative Price Action: Below pivot looks for a further downside to 1.05690 & 1.05520.
Comment: RSI is above 50 levels and Pairs above its 20MA & 55MA.
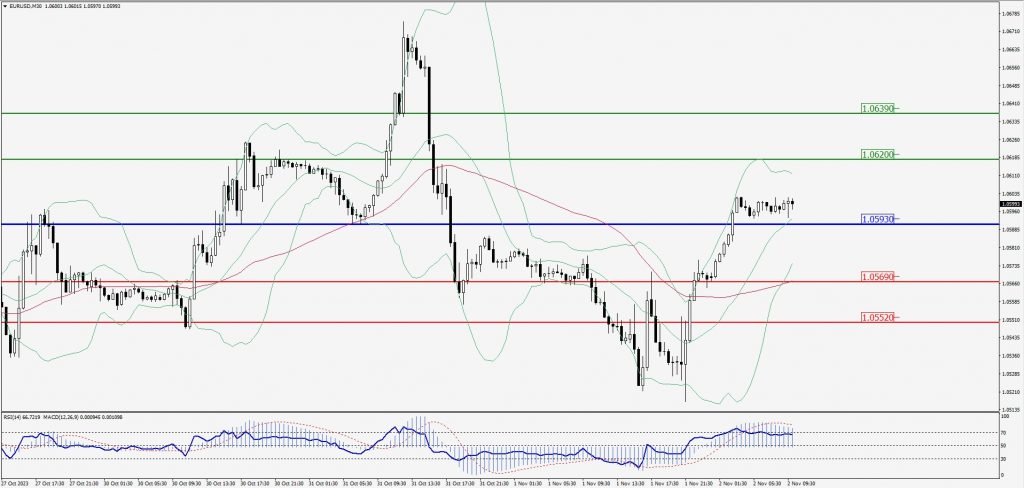
Green Lines Indicate Resistance Levels – Red Lines Indicate Support Levels
Light Blue is a Pivot Point – Black represents the price when the report was produced
GBP/USD Intraday: Trend on the upside
Our pivot point is at 1.21700
Preferable Price Action: Buy positions above pivot with targets at 1.21970 & 1.22150 in extension.
Alternative Price Action: The price below pivot would call for further downside to 1.21470 & 1.21320.
Comment: RSI is above 50 levels and Pairs above 55MA.
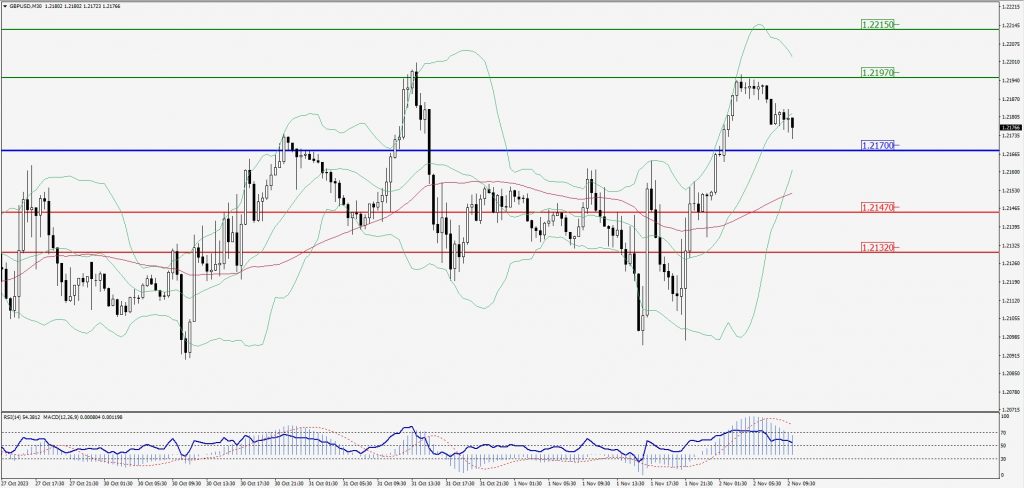
Green Lines Indicate Resistance Levels – Red Lines Indicate Support Levels
Light Blue is a Pivot Point – Black represents the price when the report was produced
USD/JPY Intraday: Trend on the downside
Our pivot point is at 150.620
Preferable Price Action: Sell position below pivot with the target at 150.080 and 149.800 in extension.
Alternative Price Action: The upside breakout of the pivot would call for 151.050 and 151.370.
Comment: MACD is below 50 level and Pairs below its 20MA & 55MA.
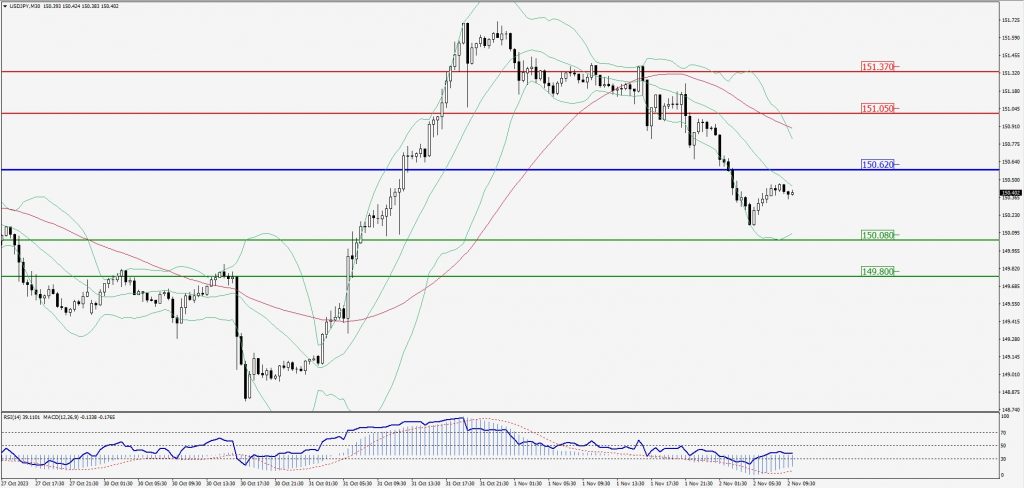
Green Lines Indicate Resistance Levels – Red Lines Indicate Support Levels
Light Blue is a Pivot Point – Black represents the price when the report was produced
AUD/USD Intraday: Major trend on the upside
Our pivot point is at 0.64200
Preferable Price Action: Buy positions above pivot with targets at 0.64460 & 0.64650 in extension.
Alternative Price Action: Below pivot looks for a further downside with 0.63990 & 0.63830 as targets.
Comment: RSI is above 50 levels and Pairs above its 20MA & 55MA.
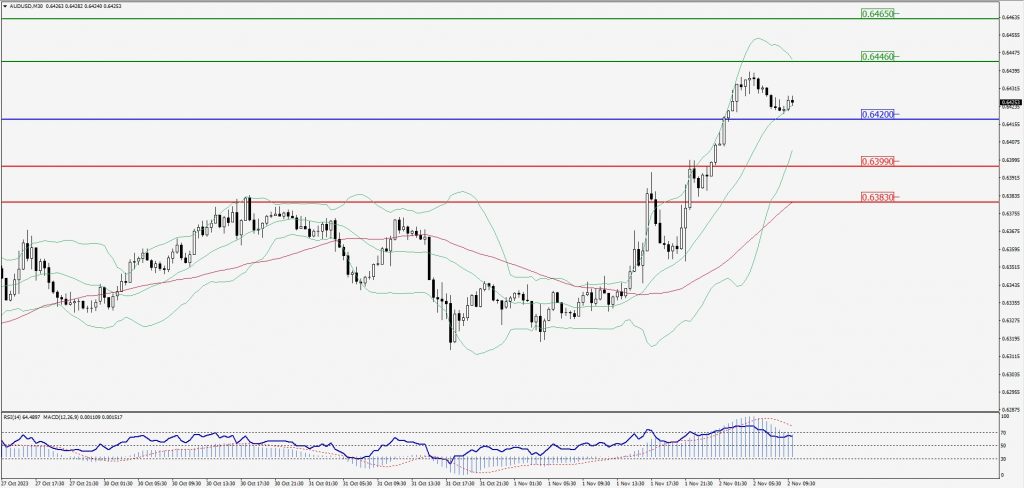
Green Lines Indicate Resistance Levels – Red Lines Indicate Support Levels
Light Blue is a Pivot Point – Black represents the price when the report was produced
CRUDEOIL Intraday: Resistance level at 81.32
Our pivot point is at 81.32
Preferable Price Action: Below pivot sell oil with 80.08 & 79.45 as targets.
Alternative Price Action: Buy crude above pivot with targets at 82.21 and 82.94 in extension.
Comment: MACD is flat territory and Pairs below 55MA.
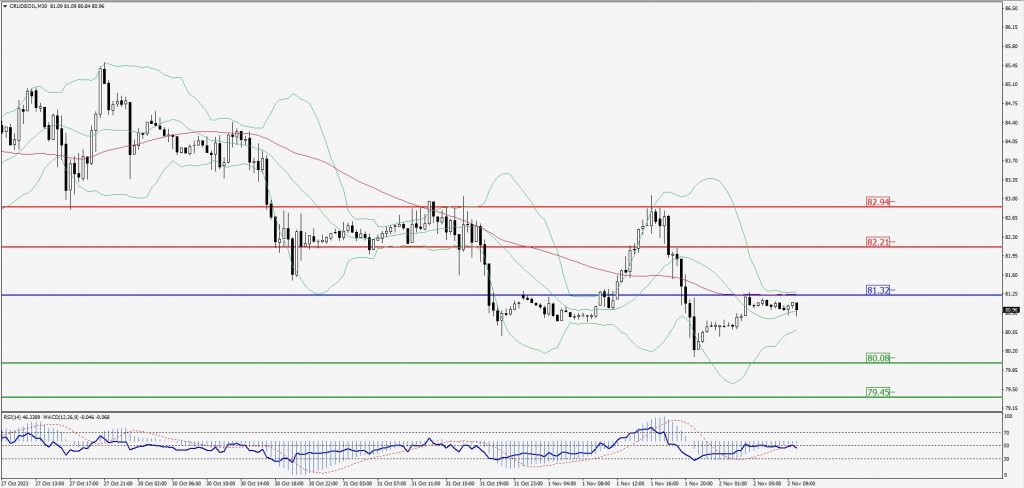
Green Lines Indicate Resistance Levels – Red Lines Indicate Support Levels
Light Blue is a Pivot Point – Black represents the price when the report was produced
XAU/USD Intraday: In a consolidation zone
Our pivot point is 1982.70
Preferable Price Action: Further upside to 1989.50 and 1993.90.
Alternative Price Action: If the price gives a downside breakout of a pivot, then the price extends to 1976.30 and 1972.40.
Comment: MACD is at 50 level and Pairs above 55MA.
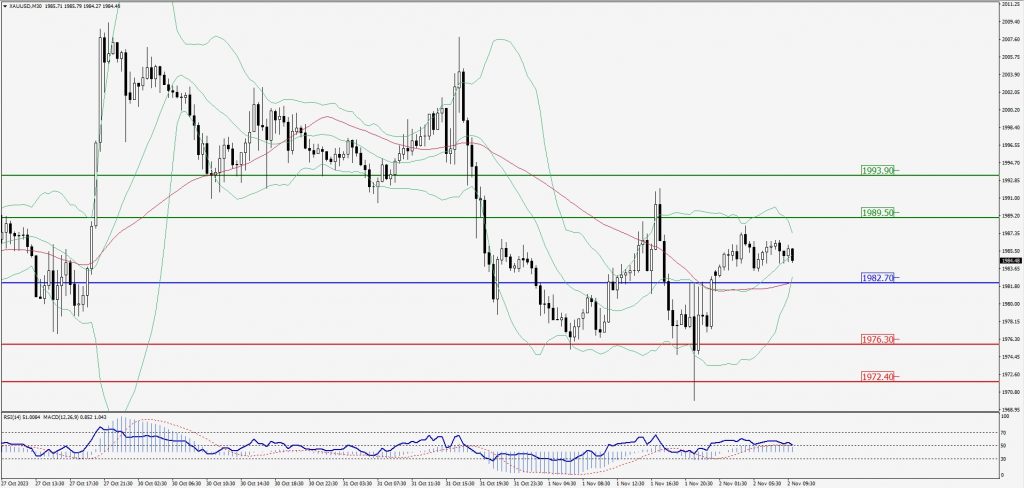
Green Lines Indicate Resistance Levels – Red Lines Indicate Support Levels
Light Blue is a Pivot Point – Black represents the price when the report was produced
Dow Jones Intraday: Trend on the upside
Our pivot point is 33,255.00
Preferable Price Action: Take buy positions above the pivot with targets at 33,447.00 & 33,582.00.
Alternative Price Action: Below 33,255.00 looks for further downside to 33,103.00 & 32,983.00.
Comment: RSI is above 50 levels and Pairs above 55MA.
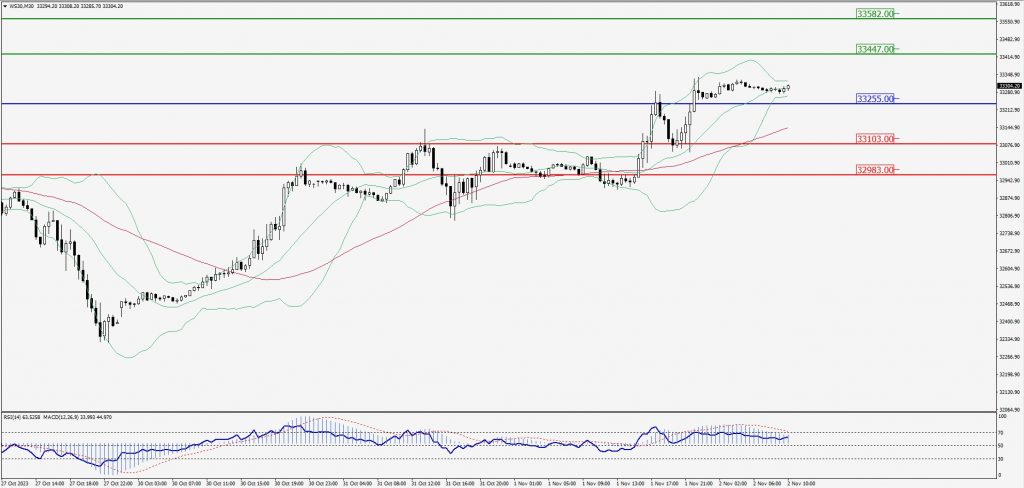
Green Lines Indicate Resistance Levels – Red Lines Indicate Support Levels
Light Blue is a Pivot Point – Black represents the price when the report was produced