Market Wrap: Stocks, Bonds, Commodities
US stock futures opened higher slightly ahead of a big week filled with a Federal Reserve rate decision, jobs report and Apple’s earnings report.
The Dow Jones Industrial Average fell 366.71 points to 32,417.59, the S&P 500 lose 0.48% to 4,117.37 and the Nasdaq Composite add 47.41 points to 12,643.01.
MSCI’s index of Asia-Pacific stocks outside Japan is advance 0.19% to 586.12 levels. The Australian index was lower by 0.79% to 6,772.90. Japanese Nikkei Index drop 0.98% today.
European stocks were negative on Monday, with the Stoxx Europe 50 Index fell 0.86% to 4,014.65, Germany’s DAX drop 0.30% to 14,687.41, and France’s CAC decline 1.28% to 6,800.47 and U.K.’s FTSE 100 subtract 0.86% to 7,291.28.
Benchmark 10-year U.S. Treasury fell as demand for safe assets ascend again, today 10-year bond yields positive 0.06% to 4.8510.
Oil prices slipped $1 a barrel on Monday as investors adopted caution ahead of the Fed policy meeting and China’s manufacturing data later this week, offsetting support from geopolitical tensions in the Middle East.
Spot Brent crude oil drop 1.38% to $87.97 per barrel. US West Texas Intermediate crude is down 1.66% to $84.11 a barrel.
The yellow metal gold is advance 0.35% to 2,005.45 dollars per ounce.
Market Wrap: Forex
The dollar edged down against a basket of currencies on Monday, pulled down by portfolio rebalancing, but was on track to end the week higher as fresh data reinforced the view the U.S. economy remains on a firm footing.
Today, the U.S. dollar index measures the Greenback against a trade-weighted basket of six major currencies, which surged 0.06% to 106.440.
The Euro US Dollar (EUR/USD) is a widely traded pair that is down 0.07% today. This left the pair trading around $1.05580.
The Japanese yen was negative against the U.S. dollar on Monday. Today USD/JPY is slipped 0.04% to the 149.530 level.
Another commodity-related currency positive against the U.S dollar, AUD/USD rose 0.36% to 0.63570, and NZD/USD surged 0.26% to 0.58280 level.
EUR/USD Intraday: Trend on the downside
Our pivot point is at 1.05720
Preferable Price Action: Take sell positions below pivot level with targets at 1.05390 & 1.05200 in extension.
Alternative Price Action: Above pivot looks for a further upside to 1.06000 & 1.06190.
Comment: RSI is below 50 levels.
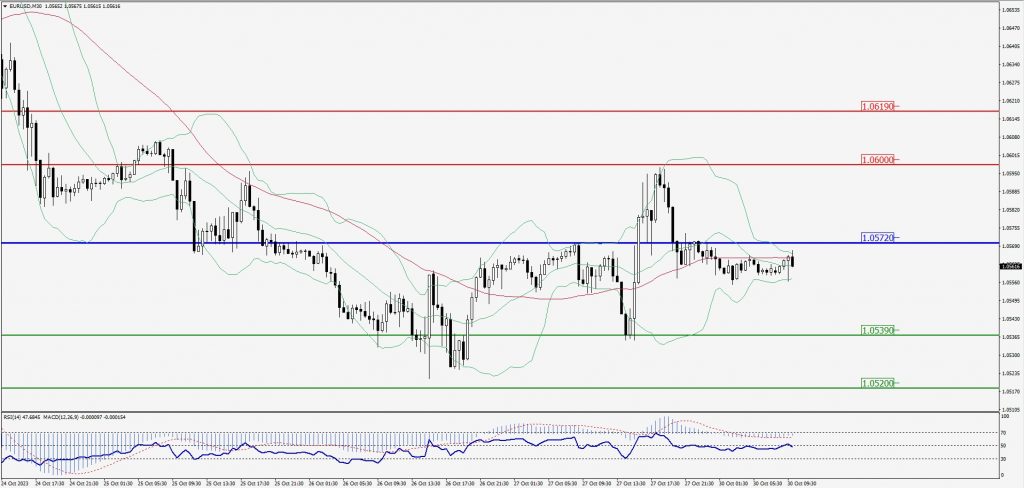
Green Lines Indicate Resistance Levels – Red Lines Indicate Support Levels
Light Blue is a Pivot Point – Black represents the price when the report was produced
GBP/USD Intraday: Support level at 1.21170
Our pivot point is at 1.21170
Preferable Price Action: Buy positions above pivot with targets at 1.21520 & 1.21730 in extension.
Alternative Price Action: The price below pivot would call for further downside to 1.20860 & 1.20670.
Comment: RSI is above 50 levels and Pairs above 20MA.
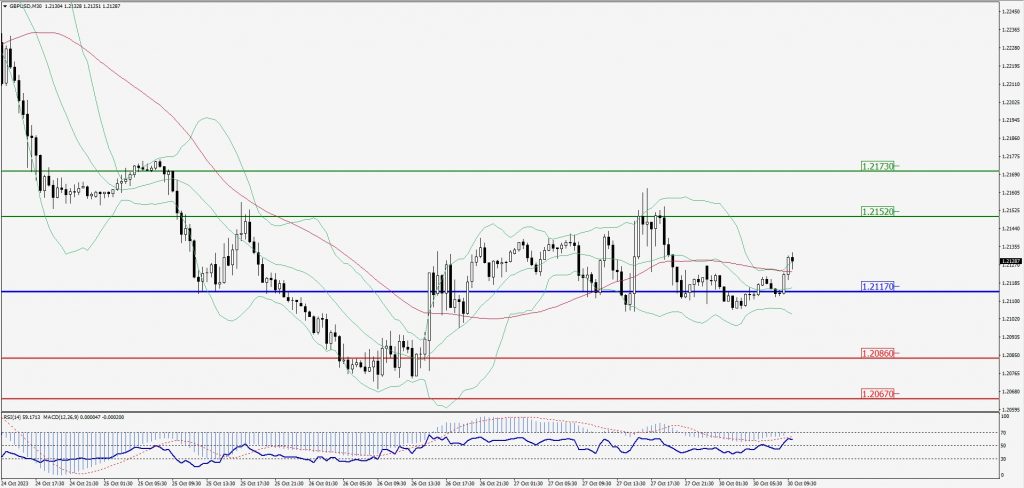
Green Lines Indicate Resistance Levels – Red Lines Indicate Support Levels
Light Blue is a Pivot Point – Black represents the price when the report was produced
USD/JPY Intraday: Major trend on the downside
Our pivot point is at 149.590
Preferable Price Action: Sell position below pivot with the target at 149.250 and 149.020 in extension.
Alternative Price Action: The upside breakout of the pivot would call for 149.900 and 150.160.
Comment: MACD is below 50 level and Pairs below its 20MA & 55MA.
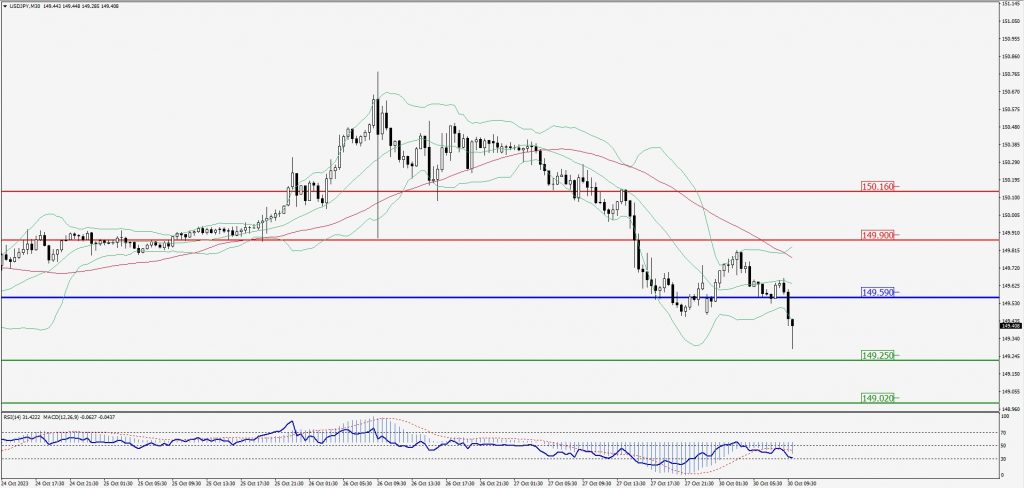
Green Lines Indicate Resistance Levels – Red Lines Indicate Support Levels
Light Blue is a Pivot Point – Black represents the price when the report was produced
AUD/USD Intraday: Trend on the upside
Our pivot point is at 0.63520
Preferable Price Action: Buy positions above pivot with targets at 0.63850 & 0.64060 in extension.
Alternative Price Action: Below pivot looks for a further downside with 0.63230 & 0.63040 as targets.
Comment: RSI is above 50 levels and Pairs above its 20MA & 55MA.
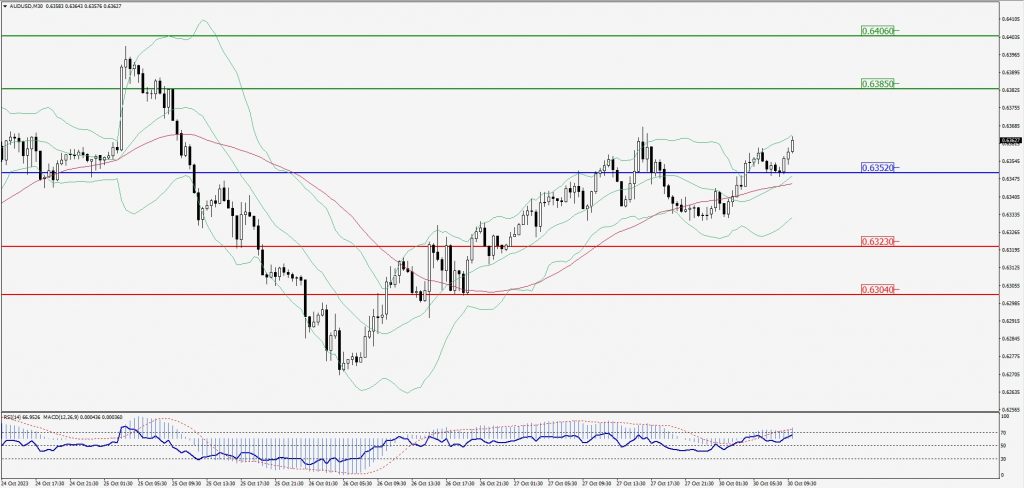
Green Lines Indicate Resistance Levels – Red Lines Indicate Support Levels
Light Blue is a Pivot Point – Black represents the price when the report was produced
CRUDEOIL Intraday: Resistance level at 84.35
Our pivot point is at 84.35
Preferable Price Action: Below pivot sell oil with 83.34 & 82.54 as targets.
Alternative Price Action: Buy crude above pivot with targets at 85.30 and 86.07 in extension.
Comment: MACD is negative territory and Pairs below 55MA.
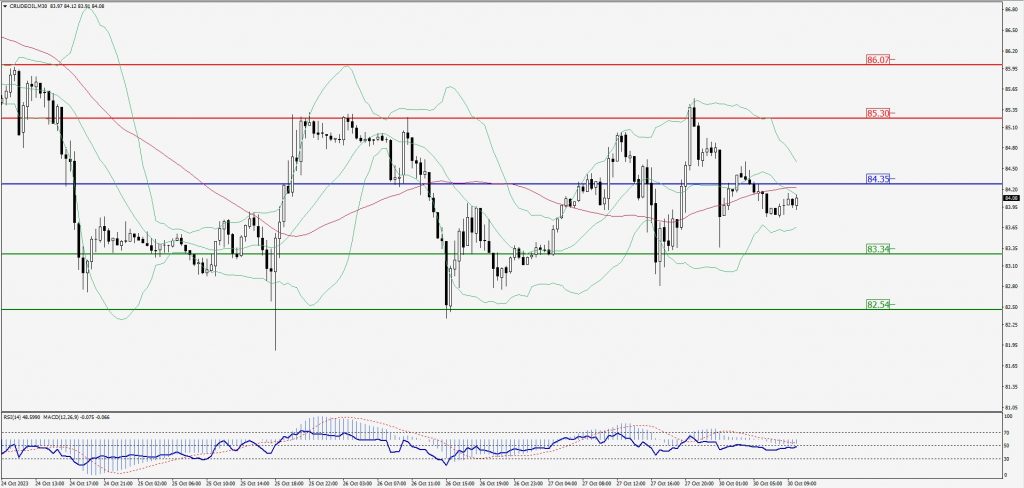
Green Lines Indicate Resistance Levels – Red Lines Indicate Support Levels
Light Blue is a Pivot Point – Black represents the price when the report was produced
XAU/USD Intraday: Trend on the downside
Our pivot point is 2002.10
Preferable Price Action: Further downside to 1988.30 and 1980.10.
Alternative Price Action: If the price gives an upside breakout of a pivot, then the price extends to 2014.10 and 2022.90.
Comment: MACD is below 50 level and Pairs below 20MA.
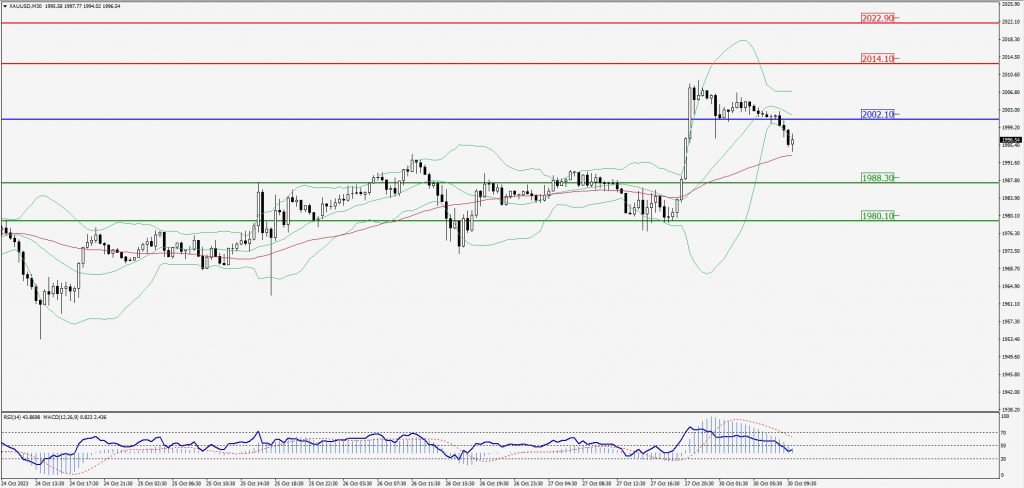
Green Lines Indicate Resistance Levels – Red Lines Indicate Support Levels
Light Blue is a Pivot Point – Black represents the price when the report was produced
Dow Jones Intraday: In a consolidation zone
Our pivot point is 32,482.00
Preferable Price Action: Take buy positions above the pivot with targets at 32,654.00 & 32,778.00.
Alternative Price Action: Below 32,482.00 looks for further downside to 32,321.00 & 32,202.00.
Comment: RSI is at 50 levels and Pairs above 20MA.
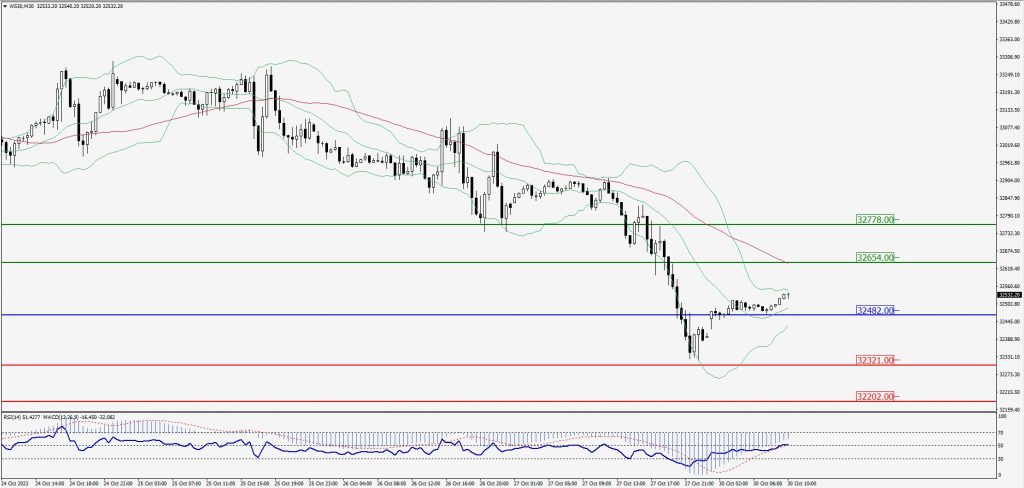
Green Lines Indicate Resistance Levels – Red Lines Indicate Support Levels
Light Blue is a Pivot Point – Black represents the price when the report was produced