Market Wrap: Stocks, Bonds, Commodities
The Nasdaq dipped and the benchmark US Treasury yields surged on Tuesday as robust economic data and strong third-quarter earnings suggested the Federal Reserve may keep policy tight for longer than expected.
The Dow Jones Industrial Average rose 13.11 points to 33,997.65, the S&P 500 lose 0.01% to 4,373.20 and the Nasdaq Composite subtract 34.24 points to 13,533.75.
MSCI’s index of Asia-Pacific stocks outside Japan is decline 0.54% to 601.84 levels. The Australian index was higher by 0.30% to 7,077.60. Japanese Nikkei Index ascend 0.20% today.
European stocks were positive on Wednesday, with the Stoxx Europe 50 Index rose 0.16% to 4,158.95, Germany’s DAX ascend 0.11% to 15,268.95, and France’s CAC advance 0.14% to 7,039.76 and U.K.’s FTSE 100 add 0.01% to 7,676.48.
Benchmark 10-year U.S. Treasury fell as demand for safe assets ascend again, today 10-year bond yields positive 0.14% to 4.8560.
Oil prices gained nearly $2 in early trade on Wednesday after industry data showed a bigger-than-expected draw in US crude stocks amid worries about supply disruptions from the Middle East due to a deepening Israel-Hamas conflict.
Spot Brent crude oil ascend 2.40% to $92.08 per barrel. US West Texas Intermediate crude is up 2.56% to $87.64 a barrel.
The yellow metal gold is advance 0.87% to 1,952.55 dollars per ounce.
Market Wrap: Forex
The dollar was mixed on Monday before a week heavy with speeches by Federal Reserve officials that will be watched for further clues on interest rate policy and as investors monitored developments in the Middle East.
Today, the U.S. dollar index measures the Greenback against a trade-weighted basket of six major currencies, which slipped 0.15% to 105.880.
The Euro US Dollar (EUR/USD) is a widely traded pair that is up 0.10% today. This left the pair trading around $1.05870.
The Japanese yen was negative against the U.S. dollar on Wednesday. Today USD/JPY is slipped 0.04% to the 149.740 level.
Another commodity-related currency positive against the U.S dollar, AUD/USD rose 0.33% to 0.63830, and NZD/USD surged 0.17% to 0.59060 level.
EUR/USD Intraday: Trend on the upside
Our pivot point is at 1.05710
Preferable Price Action: Take buy positions above pivot level with targets at 1.06050 & 1.06270 in extension.
Alternative Price Action: Below pivot looks for a further downside to 1.05430 & 1.05240.
Comment: RSI is above 50 levels and Pairs above its 20MA & 55MA.
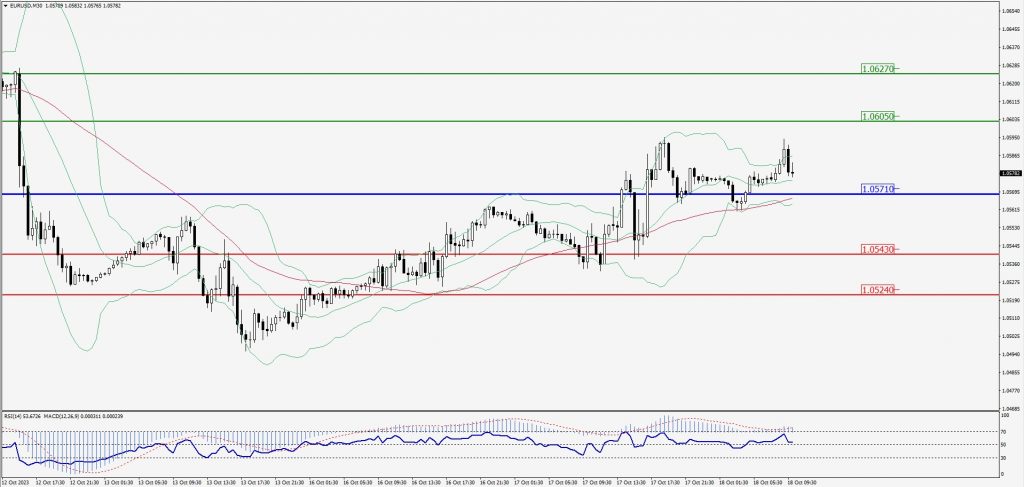
Green Lines Indicate Resistance Levels – Red Lines Indicate Support Levels
Light Blue is a Pivot Point – Black represents the price when the report was produced
GBP/USD Intraday: Trend on the upside
Our pivot point is at 1.21900
Preferable Price Action: Buy positions above pivot with targets at 1.22330 & 1.22600 in extension.
Alternative Price Action: The price below pivot would call for further downside to 1.21520 & 1.21270.
Comment: RSI is above 50 levels and Pairs above its 20MA & 55MA.
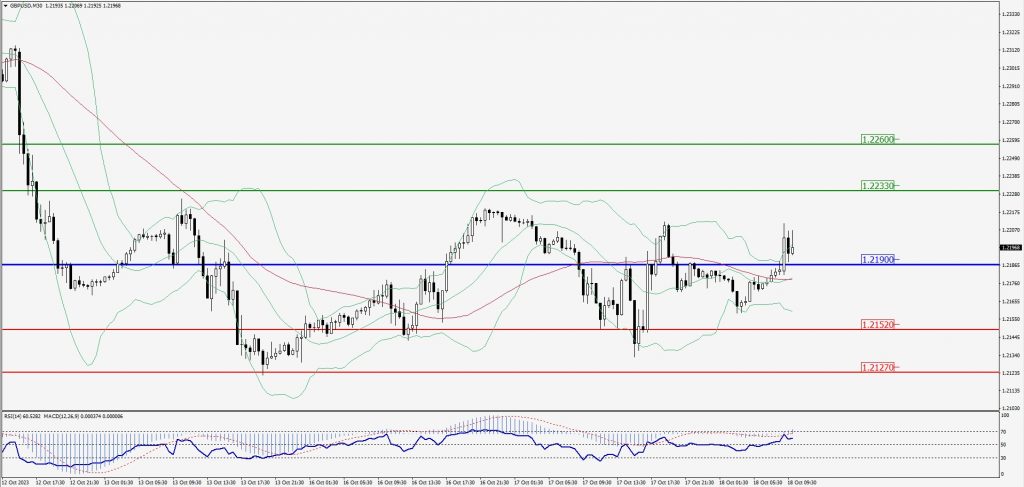
Green Lines Indicate Resistance Levels – Red Lines Indicate Support Levels
Light Blue is a Pivot Point – Black represents the price when the report was produced
USD/JPY Intraday: Resistance level at 149.810
Our pivot point is at 149.810
Preferable Price Action: Sell position below pivot with the target at 149.520 and 149.360 in extension.
Alternative Price Action: The upside breakout of the pivot would call for 150.040 and 150.180.
Comment: MACD is below 50 level and Pairs below 20MA.
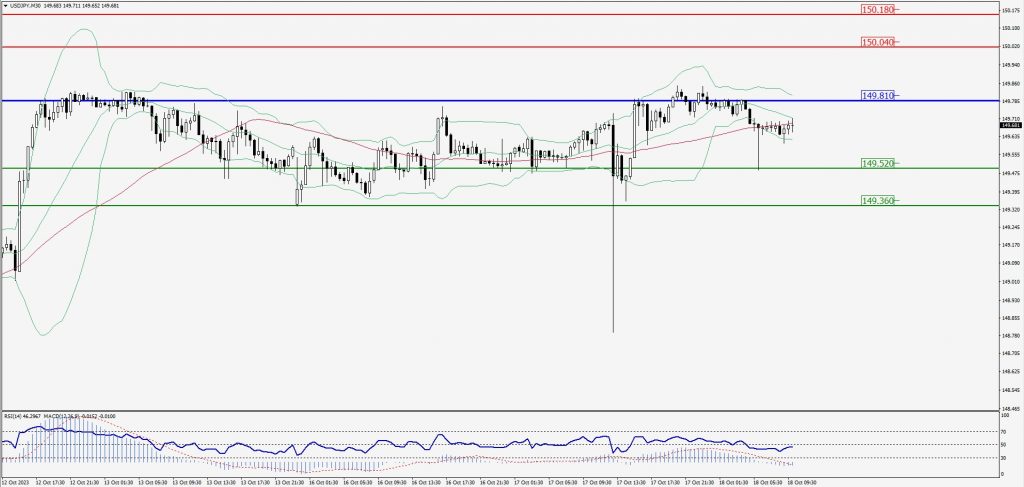
Green Lines Indicate Resistance Levels – Red Lines Indicate Support Levels
Light Blue is a Pivot Point – Black represents the price when the report was produced
AUD/USD Intraday: Trend on the upside
Our pivot point is at 0.63750
Preferable Price Action: Buy positions above pivot with targets at 0.64100 & 0.64300 in extension.
Alternative Price Action: Below pivot looks for a further downside with 0.63470 & 0.63280 as targets.
Comment: RSI is above 50 levels and Pairs above its 20MA & 55MA.
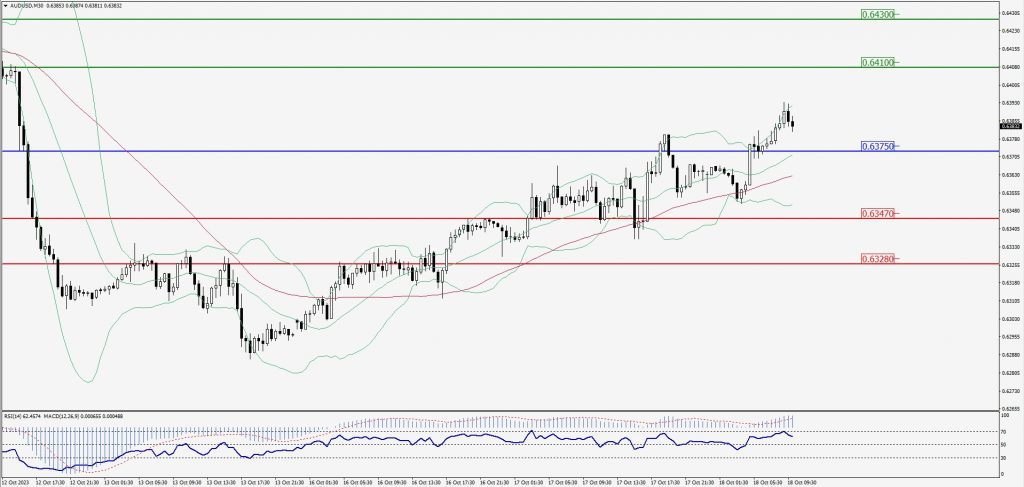
Green Lines Indicate Resistance Levels – Red Lines Indicate Support Levels
Light Blue is a Pivot Point – Black represents the price when the report was produced
CRUDEOIL Intraday: Trend on the upside
Our pivot point is at 86.61
Preferable Price Action: Above pivot buy oil with 88.29 & 89.31 as targets.
Alternative Price Action: Sell crude below pivot with targets at 85.11 and 84.12 in extension.
Comment: MACD is positive territory and Pairs above 55MA.
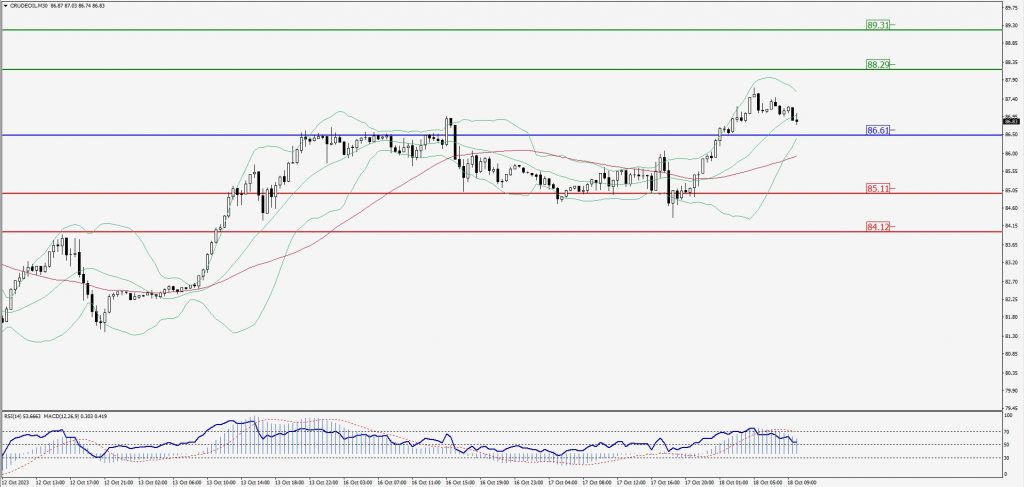
Green Lines Indicate Resistance Levels – Red Lines Indicate Support Levels
Light Blue is a Pivot Point – Black represents the price when the report was produced
XAU/USD Intraday: Trend on the upside
Our pivot point is 1929.70
Preferable Price Action: Further upside to 1949.10 and 1962.30.
Alternative Price Action: If the price gives a downside breakout of a pivot, then the price extends to 1914.00 and 1902.50.
Comment: MACD is above 50 level and Pairs above its 20MA & 55MA.
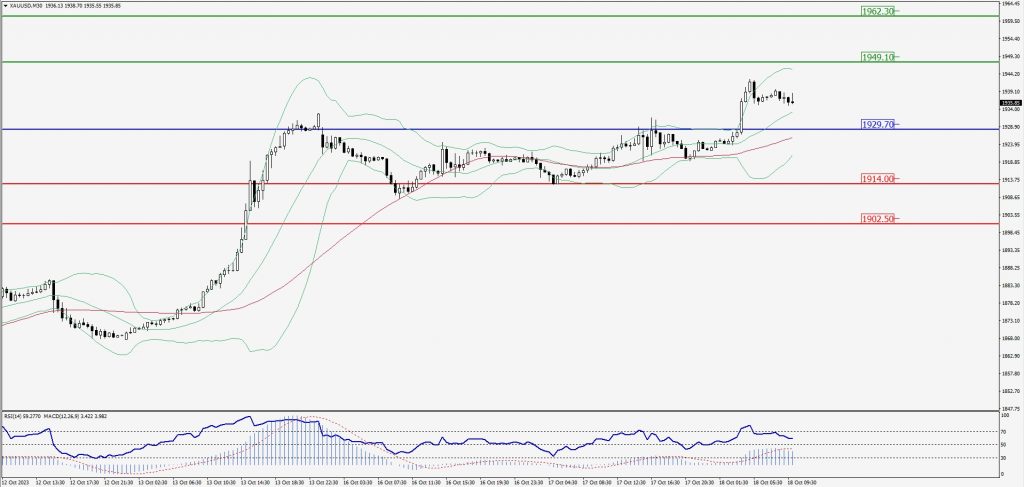
Green Lines Indicate Resistance Levels – Red Lines Indicate Support Levels
Light Blue is a Pivot Point – Black represents the price when the report was produced
Dow Jones Intraday: Trend on the downside
Our pivot point is 33,974.00
Preferable Price Action: Take sell positions below the pivot with targets at 33,839.00 & 33,750.00.
Alternative Price Action: Above 33,974.00 looks for further upside to 34,093.00 & 34,193.00.
Comment: RSI is below 50 levels and Pairs below its 20MA & 55MA.
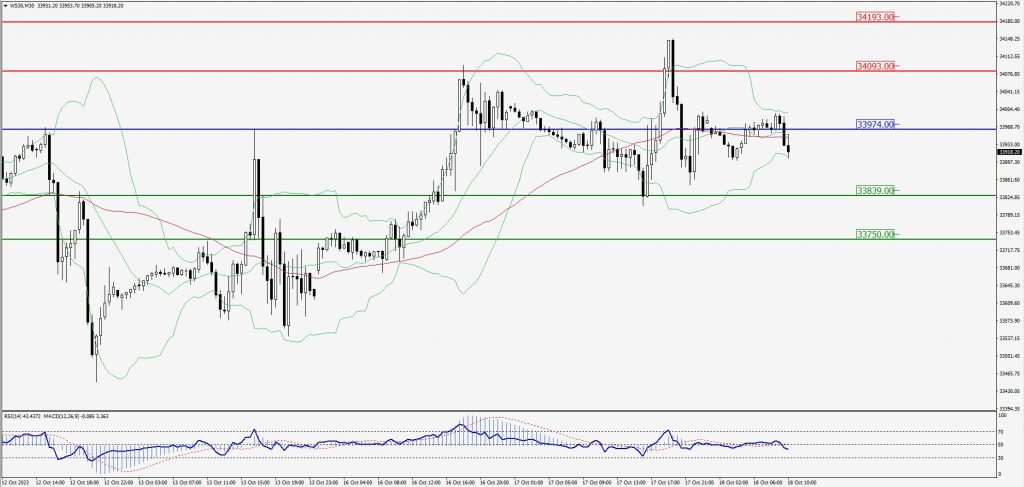
Green Lines Indicate Resistance Levels – Red Lines Indicate Support Levels
Light Blue is a Pivot Point – Black represents the price when the report was produced