Market Wrap: Stocks, Bonds, Commodities
Wall Street’s main indexes ended higher on Thursday as investors assessed the latest batch of economic data and as a surge in Treasury yields stalled ahead of a key inflation report.
The Dow Jones Industrial Average rose 116.07 points to 33,666.34, the S&P 500 rose 0.59% to 4,299.70 and the Nasdaq Composite add 108.43 points to 13,201.28.
MSCI’s index of Asia-Pacific stocks outside Japan is decline 1.23% to 605.65 levels. The Australian index was higher by 0.34% to 7,048.60. Japanese Nikkei Index ascend 0.03% today.
European stocks were positive on Friday, with the Stoxx Europe 50 Index rose 0.99% to 4,202.85, Germany’s DAX ascend 0.91% to 15,462.85, and France’s CAC rose 1.04% to 7,190.29 and U.K.’s FTSE 100 add 0.92% to 7,672.11.
Benchmark 10-year U.S. Treasury fell as demand for safe assets ascend again, today 10-year bond yields negative 1.46% to 4.5350.
Oil prices rose in early Asian trade on Thursday after surging to the highest settlement in 2023 in the previous session as a steep drop in US crude stocks added to worries of tight global supplies.
Spot Brent crude oil drop 0.20% to $92.91 per barrel. US West Texas Intermediate crude is down 0.05% to $91.66 a barrel.
The yellow metal gold is advance 0.53% to 1,888.55 dollars per ounce.
Market Wrap: Forex
The U.S. dollar steadied Wednesday near to new 10-month highs on worries of higher U.S. interest rates, while the euro and sterling fell to six-month lows.
Today, the U.S. dollar index measures the Greenback against a trade-weighted basket of six major currencies, which slipped 0.49% to 105.420.
The Euro US Dollar (EUR/USD) is a widely traded pair that is up 0.46% today. This left the pair trading around $1.06080.
The Japanese yen was negative against the U.S. dollar on Friday. Today USD/JPY is slipped 0.20% to the 149.000 level.
Another commodity-related currency positive against the U.S dollar, AUD/USD rose 0.95% to 0.64830, and NZD/USD surged 1.02% to 0.60300 level.
EUR/USD Intraday: Major trend on the upside
Our pivot point is at 1.05820
Preferable Price Action: Take buy positions above pivot level with targets at 1.06180 & 1.06420 in extension.
Alternative Price Action: Below pivot looks for a further downside to 1.05500 & 1.05290.
Comment: RSI is above 50 levels and Pairs above its 20MA & 55MA.
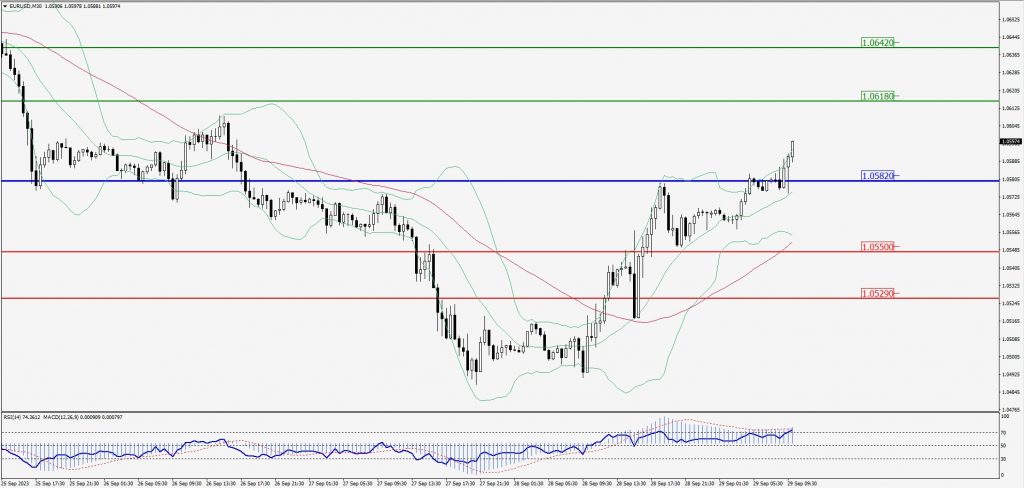
Green Lines Indicate Resistance Levels – Red Lines Indicate Support Levels
Light Blue is a Pivot Point – Black represents the price when the report was produced
GBP/USD Intraday: Major trend on the upside
Our pivot point is at 1.22300
Preferable Price Action: Buy positions above pivot with targets at 1.22650 & 1.22870 in extension.
Alternative Price Action: The price below pivot would call for further downside to 1.22010 & 1.21810.
Comment: RSI is above 50 levels and Pairs above 20MA & 55MA.
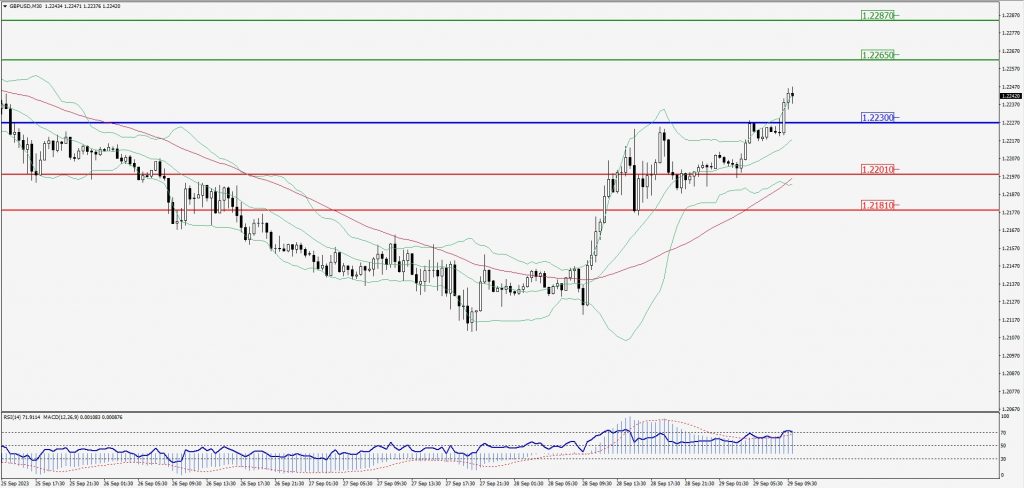
Green Lines Indicate Resistance Levels – Red Lines Indicate Support Levels
Light Blue is a Pivot Point – Black represents the price when the report was produced
USD/JPY Intraday: Major trend on the downside
Our pivot point is at 148.900
Preferable Price Action: Sell position below pivot with the target at 148.560 and 148.330 in extension.
Alternative Price Action: The upside breakout of the pivot would call for 149.180 and 149.430.
Comment: MACD is below 50 level and Pairs below its 20MA & 55MA.
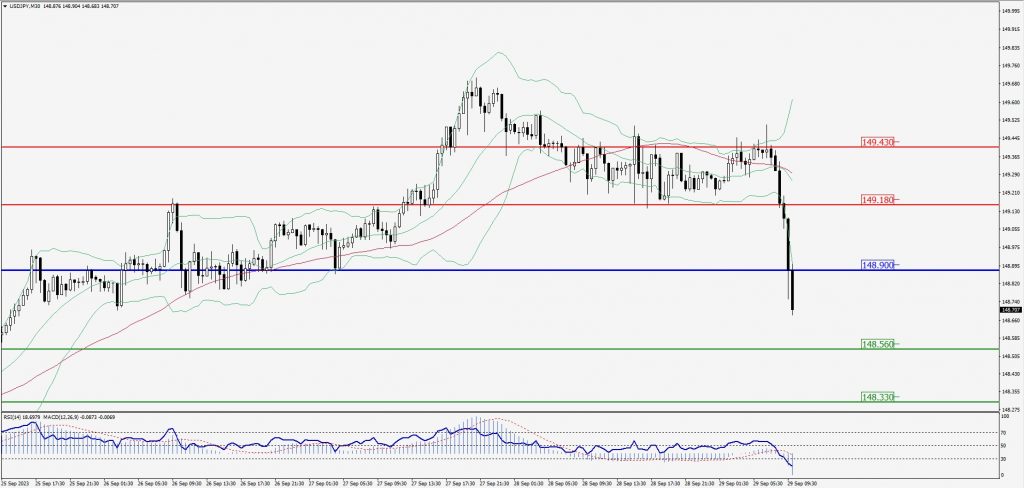
Green Lines Indicate Resistance Levels – Red Lines Indicate Support Levels
Light Blue is a Pivot Point – Black represents the price when the report was produced
AUD/USD Intraday: Major trend on the upside
Our pivot point is at 0.64640
Preferable Price Action: Buy positions above pivot with targets at 0.65010 & 0.65240 in extension.
Alternative Price Action: Below pivot looks for a further downside with 0.64350 & 0.64120 as targets.
Comment: RSI is above 50 levels and Pairs above its 20MA & 55MA.
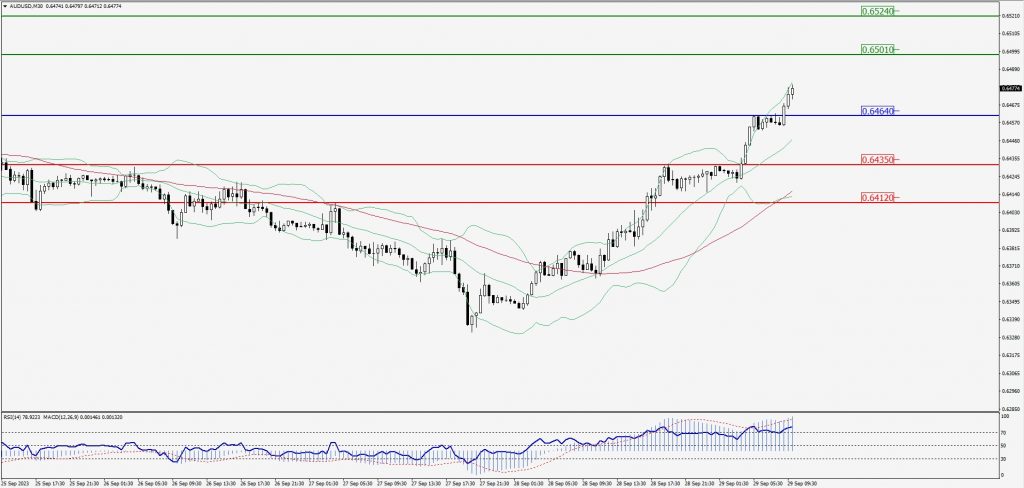
Green Lines Indicate Resistance Levels – Red Lines Indicate Support Levels
Light Blue is a Pivot Point – Black represents the price when the report was produced
CRUDEOIL Intraday: Trend on the downside
Our pivot point is at 91.60
Preferable Price Action: Below pivot sell oil with 90.24 & 89.41 as targets.
Alternative Price Action: Sell crude below pivot with targets at 92.27 and 91.59 in extension.
Comment: MACD is positive territory and Pairs above its 20MA & 55MA.
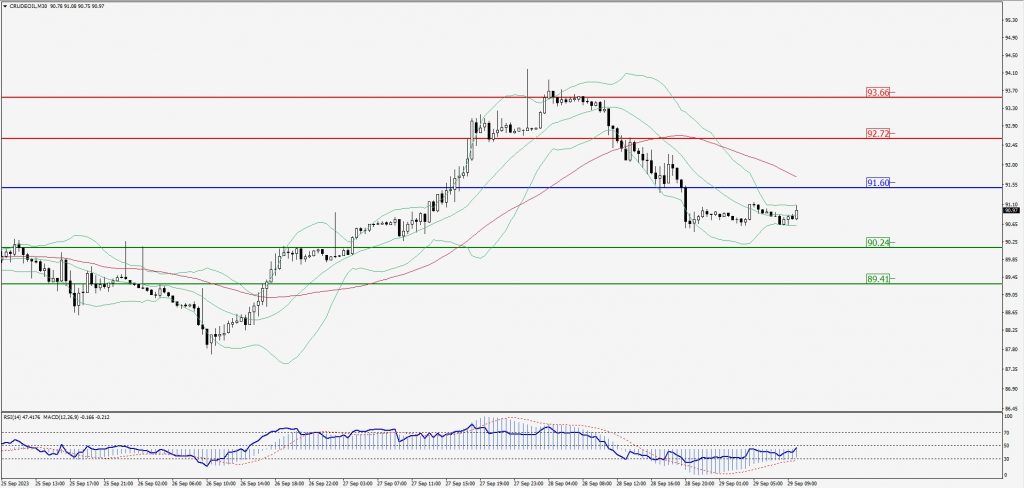
Green Lines Indicate Resistance Levels – Red Lines Indicate Support Levels
Light Blue is a Pivot Point – Black represents the price when the report was produced
Dow Jones Intraday: Trend on the upside
Our pivot point is 33,753.00
Preferable Price Action: Take buy positions above the pivot with targets at 33,909.00 & 34,011.00.
Alternative Price Action: Below 33,753.00 looks for further downside to 33,615.00 & 33,520.00.
Comment: RSI is above 50 levels and Pairs above its 20MA & 55MA.
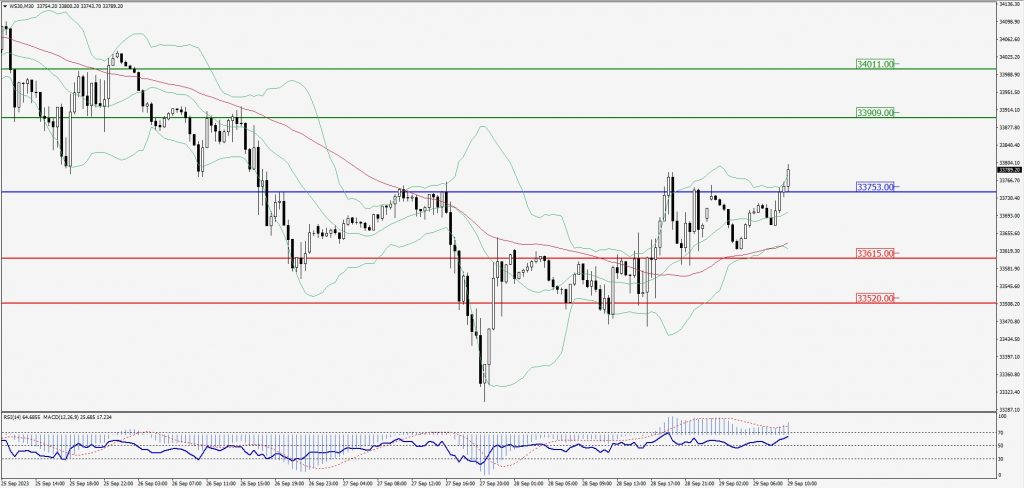
Green Lines Indicate Resistance Levels – Red Lines Indicate Support Levels
Light Blue is a Pivot Point – Black represents the price when the report was produced