Market Wrap: Stocks, Bonds, Commodities
Stock futures were near flat Wednesday night as investors readied for the final trading days of what’s shaping up to be a weak month and quarter.
The Dow Jones Industrial Average lose 68.61 points to 33,550.27, the S&P 500 rose 0.02% to 4,274.51 and the Nasdaq Composite add 29.24 points to 13,092.85.
MSCI’s index of Asia-Pacific stocks outside Japan is decline 0.67% to 598.14 levels. The Australian index was lower by 0.08% to 7,024.80. Japanese Nikkei Index drop 1.48% today.
European stocks were negative on Thursday, with the Stoxx Europe 50 Index fell 0.25% to 4,121.15, Germany’s DAX drop 0.17% to 15,191.45, and France’s CAC fell 0.07% to 7,067.12 and U.K.’s FTSE 100 subtract 0.60% to 7,547.11.
Benchmark 10-year U.S. Treasury fell as demand for safe assets ascend again, today 10-year bond yields positive 0.11% to 4.6360.
Oil prices ticked up in early trade on Thursday, as markets focused on supply tightness heading into winter and a ‘soft landing’ for the US economy.
Spot Brent crude oil ascend 0.02% to $94.41 per barrel. US West Texas Intermediate crude is up 0.19% to $93.86 a barrel.
The yellow metal gold is advance 0.07% to 1,892.05 dollars per ounce.
Market Wrap: Forex
U.S. oil futures jumped to their highest in more than a year on Thursday as a drop in crude stocks in the United States added to worries over tight global supplies from OPEC+ output cuts.
Today, the U.S. dollar index measures the Greenback against a trade-weighted basket of six major currencies, which slipped 0.09% to 106.270.
The Euro US Dollar (EUR/USD) is a widely traded pair that is up 0.15% today. This left the pair trading around $1.05160.
The Japanese yen was negative against the U.S. dollar on Thursday. Today USD/JPY is slipped 0.15% to the 149.410 level.
Another commodity-related currency positive against the U.S dollar, AUD/USD rose 0.44% to 0.63800, and NZD/USD surged 0.41% to 0.59460 level.
EUR/USD Intraday: Trend on the downside
Our pivot point is at 1.05170
Preferable Price Action: Take sell positions below pivot level with targets at 1.04740 & 1.04500 in extension.
Alternative Price Action: Above pivot looks for a further upside to 1.05540 & 1.05790.
Comment: RSI is below 50 levels and Pairs below its 20MA & 55MA.
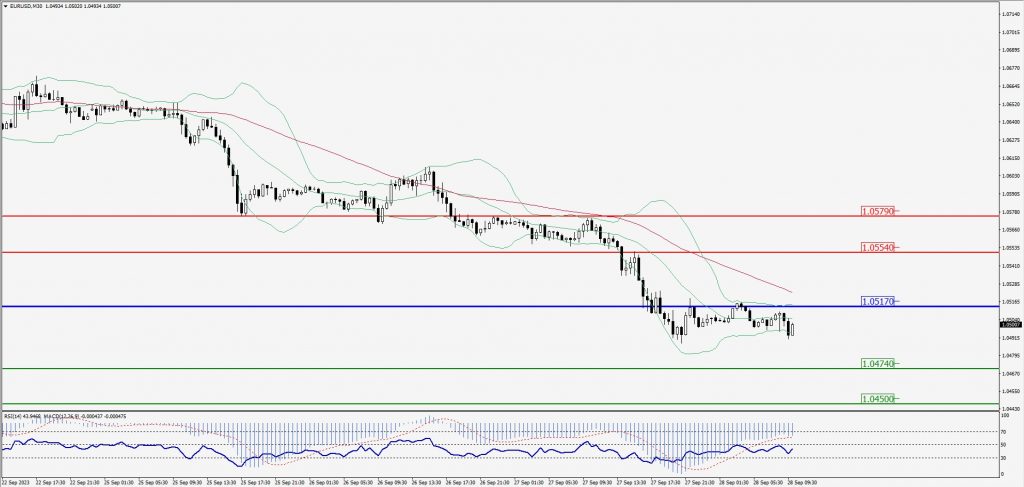
Green Lines Indicate Resistance Levels – Red Lines Indicate Support Levels
Light Blue is a Pivot Point – Black represents the price when the report was produced
GBP/USD Intraday: In a consolidation zone
Our pivot point is at 1.21490
Preferable Price Action: Sell positions below pivot with targets at 1.21070 & 1.20780 in extension.
Alternative Price Action: The price above pivot would call for further upside to 1.21880 & 1.22220.
Comment: RSI is at 50 levels.
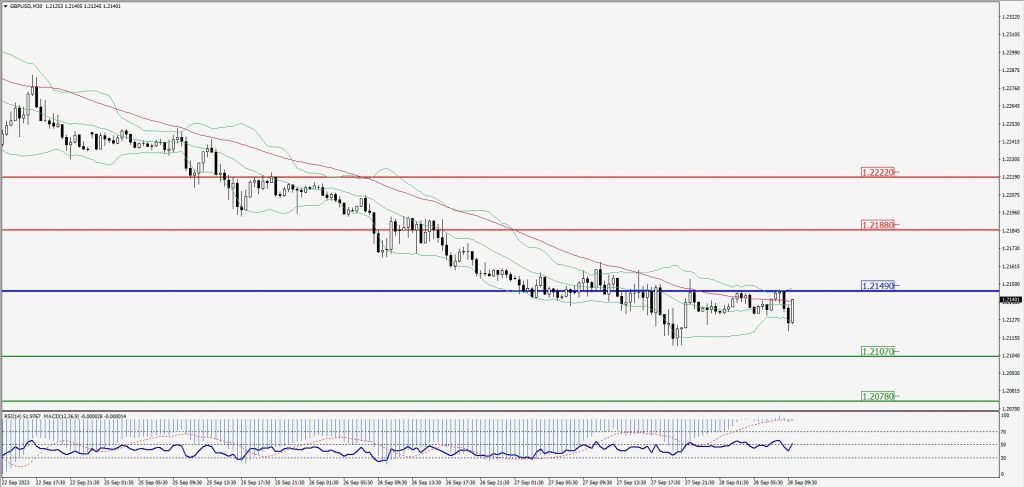
Green Lines Indicate Resistance Levels – Red Lines Indicate Support Levels
Light Blue is a Pivot Point – Black represents the price when the report was produced
USD/JPY Intraday: Trend on the downside
Our pivot point is at 149.430
Preferable Price Action: Sell position below pivot with the target at 149.090 and 148.900 in extension.
Alternative Price Action: The upside breakout of the pivot would call for 149.730 and 149.950.
Comment: MACD is below 50 level and Pairs below 20MA.
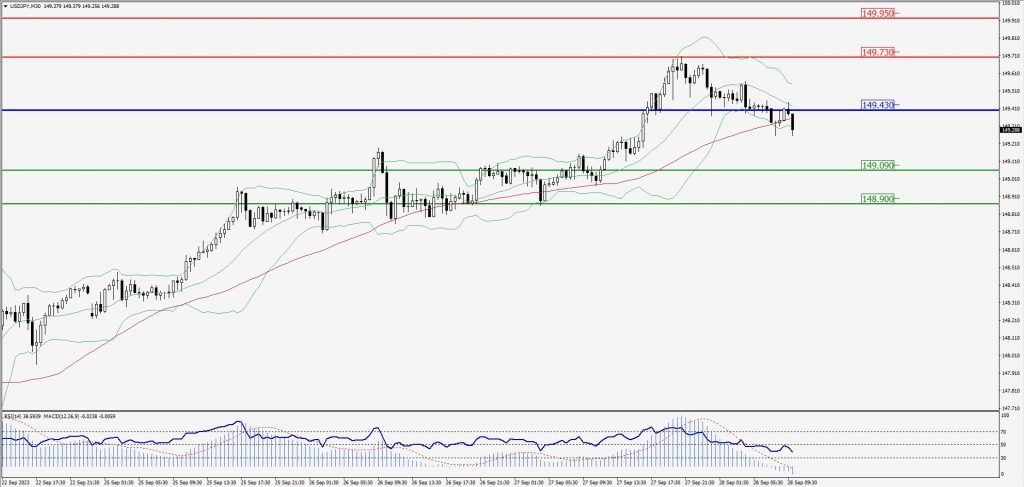
Green Lines Indicate Resistance Levels – Red Lines Indicate Support Levels
Light Blue is a Pivot Point – Black represents the price when the report was produced
AUD/USD Intraday: Support level at 0.63670
Our pivot point is at 0.63670
Preferable Price Action: Buy positions above pivot with targets at 0.63890 & 0.64050 in extension.
Alternative Price Action: Below pivot looks for a further downside with 0.63470 & 0.63320 as targets.
Comment: RSI is above 50 levels and Pairs above its 20MA & 55MA.
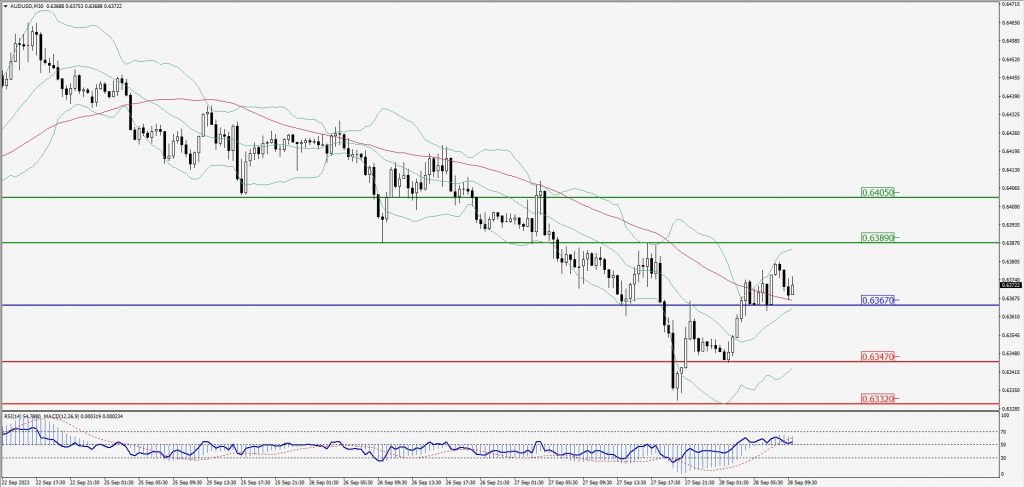
Green Lines Indicate Resistance Levels – Red Lines Indicate Support Levels
Light Blue is a Pivot Point – Black represents the price when the report was produced
CRUDEOIL Intraday: Trend on the upside
Our pivot point is at 93.09
Preferable Price Action: Above pivot buy oil with 94.12 & 94.83 as targets.
Alternative Price Action: Sell crude below pivot with targets at 92.27 and 91.59 in extension.
Comment: MACD is positive territory and Pairs above its 20MA & 55MA.
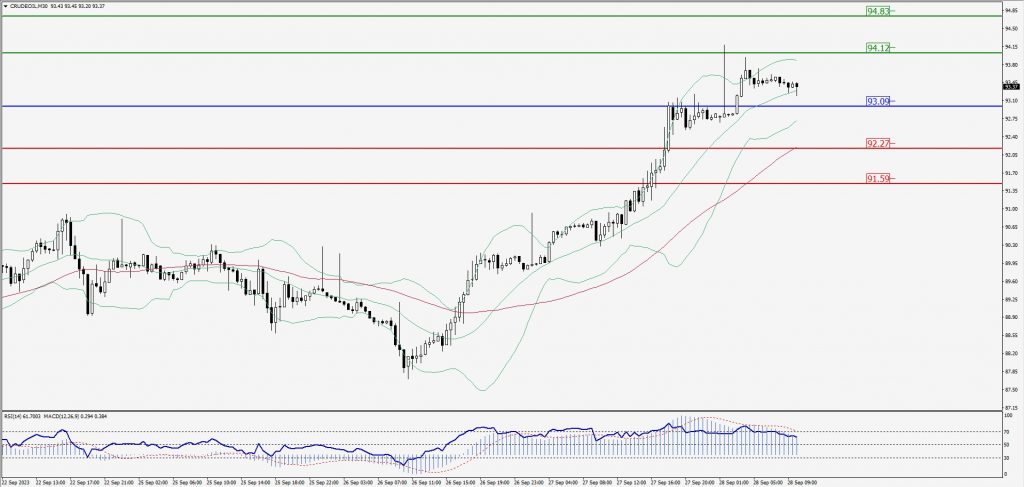
Green Lines Indicate Resistance Levels – Red Lines Indicate Support Levels
Light Blue is a Pivot Point – Black represents the price when the report was produced
Dow Jones Intraday: Resistance level at 33,607.00
Our pivot point is 33,607.00
Preferable Price Action: Take sell positions below the pivot with targets at 33,445.00 & 33,349.00.
Alternative Price Action: Above 33,607.00 looks for further upside to 33,752.00 & 33,847.00.
Comment: RSI is at 50 levels and Pairs below 55MA.
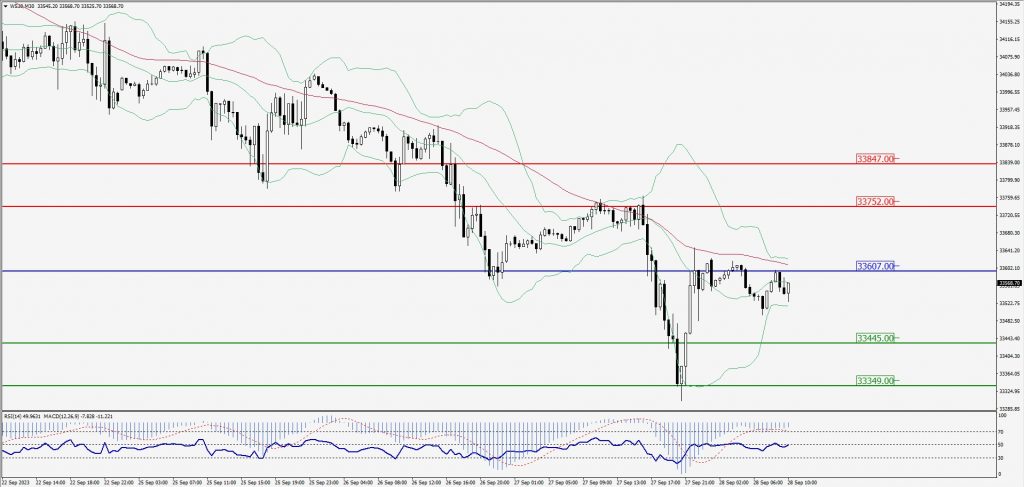
Green Lines Indicate Resistance Levels – Red Lines Indicate Support Levels
Light Blue is a Pivot Point – Black represents the price when the report was produced