Market Wrap: Stocks, Bonds, Commodities
Wall Street’s main indexes posted gains on Monday, with increases in Amazon.com shares and the energy sector, as Treasury yields rose further and investors looked to economic data and Federal Reserve policymakers’ remarks later in the week for clarity on the path for interest rates.
The Dow Jones Industrial Average gain 43.04 points to 34,006.88, the S&P 500 rose 0.40% to 4,337.44 and the Nasdaq Composite add 59.51 points to 13,271.31.
MSCI’s index of Asia-Pacific stocks outside Japan is decline 1.08% to 600.67 levels. The Australian index was lower by 0.54% to 7,038.20. Japanese Nikkei Index drop 1.06% today.
European stocks were negative on Tuesday, with the Stoxx Europe 50 Index fell 0.68% to 4,139.05, Germany’s DAX drop 0.48% to 15,334.85, and France’s CAC fell 0.57% to 7,083.26 and U.K.’s FTSE 100 add 0.13% to 7,633.87.
Benchmark 10-year U.S. Treasury fell as demand for safe assets ascend again, today 10-year bond yields negative 0.51% to 4.5210.
Oil prices held steady on Monday after Russia relaxed its fuel ban, taking the edge off earlier gains on a tighter supply outlook and wariness over interest rates that could curb demand.
Spot Brent crude oil drop 1.04% to $90.92 per barrel. US West Texas Intermediate crude is down 1.09% to $88.71 a barrel.
The yellow metal gold is decline 0.29% to 1,931.05 dollars per ounce.
Market Wrap: Forex
The U.S. dollar rose Tuesday, climbing to 10-month highs after bond yields soared to 16-year peaks amid growing expectations that U.S. interest rates will rise further this year.
Today, the U.S. dollar index measures the Greenback against a trade-weighted basket of six major currencies, which slipped 0.04% to 105.650.
The Euro US Dollar (EUR/USD) is a widely traded pair that is up 0.10% today. This left the pair trading around $1.06010.
The Japanese yen was negative against the U.S. dollar on Tuesday. Today USD/JPY is surged 0.02% to the 148.900 level.
Another commodity-related currency negative against the U.S dollar, AUD/USD fell 0.16% to 0.64120, and NZD/USD slipped 0.03% to 0.59630 level.
EUR/USD Intraday: Resistance level at 1.05930
Our pivot point is at 1.05930
Preferable Price Action: Take sell positions below pivot level with targets at 1.05480 & 1.05230 in extension.
Alternative Price Action: Above pivot looks for a further upside to 1.06300 & 1.06580.
Comment: RSI is below 50 levels and Pairs below its 20MA & 55MA.
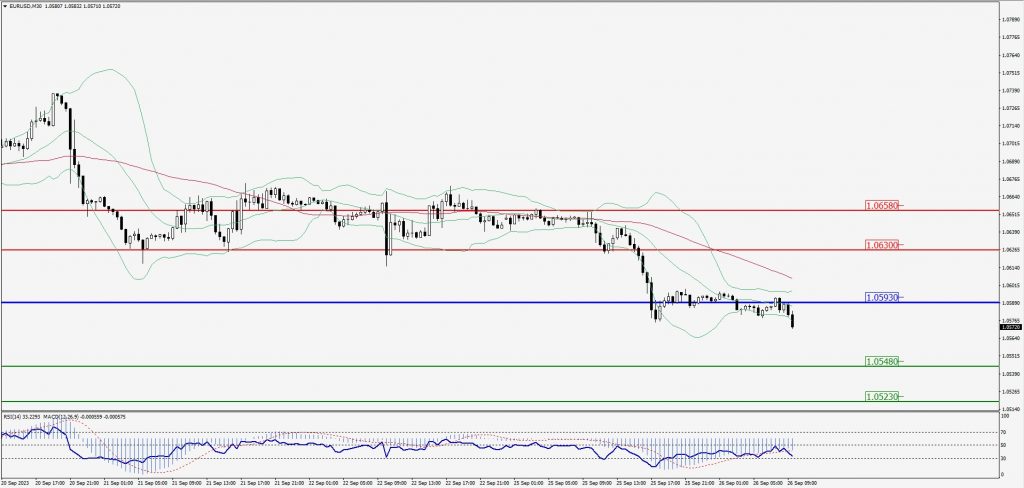
Green Lines Indicate Resistance Levels – Red Lines Indicate Support Levels
Light Blue is a Pivot Point – Black represents the price when the report was produced
GBP/USD Intraday: Major trend on the downside
Our pivot point is at 1.22010
Preferable Price Action: Sell positions below pivot with targets at 1.21370 & 1.21010 in extension.
Alternative Price Action: The price above pivot would call for further upside to 1.22530 & 1.22910.
Comment: RSI is below 50 levels and Pairs below its 20MA & 55ma.
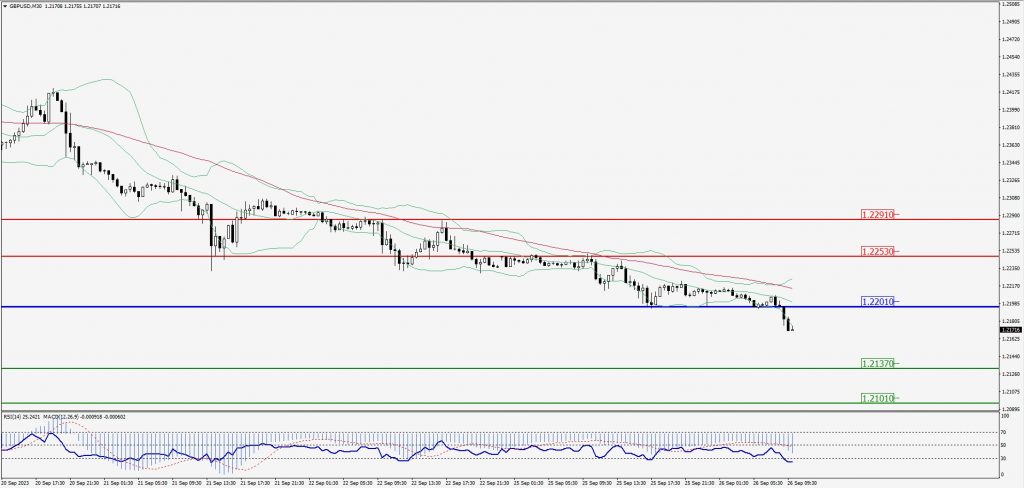
Green Lines Indicate Resistance Levels – Red Lines Indicate Support Levels
Light Blue is a Pivot Point – Black represents the price when the report was produced
USD/JPY Intraday: Major trend on the upside
Our pivot point is at 149.000
Preferable Price Action: Buy position above pivot with the target at 149.430 and 149.670 in extension.
Alternative Price Action: The downside breakout of the pivot would call for 148.640 and 148.380.
Comment: MACD is above 50 level and Pairs above its 20MA & 55MA.
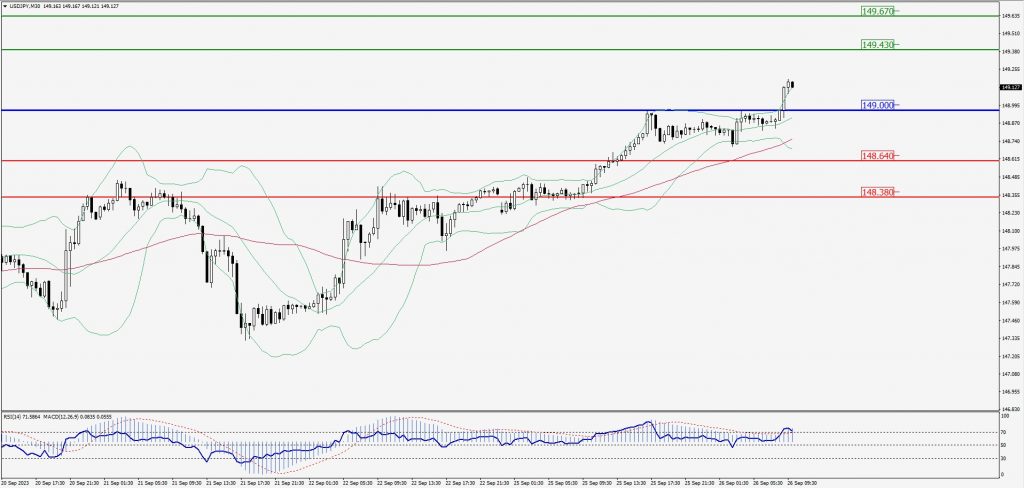
Green Lines Indicate Resistance Levels – Red Lines Indicate Support Levels
Light Blue is a Pivot Point – Black represents the price when the report was produced
AUD/USD Intraday: Major trend on the downside
Our pivot point is at 0.64080
Preferable Price Action: Sell positions below pivot with targets at 0.63740 & 0.63550 in extension.
Alternative Price Action: Above pivot looks for a further upside with 0.64410 & 0.64640 as targets.
Comment: RSI is below 50 levels and Pairs below its 20MA & 55MA.
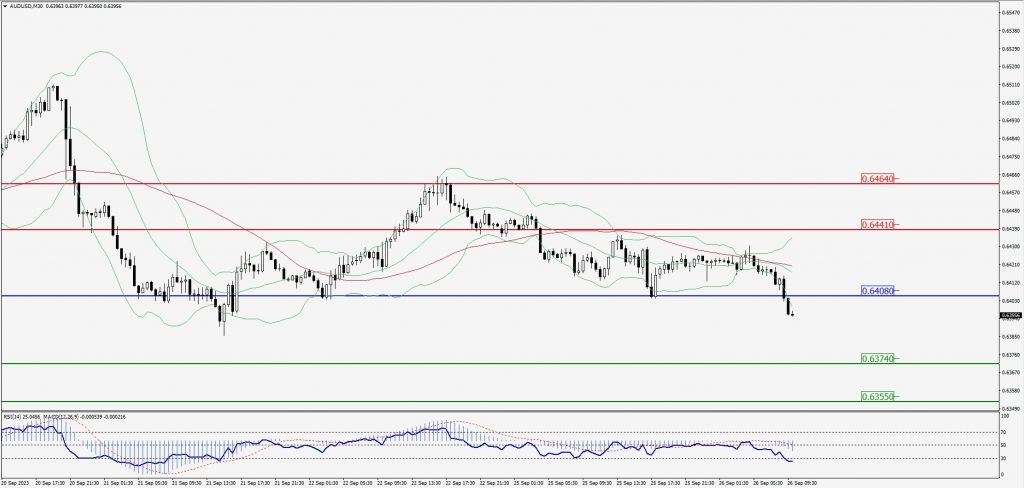
Green Lines Indicate Resistance Levels – Red Lines Indicate Support Levels
Light Blue is a Pivot Point – Black represents the price when the report was produced
CRUDEOIL Intraday: Trend on the downside
Our pivot point is at 88.52
Preferable Price Action: Below pivot sell oil with 87.74 & 87.28 as targets.
Alternative Price Action: Buy crude above pivot with targets at 89.26 and 89.87 in extension.
Comment: MACD is negative territory and Pairs below its 20MA & 55MA.
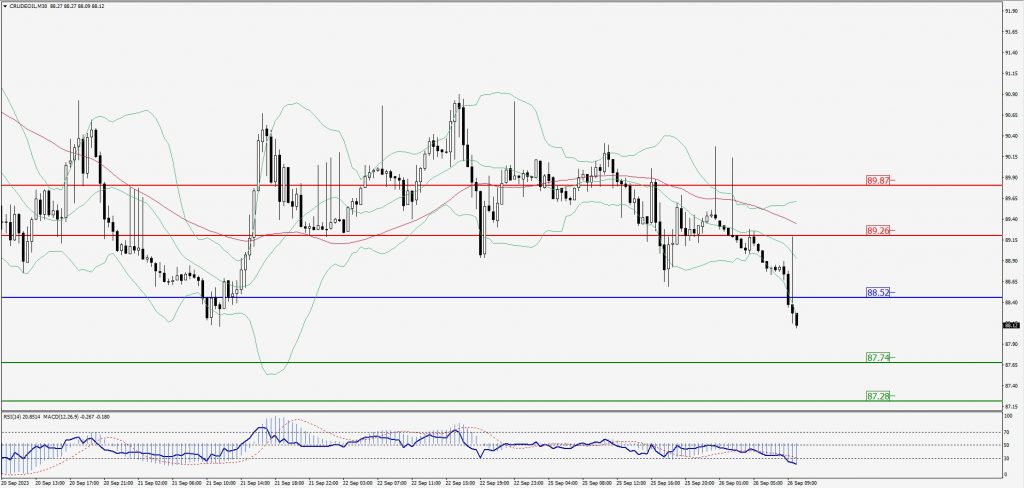
Green Lines Indicate Resistance Levels – Red Lines Indicate Support Levels
Light Blue is a Pivot Point – Black represents the price when the report was produced
XAU/USD Intraday: Trend on the downside
Our pivot point is 1914.20
Preferable Price Action: Further downside to 1906.00 and 1900.80.
Alternative Price Action: If the price gives an upside breakout of a pivot, then the price extends to 1922.30 and 1929.10.
Comment: MACD is below 50 level and Pairs below its 20MA & 55MA.
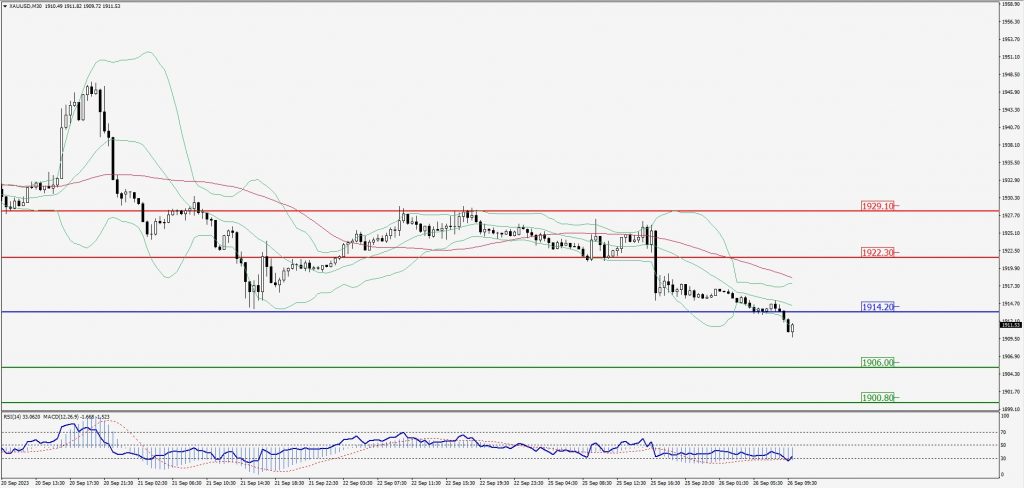
Green Lines Indicate Resistance Levels – Red Lines Indicate Support Levels
Light Blue is a Pivot Point – Black represents the price when the report was produced
Dow Jones Intraday: Trend on the downside
Our pivot point is 33,899.00
Preferable Price Action: Take sell positions below the pivot with targets at 33,692.00 & 33,575.00.
Alternative Price Action: Above 33,899.00 looks for further upside to 34,078.00 & 34,232.00.
Comment: RSI is below 50 levels and Pairs below its 20MA & 55MA.
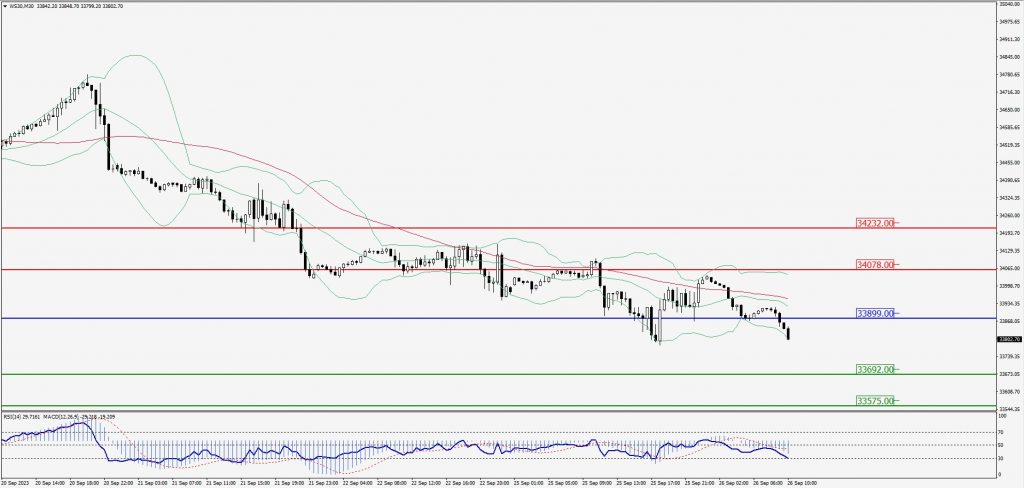
Green Lines Indicate Resistance Levels – Red Lines Indicate Support Levels
Light Blue is a Pivot Point – Black represents the price when the report was produced