Market Wrap: Stocks, Bonds, Commodities
Stock futures were flat in overnight trading Thursday as the market is poised to end the week with steep losses. Futures on the Dow Jones Industrial Average were little changed. S&P 500 futures and Nasdaq 100 futures were also flat.
The Dow Jones Industrial Average lose 106.58 points to 33,963.84, the S&P 500 fell 0.23% to 4,320.06 and the Nasdaq Composite subtract 12.18 points to 13,211.81.
MSCI’s index of Asia-Pacific stocks outside Japan is decline 0.68% to 607.42 levels. The Australian index was higher by 0.11% to 7,076.50. Japanese Nikkei Index ascend 0.95% today.
European stocks were negative on Monday, with the Stoxx Europe 50 Index fell 0.99% to 4,165.55, Germany’s DAX drop 0.94% to 15,414.75, and France’s CAC fell 0.87% to 7,122.32 and U.K.’s FTSE 100 subtract 0.81% to 7,621.83.
Benchmark 10-year U.S. Treasury fell as demand for safe assets ascend again, today 10-year bond yields positive 1.08% to 4.4880.
The U.S. grid-scale energy storage installations hit a new record in the second quarter of 2023, a report by Wood Mackenzie and the American Clean Power Association (ACP) said.
Spot Brent crude oil ascend 0.37% to $92.30 per barrel. US West Texas Intermediate crude is up 0.46% to $90.44 a barrel.
The yellow metal gold is decline 0.20% to 1,941.75 dollars per ounce.
Market Wrap: Forex
The U.S. dollar edged higher, just below the recent six-month high, making a steady start to the new week as traders digested last week’s series of central bank interest rate decisions.
Today, the U.S. dollar index measures the Greenback against a trade-weighted basket of six major currencies, which surged 0.14% to 105.410.
The Euro US Dollar (EUR/USD) is a widely traded pair that is down 0.22% today. This left the pair trading around $1.06290.
The Japanese yen was negative against the U.S. dollar on Monday. Today USD/JPY is surged 0.11% to the 148.540 level.
Another commodity-related currency negative against the U.S dollar, AUD/USD fell 0.36% to 0.64190, and NZD/USD slipped 0.17% to 0.59500 level.
EUR/USD Intraday: In a consolidation zone
Our pivot point is at 1.06430
Preferable Price Action: Take buy positions above pivot level with targets at 1.06740 & 1.06950 in extension.
Alternative Price Action: Below pivot looks for a further downside to 1.06170 & 1.05990.
Comment: RSI is at 50 levels.
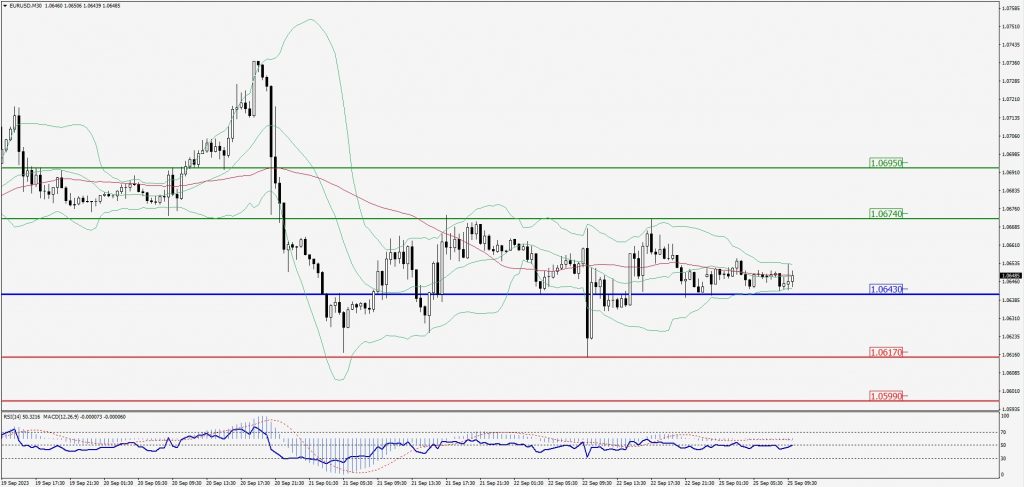
Green Lines Indicate Resistance Levels – Red Lines Indicate Support Levels
Light Blue is a Pivot Point – Black represents the price when the report was produced
GBP/USD Intraday: Support level at 1.22360
Our pivot point is at 1.22360
Preferable Price Action: Buy positions above pivot with targets at 1.22810 & 1.23160 in extension.
Alternative Price Action: The price below pivot would call for further downside to 1.21970 & 1.21670.
Comment: RSI is above 50 levels and Pairs above 20MA.
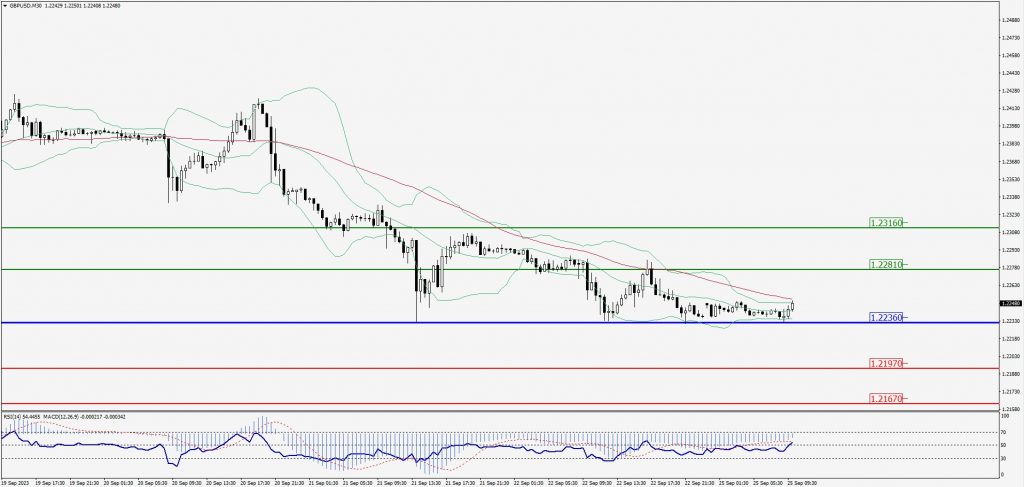
Green Lines Indicate Resistance Levels – Red Lines Indicate Support Levels
Light Blue is a Pivot Point – Black represents the price when the report was produced
USD/JPY Intraday: Trend on the upside
Our pivot point is at 148.370
Preferable Price Action: Buy position above pivot with the target at 148.710 and 148.930 in extension.
Alternative Price Action: The downside breakout of the pivot would call for 148.090 and 147.880.
Comment: MACD is above 50 level and Pairs above its 20MA & 55MA.
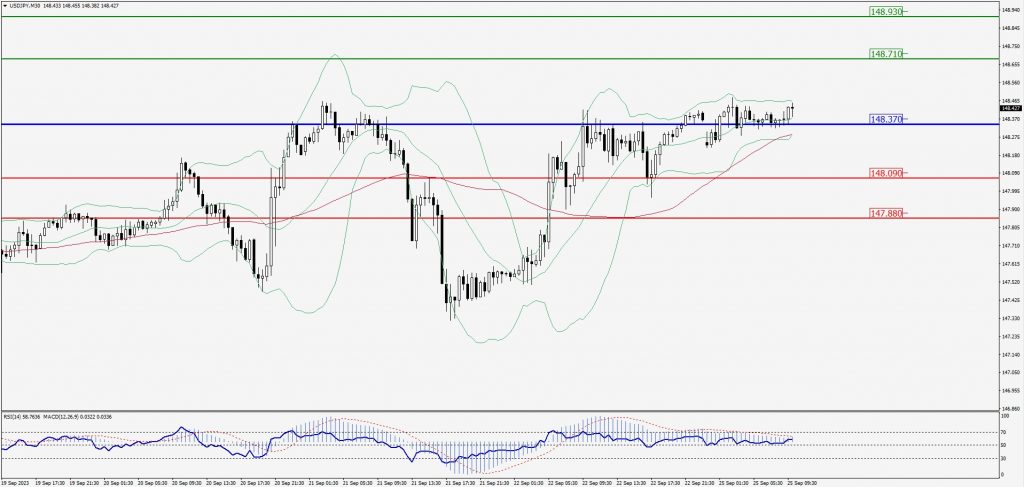
Green Lines Indicate Resistance Levels – Red Lines Indicate Support Levels
Light Blue is a Pivot Point – Black represents the price when the report was produced
AUD/USD Intraday: Trend on the downside
Our pivot point is at 0.64310
Preferable Price Action: Sell positions below pivot with targets at 0.64040 & 0.63870 in extension.
Alternative Price Action: Above pivot looks for a further upside with 0.64540 & 0.64710 as targets.
Comment: RSI is below 50 levels and Pairs below its 20MA & 55MA.
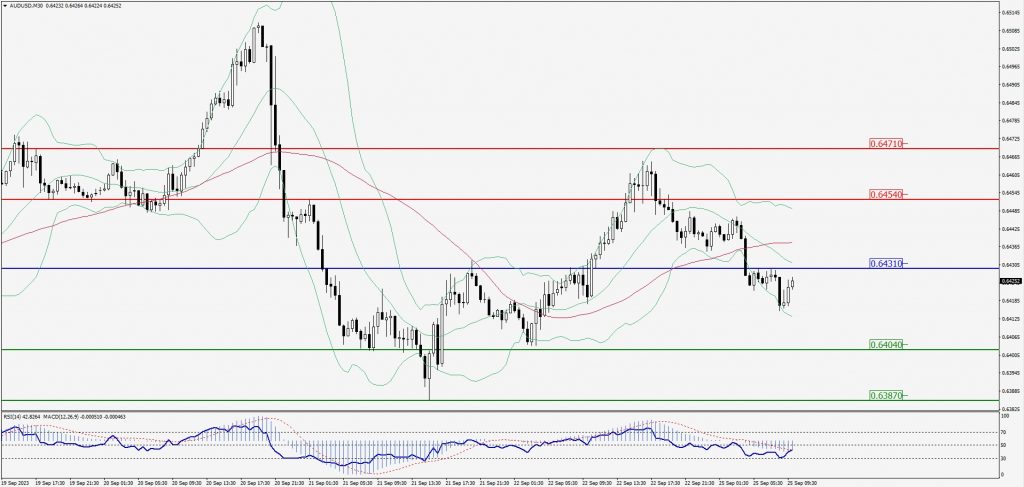
Green Lines Indicate Resistance Levels – Red Lines Indicate Support Levels
Light Blue is a Pivot Point – Black represents the price when the report was produced
CRUDEOIL Intraday: In a consolidation zone
Our pivot point is at 89.68
Preferable Price Action: Above pivot buy oil with 90.53 & 91.21 as targets.
Alternative Price Action: Sell crude below pivot with targets at 88.85 and 88.15 in extension.
Comment: MACD is flat territory.
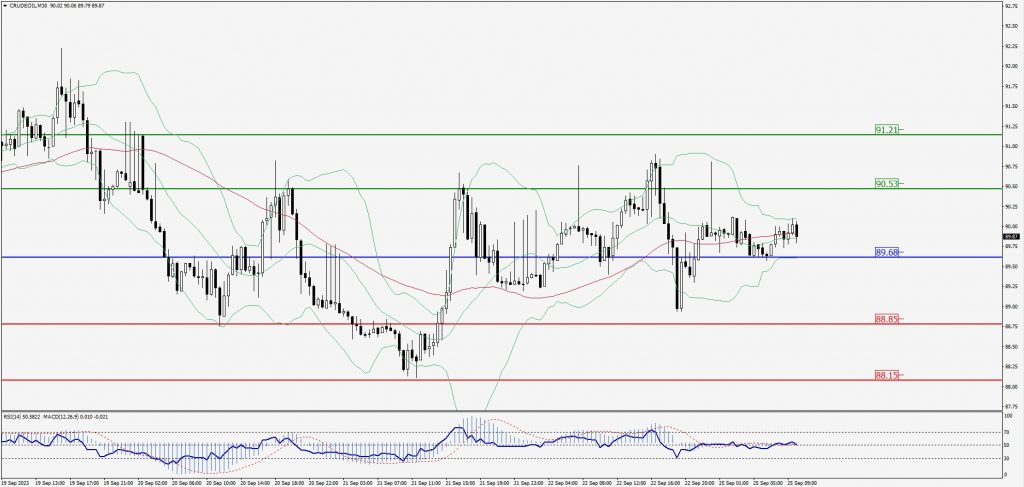
Green Lines Indicate Resistance Levels – Red Lines Indicate Support Levels
Light Blue is a Pivot Point – Black represents the price when the report was produced
XAU/USD Intraday: Trend on the upside
Our pivot point is 1924.20
Preferable Price Action: Further upside to 1930.70 and 1935.30.
Alternative Price Action: If the price gives a downside breakout of a pivot, then the price extends to 1918.40 and 1914.50.
Comment: MACD is above 50 level and Pairs above 20MA.
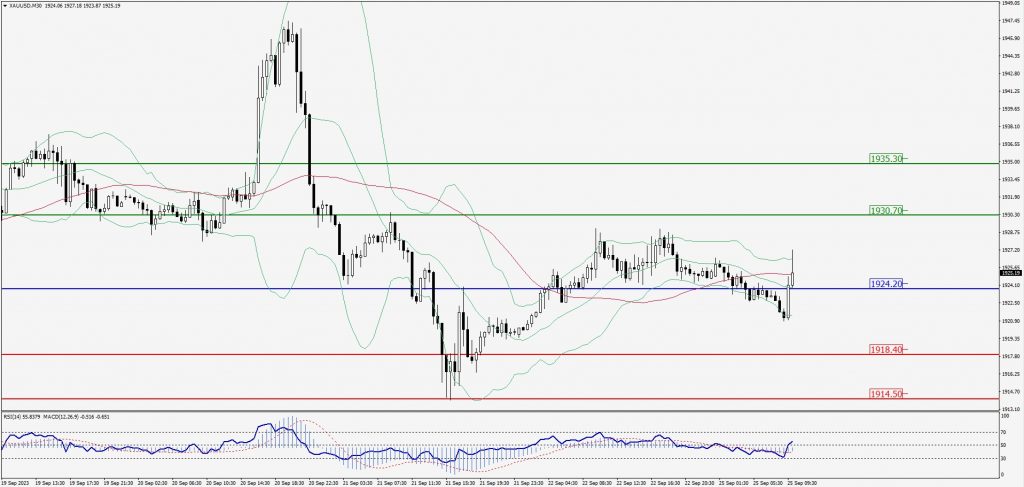
Green Lines Indicate Resistance Levels – Red Lines Indicate Support Levels
Light Blue is a Pivot Point – Black represents the price when the report was produced
Dow Jones Intraday: Support level at 34,042.00
Our pivot point is 34,042.00
Preferable Price Action: Take buy positions above the pivot with targets at 34,208.00 & 34,335.00.
Alternative Price Action: Below 34,042.00 looks for further downside to 33,906.00 & 33,819.00.
Comment: RSI is above 50 levels and Pairs above 20MA.
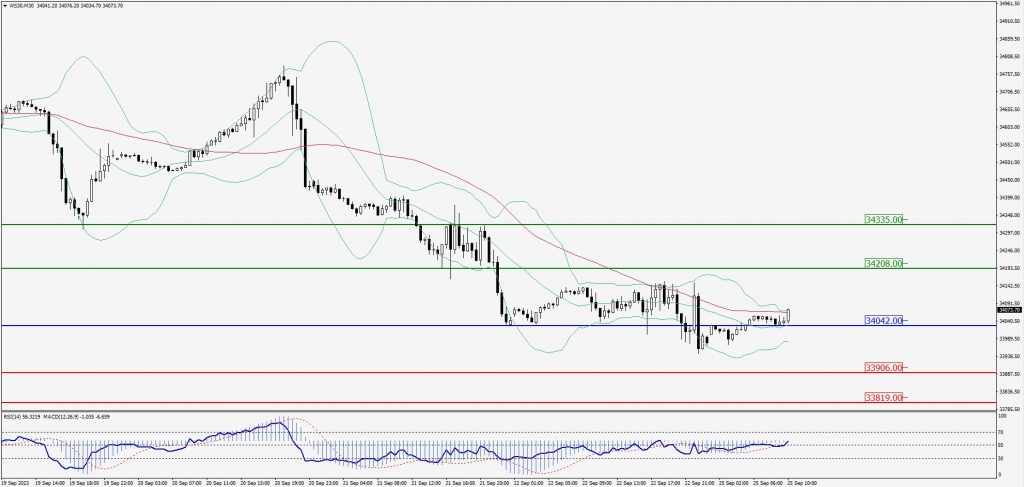
Green Lines Indicate Resistance Levels – Red Lines Indicate Support Levels
Light Blue is a Pivot Point – Black represents the price when the report was produced