Market Wrap: Stocks, Bonds, Commodities
The United Auto Workers union launched simultaneous strikes at three factories owned by General Motors, Ford and Chrysler owner Stellantis on Friday, kicking off the most ambitious U.S. industrial labor action in decades.
The Dow Jones Industrial Average rose 331.58 points to 34,907.11, the S&P 500 rose 0.84% to 4,505.10 and the Nasdaq Composite add 112.47 points to 13,926.05.
MSCI’s index of Asia-Pacific stocks outside Japan is advance 0.52% to 626.04 levels. The Australian index was higher by 1.29% to 7,279.00. Japanese Nikkei Index ascend 1.11% today.
European stocks were positive on Friday, with the Stoxx Europe 50 Index rose 1.08% to 4,325.85, Germany’s DAX ascend 1.14% to 15,987.55, and France’s CAC advance 1.56% to 7,422.80 and U.K.’s FTSE 100 add 0.73% to 7,741.16.
Benchmark 10-year U.S. Treasury fell as demand for safe assets ascend again, today 10-year bond yields positive 0.12% to 4.3240.
Oil prices rose on Friday and are set for a third weekly gain, as better-than-expected Chinese economic data and reports of record oil consumption bolstered the view that demand in the world’s second-largest crude consumer will continue to surge.
Spot Brent crude oil ascend 0.29% to $93.97 per barrel. US West Texas Intermediate crude is up 0.38% to $90.50 a barrel.
The yellow metal gold is advance 0.34% to 1,939.45 dollars per ounce.
Market Wrap: Forex
The U.S. dollar was just below a six-month high in early European trading on Friday, having strengthened overnight following U.S. economic data, while the yuan got a boost from better-than-expected Chinese data.
Today, the U.S. dollar index measures the Greenback against a trade-weighted basket of six major currencies, which slipped 0.17% to 104.870.
The Euro US Dollar (EUR/USD) is a widely traded pair that is up 0.23% today. This left the pair trading around $1.06660.
The Japanese yen was negative against the U.S. dollar on Friday. Today USD/JPY is surged 0.22% to the 147.800 level.
Another commodity-related currency positive against the U.S dollar, AUD/USD rose 0.21% to 0.64520, and NZD/USD surged 0.12% to 0.59160 level.
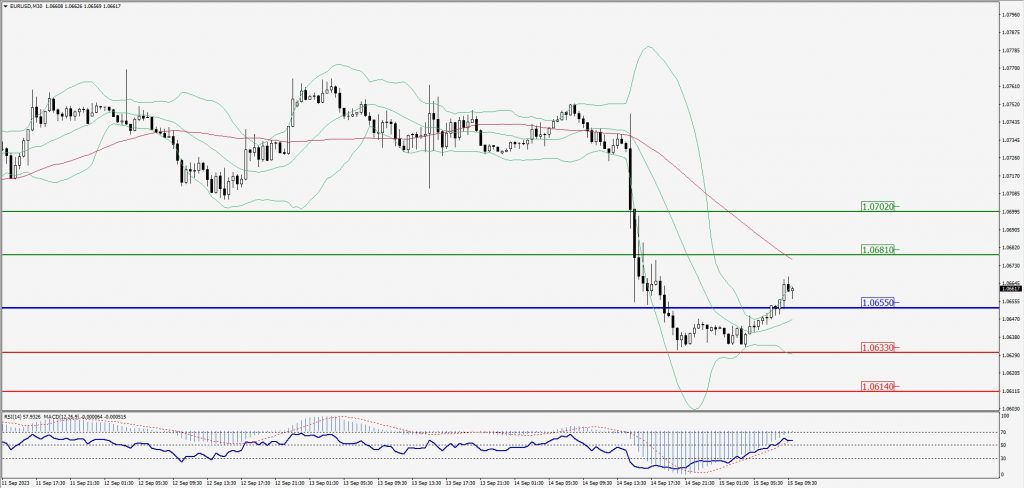
EUR/USD Intraday: Trend on the upside
Our pivot point is at 1.06550
Preferable Price Action: Take buy positions above pivot level with targets at 1.06810 & 1.07020 in extension.
Alternative Price Action: Below pivot looks for a further downside to 1.06330 & 1.06140.
Comment: RSI is above 50 levels and Pairs above its 20MA.
Green Lines Indicate Resistance Levels – Red Lines Indicate Support Levels
Light Blue is a Pivot Point – Black represents the price when the report was produced
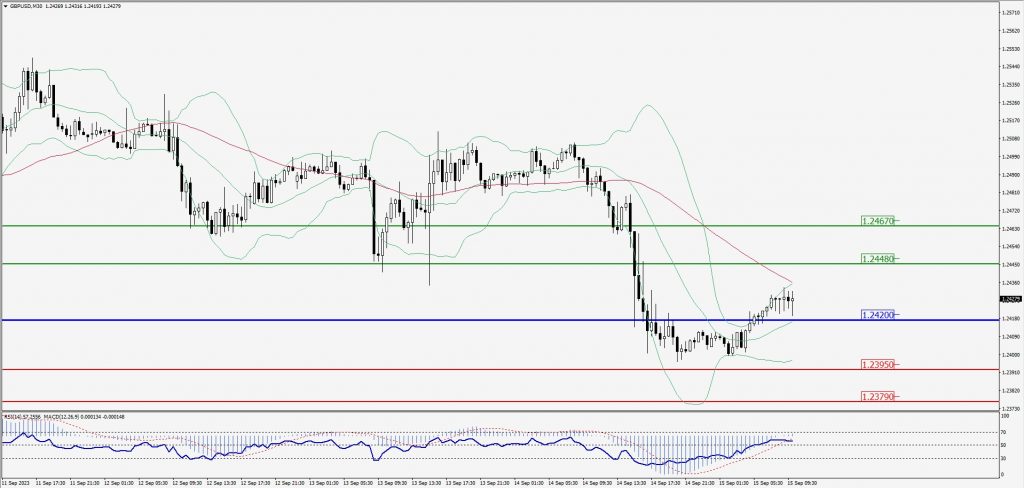
GBP/USD Intraday: Trend on the upside
Our pivot point is at 1.24200
Preferable Price Action: Buy positions above pivot with targets at 1.24480 & 1.24670 in extension.
Alternative Price Action: The price below pivot would call for further downside to 1.23950 & 1.23790.
Comment: RSI is above 50 levels and Pairs above 20MA.
Green Lines Indicate Resistance Levels – Red Lines Indicate Support Levels
Light Blue is a Pivot Point – Black represents the price when the report was produced
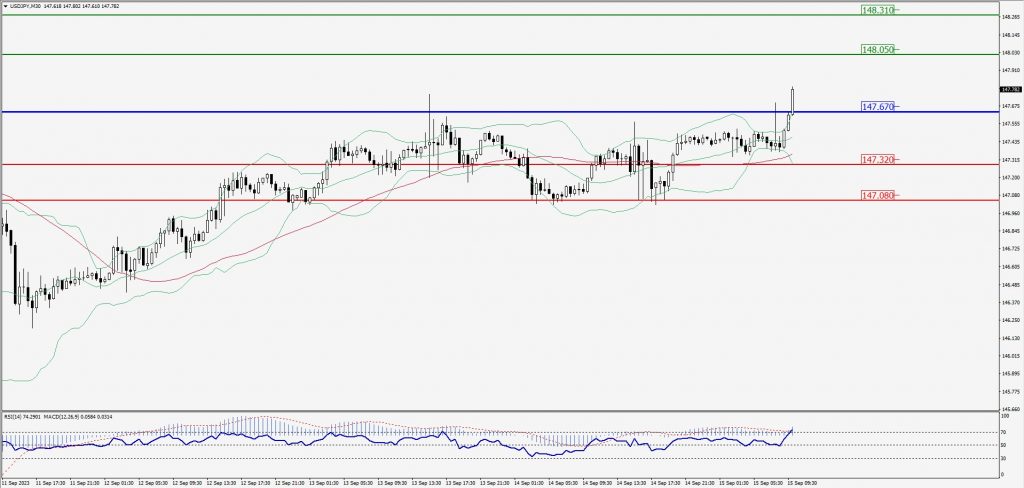
USD/JPY Intraday: Major trend on the upside
Our pivot point is at 147.670
Preferable Price Action: Buy position above pivot with the target at 148.050 and 148.310 in extension.
Alternative Price Action: The downside breakout of the pivot would call for 147.320 and 147.080.
Comment: MACD is above 50 level and Pairs above its 20MA & 55MA.
Green Lines Indicate Resistance Levels – Red Lines Indicate Support Levels
Light Blue is a Pivot Point – Black represents the price when the report was produced
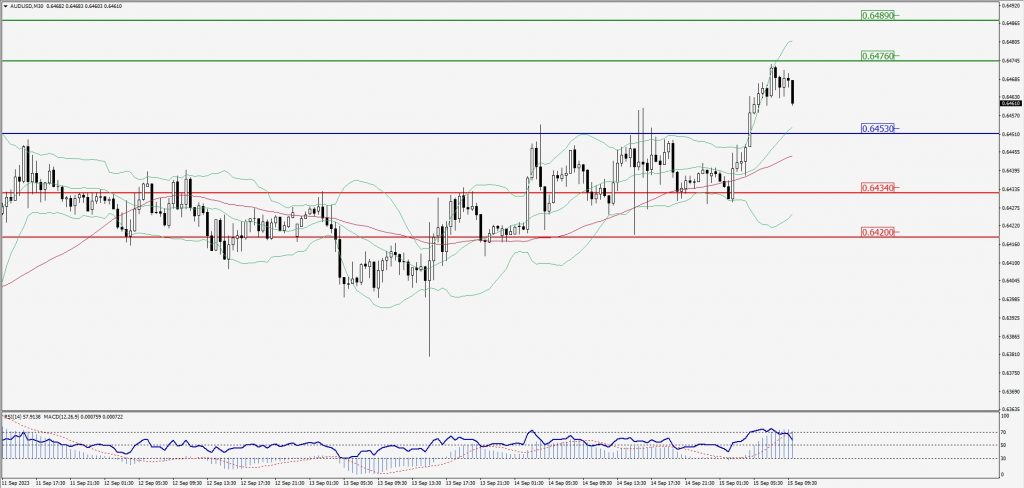
AUD/USD Intraday: Trend on the upside
Our pivot point is at 0.64530
Preferable Price Action: Buy positions above pivot with targets at 0.64760 & 0.64890 in extension.
Alternative Price Action: Below pivot looks for a further downside with 0.64340 & 0.64200 as targets.
Comment: RSI is above 50 levels and Pairs above its 20MA & 55MA.
Green Lines Indicate Resistance Levels – Red Lines Indicate Support Levels
Light Blue is a Pivot Point – Black represents the price when the report was produced
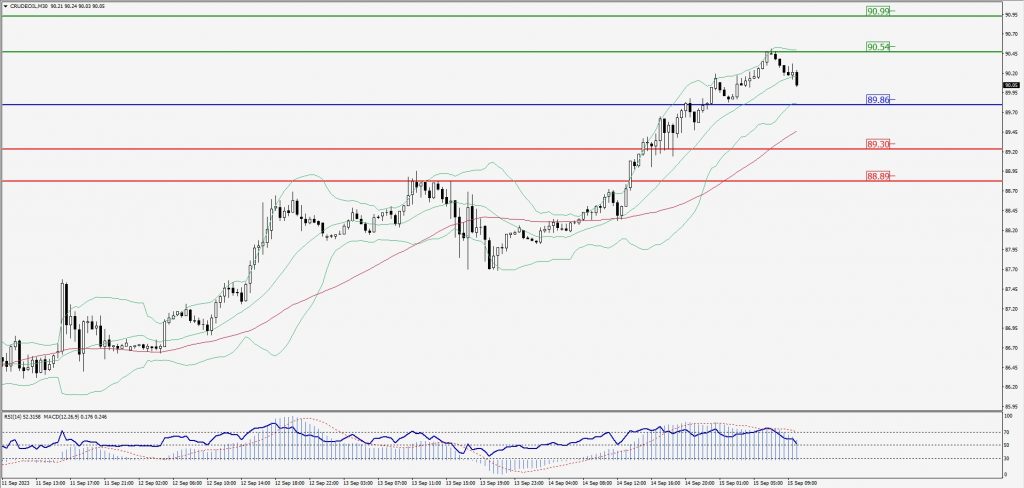
CRUDEOIL Intraday: Trend on the upside
Our pivot point is at 89.86
Preferable Price Action: Above pivot buy oil with 90.54 & 90.99 as targets.
Alternative Price Action: Sell crude below pivot with targets at 89.30 and 88.89 in extension.
Comment: MACD is positive territory and Pairs above 55MA.
Green Lines Indicate Resistance Levels – Red Lines Indicate Support Levels
Light Blue is a Pivot Point – Black represents the price when the report was produced
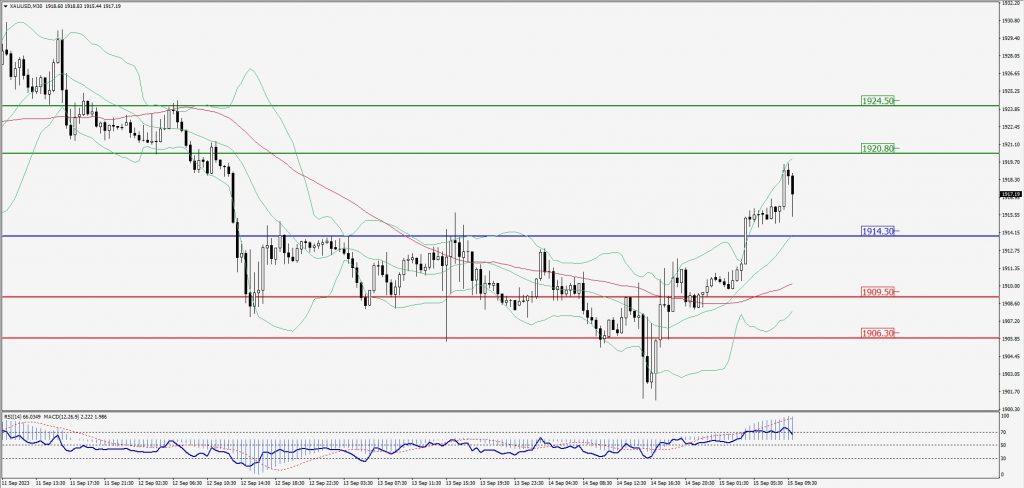
XAU/USD Intraday: Major trend on the upside
Our pivot point is 1914.30
Preferable Price Action: Further upside to 1920.80 and 1924.50.
Alternative Price Action: If the price gives a downside breakout of a pivot, then the price extends to 1909.50 and 1906.30.
Comment: MACD is above 50 level and Pairs above its 20MA & 55MA.
Green Lines Indicate Resistance Levels – Red Lines Indicate Support Levels
Light Blue is a Pivot Point – Black represents the price when the report was produced
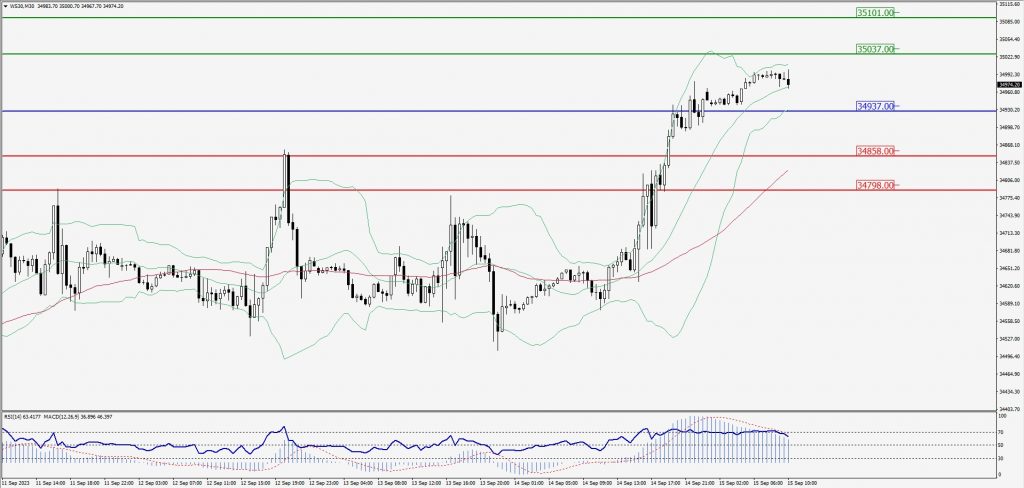
Dow Jones Intraday: Trend on the upside
Our pivot point is 34,937.00
Preferable Price Action: Take buy positions above the pivot with targets at 35,037.00 & 35,101.00.
Alternative Price Action: Below 34,937.00 looks for further downside to 34,858.00 & 34,798.00.
Comment: RSI is above 50 levels and Pairs above its 20MA & 55MA.
Green Lines Indicate Resistance Levels – Red Lines Indicate Support Levels
Light Blue is a Pivot Point – Black represents the price when the report was produced