Market Wrap: Stocks, Bonds, Commodities
The S&P 500, which began rallying 11 months ago following a hotter-than-expected inflation report, is unlikely to witness a similar move in response to the recent inflation data, according to Jonathan Krinsky, chief market technician at BTIG.
The Dow Jones Industrial Average fell 70.46 points to 34,575.53, the S&P 500 rose 0.12% to 4,467.44 and the Nasdaq Composite add 39.96 points to 13,813.53.
MSCI’s index of Asia-Pacific stocks outside Japan is advance 0.66% to 622.39 levels. The Australian index was higher by 0.46% to 7,186.50. Japanese Nikkei Index ascend 1.52% today.
European stocks were negative on Thursday, with the Stoxx Europe 50 Index fell 0.04% to 4,223.15, Germany’s DAX drop 0.10% to 15,640.25, and France’s CAC decline 0.11% to 7,214.46 and U.K.’s FTSE 100 add 0.59% to 7,570.74.
Benchmark 10-year U.S. Treasury fell as demand for safe assets ascend again, today 10-year bond yields positive 0.12% to 4.2530.
Oil rebounded on Thursday as expectations of a tighter global crude supply outlook for the rest of 2023 overshadowed concerns over weaker economic growth and rising U.S. inventories.
Spot Brent crude oil ascend 0.54% to $92.39 per barrel. US West Texas Intermediate crude is up 0.59% to $89.04 a barrel.
The yellow metal gold is decline 0.20% to 1,928.55 dollars per ounce.
Market Wrap: Forex
The U.S. dollar edged lower in early European trade Thursday after U.S. inflation release, while the euro climbed from recent lows ahead of the European Central Bank’s eagerly-awaited rate-setting meeting.
Today, the U.S. dollar index measures the Greenback against a trade-weighted basket of six major currencies, which slipped 0.04% to 104.350.
The Euro US Dollar (EUR/USD) is a widely traded pair that is up 0.08% today. This left the pair trading around $1.07360.
The Japanese yen was negative against the U.S. dollar on Thursday. Today USD/JPY is slipped 0.12% to the 147.270 level.
Another commodity-related currency positive against the U.S dollar, AUD/USD rose 0.22% to 0.64350, and NZD/USD surged 0.10% to 0.59240 level.
EUR/USD Intraday: Trend on the downside
Our pivot point is at 1.07440
Preferable Price Action: Take sell positions below pivot level with targets at 1.07260 & 1.07170 in extension.
Alternative Price Action: Above pivot looks for a further upside to 1.07600 & 1.07690.
Comment: RSI is below 50 levels.
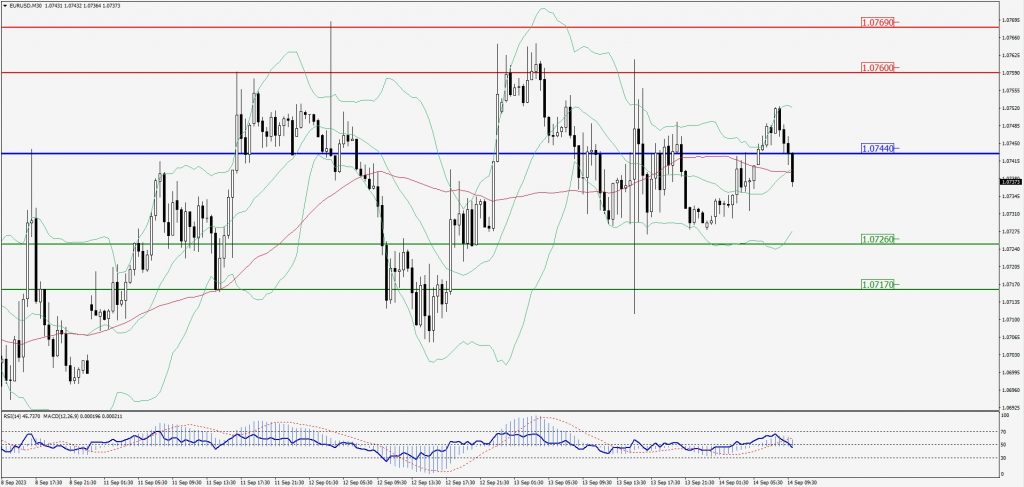
Green Lines Indicate Resistance Levels – Red Lines Indicate Support Levels
Light Blue is a Pivot Point – Black represents the price when the report was produced
GBP/USD Intraday: Resistance level at 1.24990
Our pivot point is at 1.24990
Preferable Price Action: Sell positions below pivot with targets at 1.24690 & 1.24520 in extension.
Alternative Price Action: The price above pivot would call for further upside to 1.25240 & 1.25420.
Comment: RSI is below 50 levels and Pairs below 20MA.
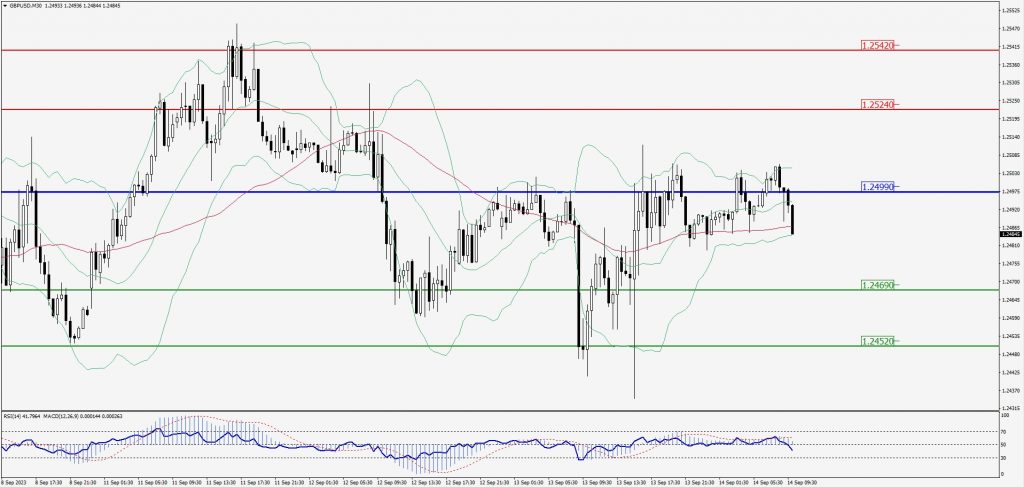
Green Lines Indicate Resistance Levels – Red Lines Indicate Support Levels
Light Blue is a Pivot Point – Black represents the price when the report was produced
USD/JPY Intraday: Trend on the downside
Our pivot point is at 147.310
Preferable Price Action: Sell position below pivot with the target at 146.880 and 146.630 in extension.
Alternative Price Action: The upside breakout of the pivot would call for 147.660 and 147.890.
Comment: MACD is below 50 level and Pairs below 55MA.
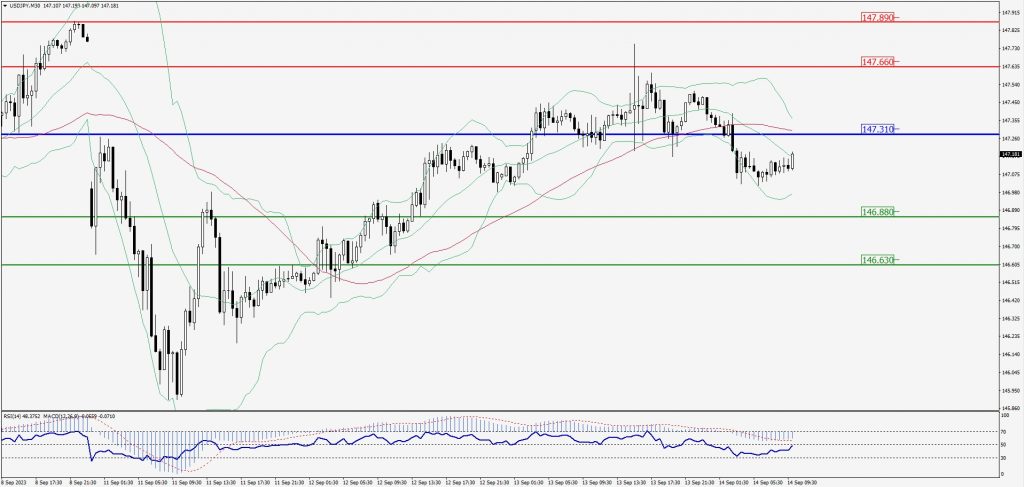
Green Lines Indicate Resistance Levels – Red Lines Indicate Support Levels
Light Blue is a Pivot Point – Black represents the price when the report was produced
AUD/USD Intraday: In a consolidation zone
Our pivot point is at 0.64380
Preferable Price Action: Sell positions below pivot with targets at 0.64180 & 0.64030 in extension.
Alternative Price Action: Above pivot looks for a further upside with 0.64560 & 0.64680 as targets.
Comment: RSI is at 50 levels and Pairs below 20MA.
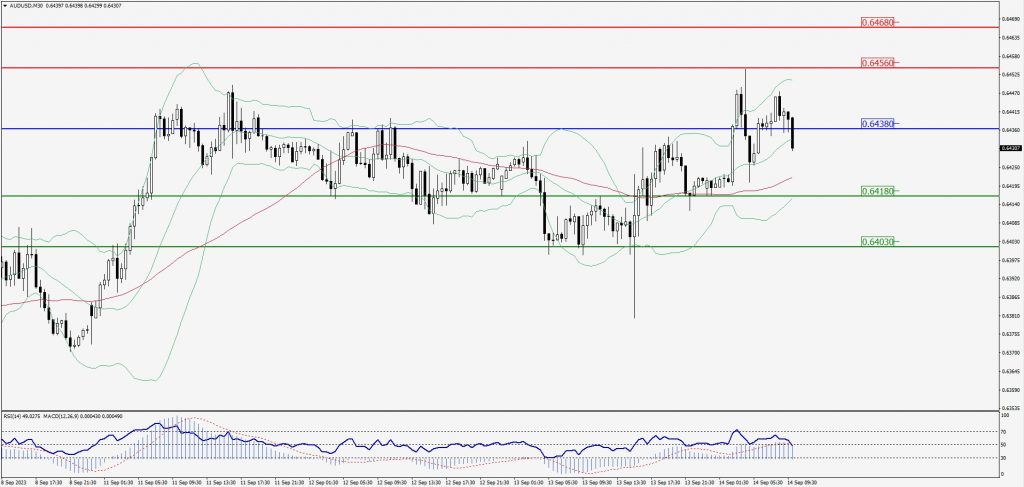
Green Lines Indicate Resistance Levels – Red Lines Indicate Support Levels
Light Blue is a Pivot Point – Black represents the price when the report was produced
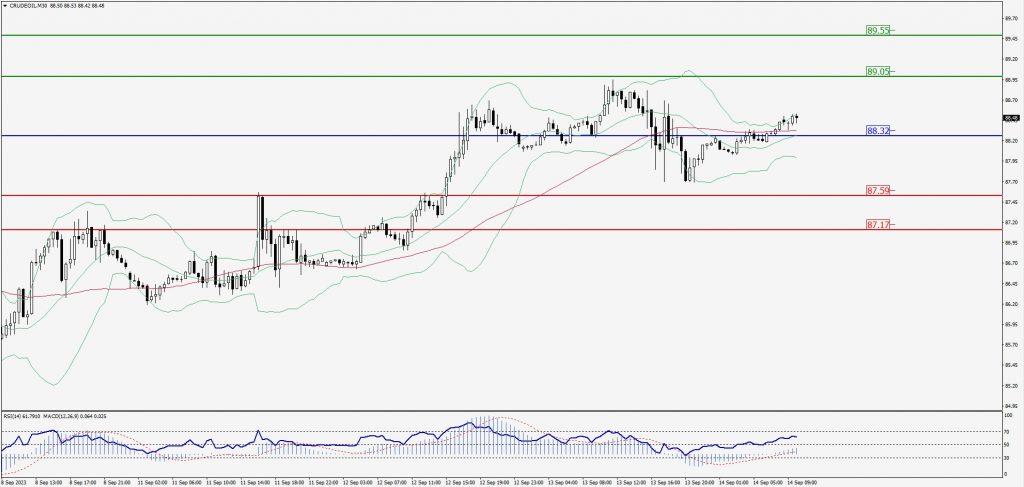
CRUDEOIL Intraday: Support level at 88.32
Our pivot point is at 88.32
Preferable Price Action: Above pivot buy oil with 89.05 & 89.55 as targets.
Alternative Price Action: Sell crude below pivot with targets at 87.59 and 87.17 in extension.
Comment: MACD is positive territory and Pairs above its 20MA & 55MA.
Green Lines Indicate Resistance Levels – Red Lines Indicate Support Levels
Light Blue is a Pivot Point – Black represents the price when the report was produced
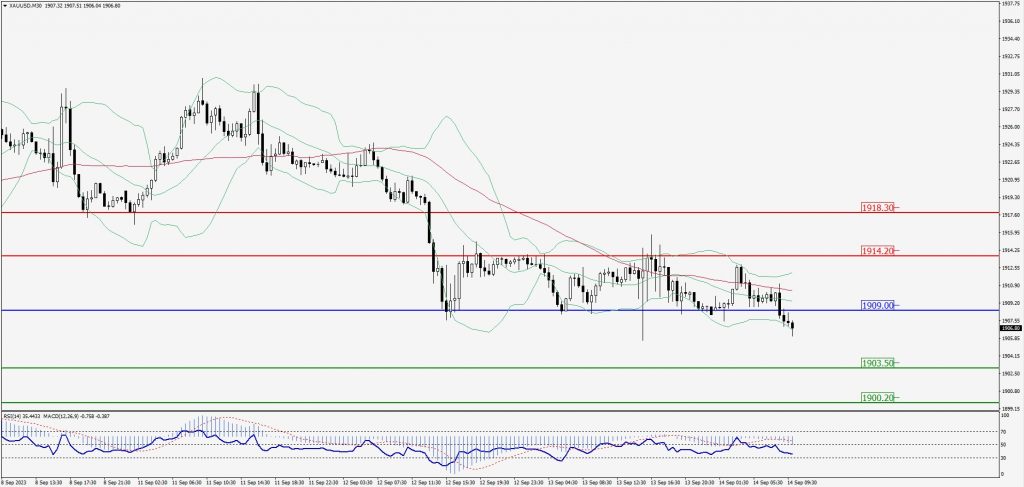
XAU/USD Intraday: Trend on the downside
Our pivot point is 1909.00
Preferable Price Action: Further downside to 1903.50 and 1900.20.
Alternative Price Action: If the price gives an upside breakout of a pivot, then the price extends to 1914.20 and 1918.30.
Comment: MACD is below 50 level and Pairs below its 20MA & 55MA.
Green Lines Indicate Resistance Levels – Red Lines Indicate Support Levels
Light Blue is a Pivot Point – Black represents the price when the report was produced
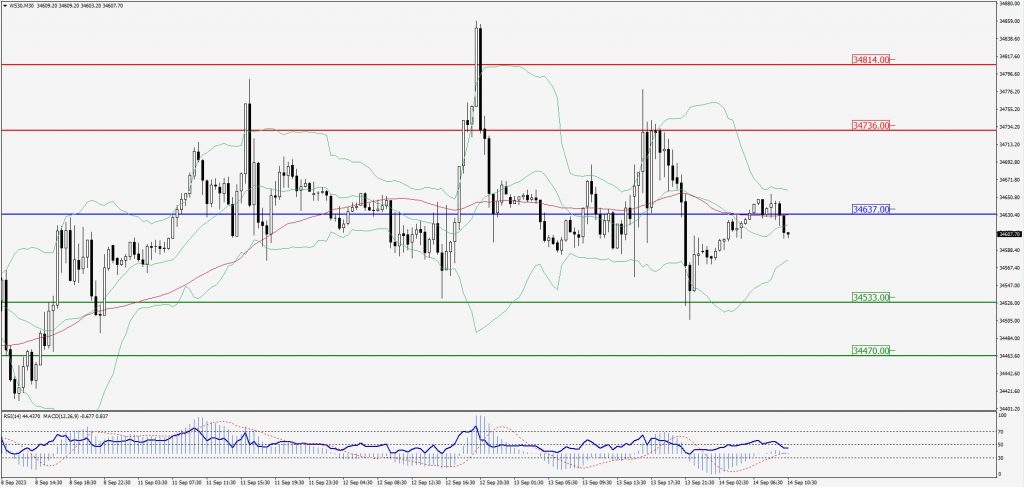
Dow Jones Intraday: Trend on the downside
Our pivot point is 34,637.00
Preferable Price Action: Take sell positions below the pivot with targets at 34,533.00 & 34,470.00.
Alternative Price Action: Above 34,637.00 looks for further upside to 34,736.00 & 34,814.00.
Comment: RSI is below 50 levels and Pairs below 55MA.
Green Lines Indicate Resistance Levels – Red Lines Indicate Support Levels
Light Blue is a Pivot Point – Black represents the price when the report was produced