Market Wrap: Stocks, Bonds, Commodities
U.S. stock investors are turning their focus to next week’s inflation data, which could determine the near-term path of an equity rally that has wobbled in recent weeks.
The Dow Jones Industrial Average rose 75.86 points to 34,576.59, the S&P 500 gain 0.14% to 4,457.49 and the Nasdaq Composite add 12.69 points to 13,761.53.
MSCI’s index of Asia-Pacific stocks outside Japan is advance 0.10% to 620.27 levels. The Australian index was higher by 0.50% to 7,192.30. Japanese Nikkei Index drop 0.41% today.
European stocks were positive on Monday, with the Stoxx Europe 50 Index rose 0.27% to 4,248.75, Germany’s DAX ascend 0.26% to 15,780.41, and France’s CAC advance 0.34% to 7,265.54 and U.K.’s FTSE 100 add 0.21% to 7,494.20.
Benchmark 10-year U.S. Treasury fell as demand for safe assets ascend again, today 10-year bond yields positive 0.61% to 4.2840.
Oil prices eased on Monday as a stronger U.S. dollar and economic concerns in China weighed on the outlook for fuel demand, but extended supply cuts by Saudi Arabia and Russia helped keep Brent above $90 a barrel.
Spot Brent crude oil drop 0.49% to $90.20 per barrel. US West Texas Intermediate crude is down 0.74% to $86.86 a barrel.
The yellow metal gold is advance 0.39% to 1,950.35 dollars per ounce.
Market Wrap: Forex
The U.S. dollar fell in early European trade Monday, retreating from a six-month high, while the Japanese yen surged as comments from Bank of Japan Governor Kazuo Ueda signaled a potential change in monetary policy.
Today, the U.S. dollar index measures the Greenback against a trade-weighted basket of six major currencies, which slipped 0.41% to 104.280.
The Euro US Dollar (EUR/USD) is a widely traded pair that is up 0.25% today. This left the pair trading around $1.07260.
The Japanese yen was negative against the U.S. dollar on Monday. Today USD/JPY is slipped 0.96% to the 146.390 level.
Another commodity-related currency positive against the U.S dollar, AUD/USD rose 0.92% to 0.64330, and NZD/USD surged 0.71% to 0.59210 level.
EUR/USD Intraday: Trend on the upside
Our pivot point is at 1.07320
Preferable Price Action: Take buy positions above pivot level with targets at 1.07480 & 1.07580 in extension.
Alternative Price Action: Below pivot looks for a further downside to 1.07190 & 1.07090.
Comment: RSI is above 50 levels and Pairs above its 20MA & 55MA.
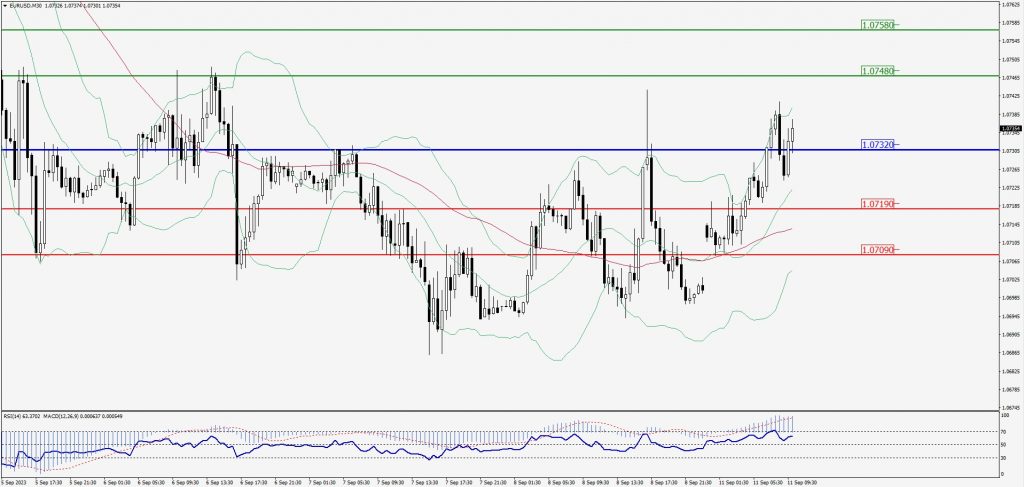
Green Lines Indicate Resistance Levels – Red Lines Indicate Support Levels
Light Blue is a Pivot Point – Black represents the price when the report was produced
GBP/USD Intraday: Trend on the upside
Our pivot point is at 1.25090
Preferable Price Action: Buy positions above pivot with targets at 1.25380 & 1.25570 in extension.
Alternative Price Action: The price below pivot would call for further downside to 1.24850 & 1.24690.
Comment: RSI is above 50 levels and Pairs above its 20MA & 55MA.
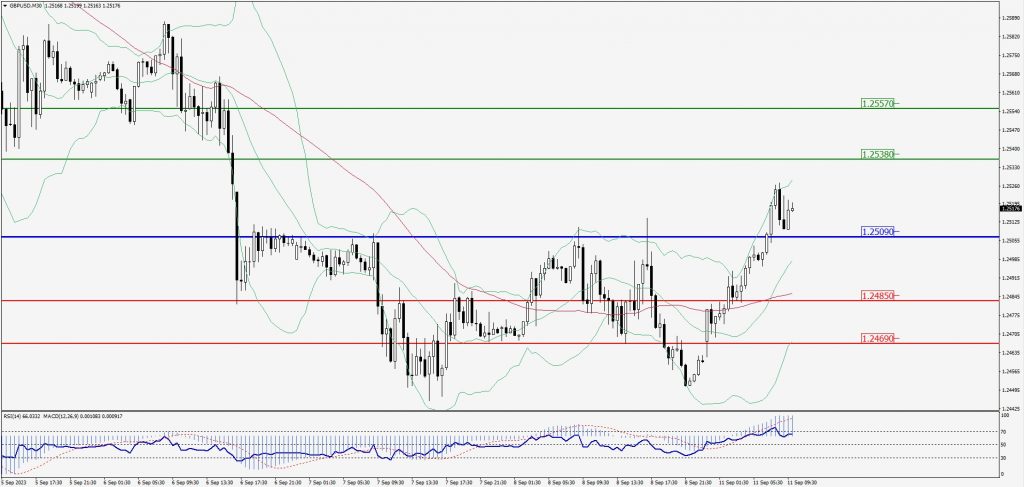
Green Lines Indicate Resistance Levels – Red Lines Indicate Support Levels
Light Blue is a Pivot Point – Black represents the price when the report was produced
USD/JPY Intraday: Major trend on the downside
Our pivot point is at 146.240
Preferable Price Action: Sell position below pivot with the target at 145.700 and 145.380 in extension.
Alternative Price Action: The upside breakout of the pivot would call for 146.670 and 147.040.
Comment: MACD is below 50 level and Pairs below its 20MA & 55MA.
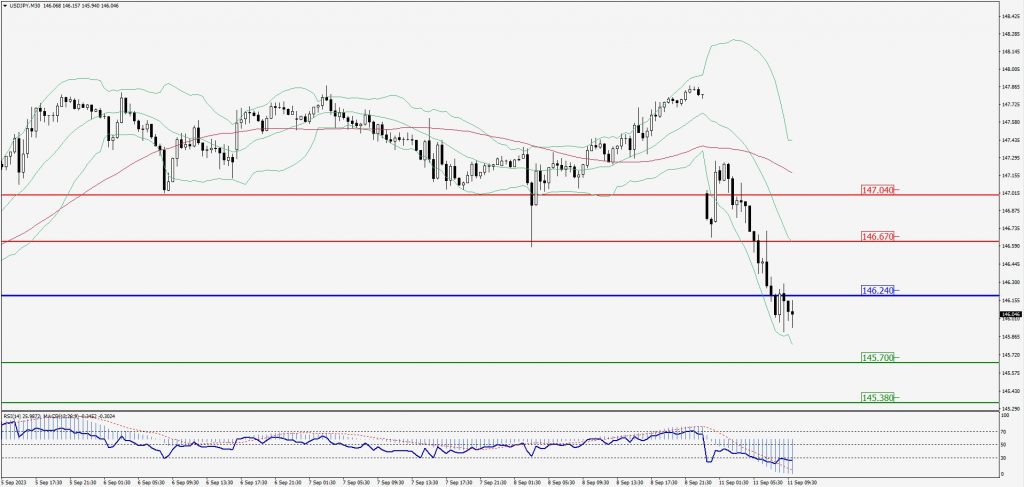
Green Lines Indicate Resistance Levels – Red Lines Indicate Support Levels
Light Blue is a Pivot Point – Black represents the price when the report was produced
AUD/USD Intraday: Major trend on the upside
Our pivot point is at 0.64320
Preferable Price Action: Buy positions above pivot with targets at 0.64560 & 0.64690 in extension.
Alternative Price Action: Below pivot looks for a further downside with 0.64110 & 0.63960 as targets.
Comment: RSI is above 50 levels and Pairs above its 20MA & 55MA.
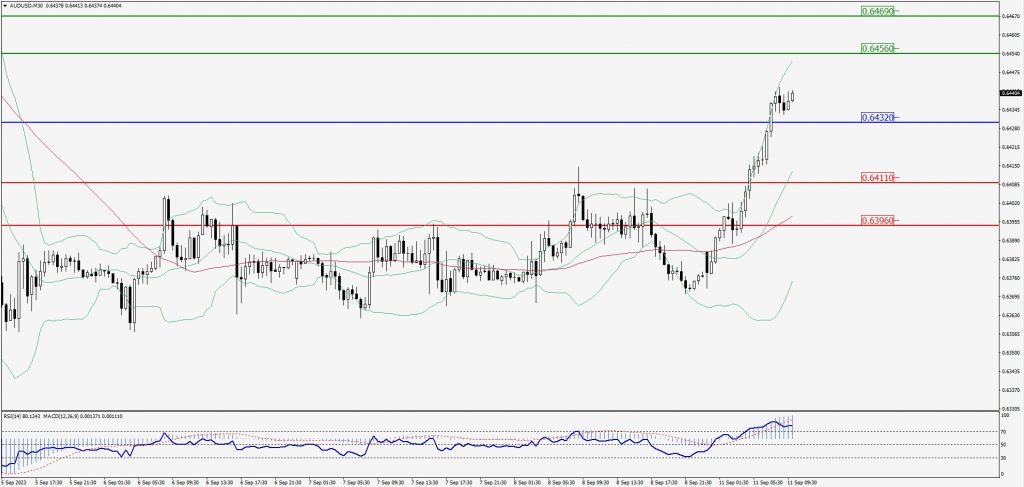
Green Lines Indicate Resistance Levels – Red Lines Indicate Support Levels
Light Blue is a Pivot Point – Black represents the price when the report was produced
CRUDEOIL Intraday: In a consolidation zone
Our pivot point is at 86.44
Preferable Price Action: Above pivot buy oil with 87.02 & 87.47 as targets.
Alternative Price Action: Sell crude below pivot with targets at 85.96 and 85.54 in extension.
Comment: MACD is flat territory.
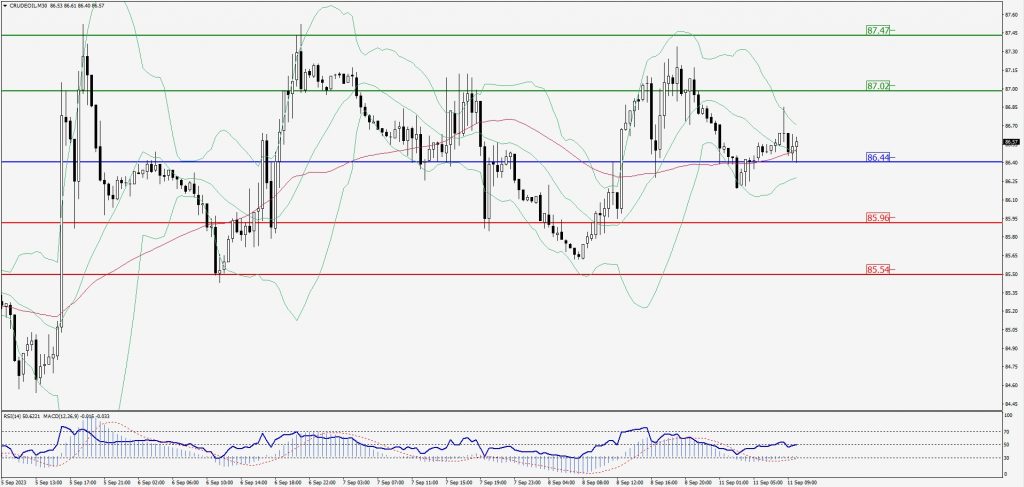
Green Lines Indicate Resistance Levels – Red Lines Indicate Support Levels
Light Blue is a Pivot Point – Black represents the price when the report was produced
XAU/USD Intraday: Major trend on the upside
Our pivot point is 1926.70
Preferable Price Action: Further upside to 1932.80 and 1937.10.
Alternative Price Action: If the price gives a downside breakout of a pivot, then the price extends to 1921.90 and 1918.20.
Comment: MACD is above 50 level and Pairs above its 20MA & 55MA.
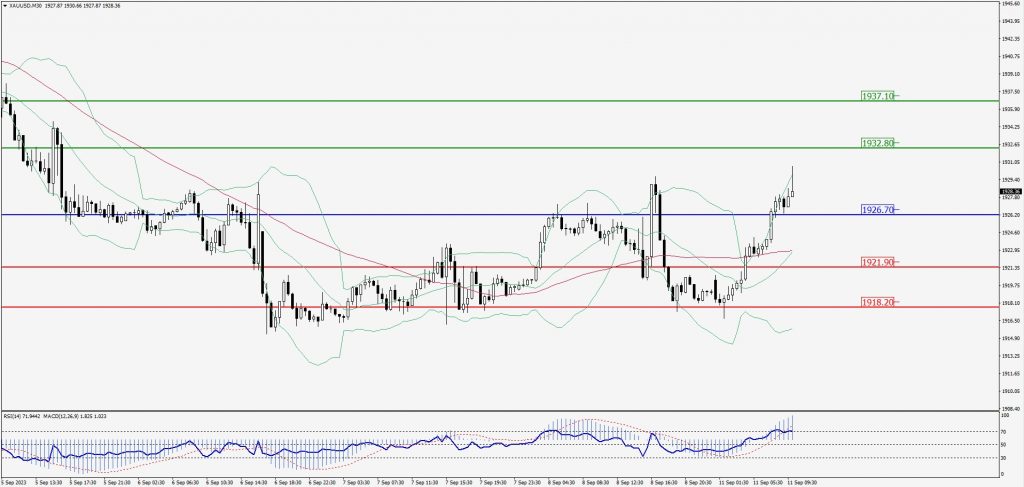
Green Lines Indicate Resistance Levels – Red Lines Indicate Support Levels
Light Blue is a Pivot Point – Black represents the price when the report was produced
Dow Jones Intraday: Support level at 34,668.00
Our pivot point is 34,668.00
Preferable Price Action: Take Buy positions above the pivot with targets at 34,778.00 & 34,847.00.
Alternative Price Action: Below 34,668.00 looks for further downside to 34,578.00 & 34,514.00.
Comment: RSI is above 50 levels and Pairs above its 20MA & 55MA.
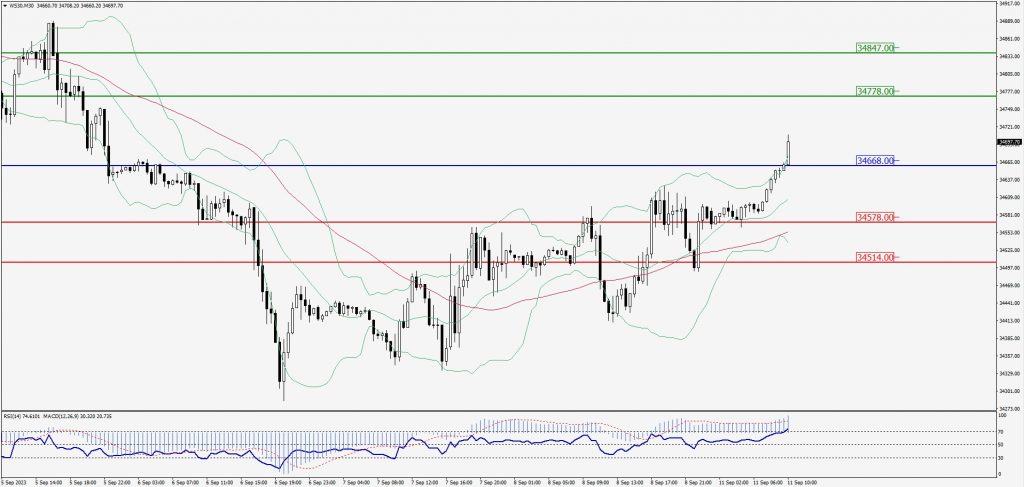
Green Lines Indicate Resistance Levels – Red Lines Indicate Support Levels
Light Blue is a Pivot Point – Black represents the price when the report was produced