Market Wrap: Stocks, Bonds, Commodities
Stock futures were little changed late Wednesday as renewed concern swirled on Wall Street over the course of the Federal Reserve’s interest rate policy, and whether policymakers will enact another hike this year.
The Dow Jones Industrial Average fell 198.78 points to 34,443.19, the S&P 500 lose 0.70% to 4,465.48 and the Nasdaq Composite subtract 148.48 points to 13,872.47.
MSCI’s index of Asia-Pacific stocks outside Japan is decline 0.86% to 619.98 levels. The Australian index was lower by 1.19% to 7,171.00. Japanese Nikkei Index drop 0.73% today.
European stocks were negative on Thursday, with the Stoxx Europe 50 Index fell 0.29% to 4,225.75, Germany’s DAX drop 0.25% to 15,701.85, and France’s CAC decline 0.12% to 7,186.02 and U.K.’s FTSE 100 subtract 0.36% to 7,398.51.
Benchmark 10-year U.S. Treasury fell as demand for safe assets ascend again, today 10-year bond yields negative 0.07% to 4.2900.
Oil prices reversed course on Wednesday after rising over 1 percent in the previous session, on a firmer dollar and as investors shrugged off jitters arising from supply cuts from Saudi Arabia and Russia. Brent crude futures were last down by 39 cents to $89.65 a barrel.
Spot Brent crude oil drop 0.35% to $90.29 per barrel. US West Texas Intermediate crude is down 0.43% to $87.16 a barrel.
The yellow metal gold is decline 0.13% to 1,941.65 dollars per ounce.
Market Wrap: Forex
The U.S. dollar steadied near a six-month peak in early European trade Thursday, boosted by signs of a resilient U.S. economy even as the global outlook weakened.
Today, the U.S. dollar index measures the Greenback against a trade-weighted basket of six major currencies, which surged 0.08% to 104.910.
The Euro US Dollar (EUR/USD) is a widely traded pair that is down 0.13% today. This left the pair trading around $1.07130.
The Japanese yen was negative against the U.S. dollar on Thursday. Today USD/JPY is slipped 0.09% to the 147.510 level.
Another commodity-related currency positive against the U.S dollar, AUD/USD rose 0.03% to 0.63850, and NZD/USD surged 0.24% to 0.58860 level.
EUR/USD Intraday: Resistance level at 1.07370
Our pivot point is at 1.07370
Preferable Price Action: Take sell positions below pivot level with targets at 1.06790 & 1.06450 in extension.
Alternative Price Action: Above pivot looks for a further upside to 1.07870 & 1.08240.
Comment: RSI is below 50 levels and Pairs below 55MA.
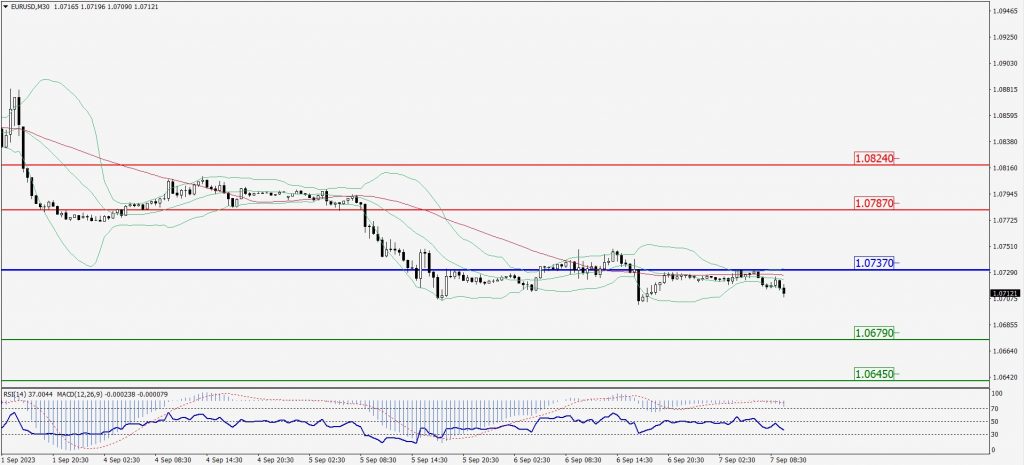
Green Lines Indicate Resistance Levels – Red Lines Indicate Support Levels
Light Blue is a Pivot Point – Black represents the price when the report was produced
GBP/USD Intraday: Trend on the downside
Our pivot point is at 1.25010
Preferable Price Action: Sell positions below pivot with targets at 1.24380 & 1.24040 in extension.
Alternative Price Action: The price above pivot would call for further upside to 1.25550 & 1.26000.
Comment: RSI is below 50 levels and Pairs below 55MA.
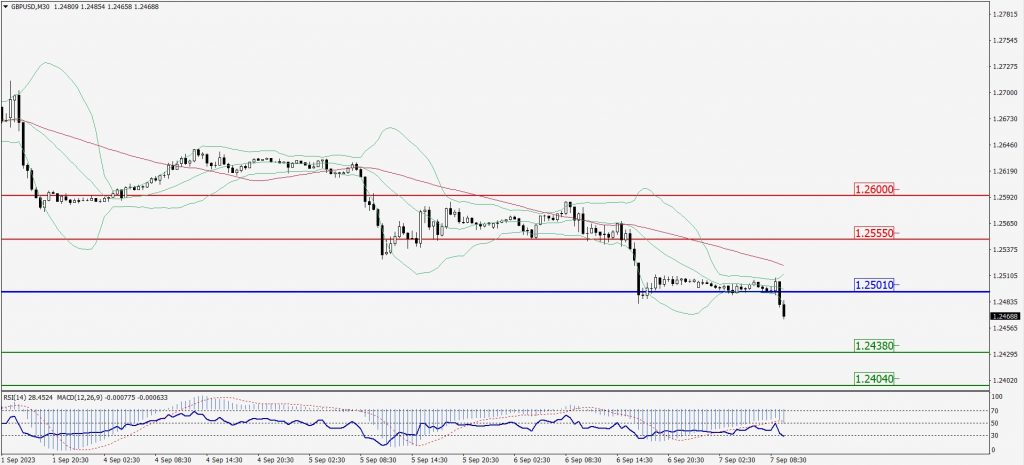
Green Lines Indicate Resistance Levels – Red Lines Indicate Support Levels
Light Blue is a Pivot Point – Black represents the price when the report was produced
USD/JPY Intraday: Trend on the downside
Our pivot point is at 147.900
Preferable Price Action: Sell position below pivot with the target at 147.020 and 146.460 in extension.
Alternative Price Action: The upside breakout of the pivot would call for 148.560 and 149.050.
Comment: MACD is below 50 level and Pairs below 20MA.
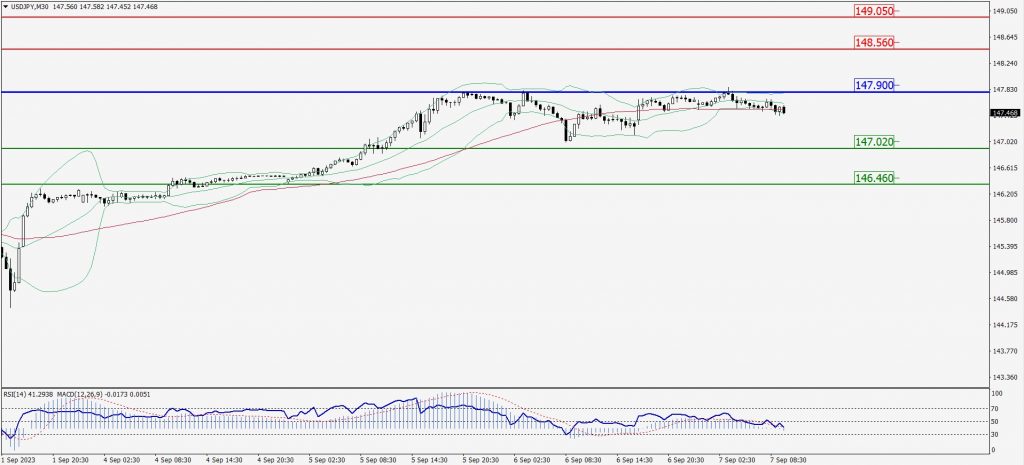
Green Lines Indicate Resistance Levels – Red Lines Indicate Support Levels
Light Blue is a Pivot Point – Black represents the price when the report was produced
AUD/USD Intraday: Support level at 0.63780
Our pivot point is at 0.63780
Preferable Price Action: Buy positions above pivot with targets at 0.64130 & 0.64400 in extension.
Alternative Price Action: Below pivot looks for a further upside with 0.64130 & 0.64400 as targets.
Comment: RSI is above 50 levels and Pairs above 20MA.
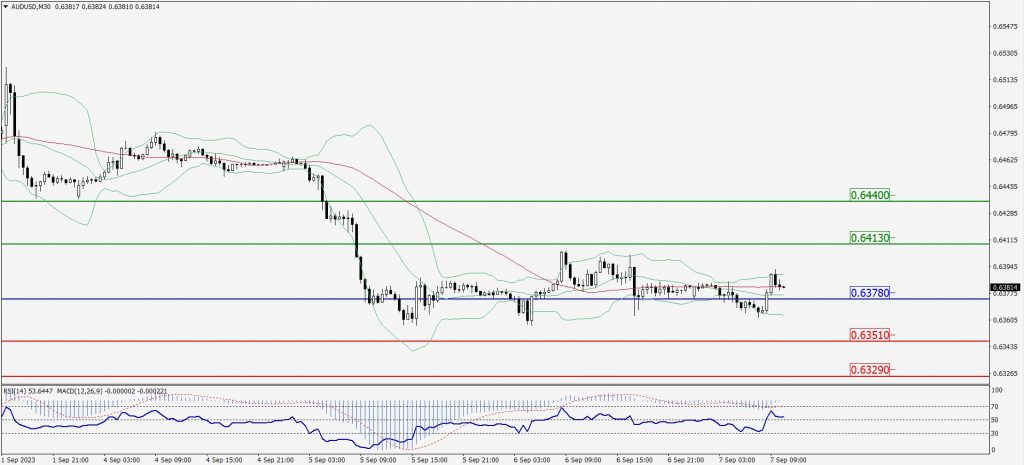
Green Lines Indicate Resistance Levels – Red Lines Indicate Support Levels
Light Blue is a Pivot Point – Black represents the price when the report was produced
CRUDEOIL Intraday: Trend on the downside
Our pivot point is at 87.14
Preferable Price Action: Below pivot sell oil with 86.10 & 85.37 as targets.
Alternative Price Action: Buy crude above pivot with targets at 88.01 and 88.69 in extension.
Comment: MACD is negative territory and Pairs below 20MA.
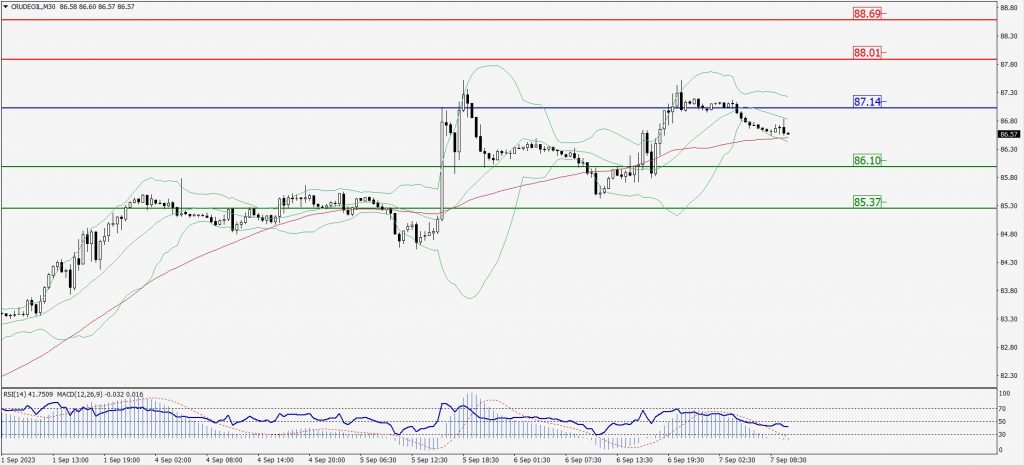
Green Lines Indicate Resistance Levels – Red Lines Indicate Support Levels
Light Blue is a Pivot Point – Black represents the price when the report was produced
XAU/USD Intraday: Trend on the downside
Our pivot point is 1922.60
Preferable Price Action: Further downside to 1913.10 and 1907.00.
Alternative Price Action: If the price gives an upside breakout of a pivot, then the price extends to 1931.50 and 1939.10.
Comment: MACD is below 50 level and Pairs below 55MA.
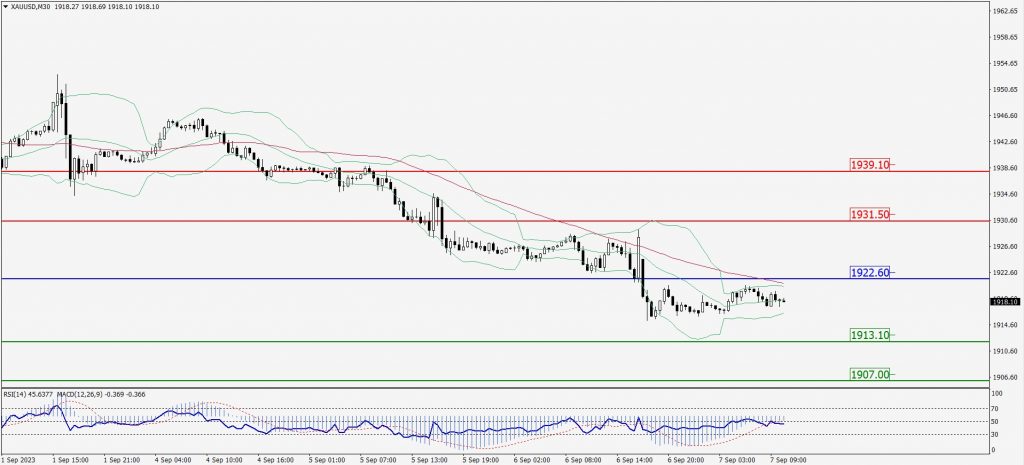
Green Lines Indicate Resistance Levels – Red Lines Indicate Support Levels
Light Blue is a Pivot Point – Black represents the price when the report was produced
Dow Jones Intraday: Trend on the downside
Our pivot point is 34,414.00
Preferable Price Action: Take sell positions below the pivot with targets at 34,278.00 & 34,187.00.
Alternative Price Action: Above 34,414.00 looks for further upside to 34,543.00 & 34,638.00.
Comment: RSI is below 50 levels and Pairs below its 20MA & 55MA.
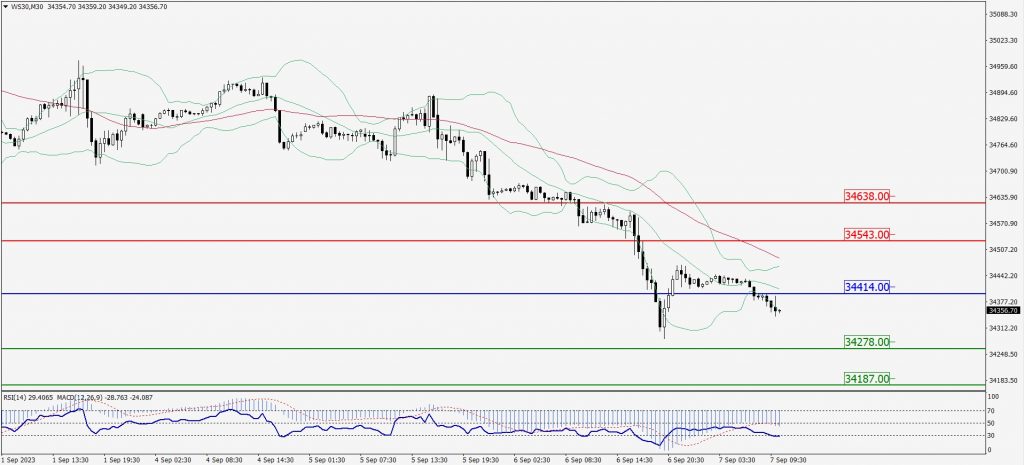
Green Lines Indicate Resistance Levels – Red Lines Indicate Support Levels
Light Blue is a Pivot Point – Black represents the price when the report was produced