Market Wrap: Stocks, Bonds, Commodities
Stocks fell sharply Thursday after a tech rally, sparked by stronger-than-expected Nvidia results, was short-lived. Traders also braced for a key speech from Federal Reserve Chairman Jerome Powell.
The Dow Jones Industrial Average fell 373.56 points to 34,099.42, the S&P 500 lose 1.36% to 4,376.31 and the Nasdaq Composite subtract 257.06 points to 13,463.97.
MSCI’s index of Asia-Pacific stocks outside Japan is decline 1.23% to 613.37 levels. The Australian index was lower by 0.93% to 7,115.20. Japanese Nikkei Index drop 2.01% today.
European stocks were positive on Friday, with the Stoxx Europe 50 Index rose 0.30% to 4,244.95, Germany’s DAX ascend 0.11% to 15,638.92, and France’s CAC advance 0.40% to 7,243.53 and U.K.’s FTSE 100 add 0.38% to 7,349.89.
Benchmark 10-year U.S. Treasury fell as demand for safe assets ascend again, today 10-year bond yields positive 0.38% to 4.2510.
Oil prices slipped on Thursday on disappointing economic data from key economies, with investors awaiting a speech by U.S. Federal Reserve Chair Jerome Powell on Friday for clues on interest rate moves.
Spot Brent crude oil ascend 1.14% to $84.30 per barrel. US West Texas Intermediate crude is up 1.15% to $79.96 a barrel.
The yellow metal gold is decline 0.22% to 1,942.75 dollars per ounce.
Market Wrap: Forex
China’s central bank has asked domestic lenders to scale back outward bond investments according to two sources with direct knowledge of the matter, the latest in series of increasingly strong steps to support the yuan.
Today, the U.S. dollar index measures the Greenback against a trade-weighted basket of six major currencies, which surged 0.20% to 104.122.
The Euro US Dollar (EUR/USD) is a widely traded pair that is down 0.22% today. This left the pair trading around $1.07850.
The Japanese yen was negative against the U.S. dollar on Friday. Today USD/JPY is surged 0.11% to the 146.020 level.
Another commodity-related currency mixed against the U.S dollar, AUD/USD rose 0.06% to 0.64230, and NZD/USD slipped 0.15% to 0.59110 level.
EUR/USD Intraday: Major trend on the downside
Our pivot point is at 1.07950
Preferable Price Action: Take sell positions below pivot level with targets at 1.07500 & 1.07230 in extension.
Alternative Price Action: Above pivot looks for a further upside to 1.08370 & 1.08630.
Comment: RSI is below 50 levels and Pairs below its 20MA & 55MA.
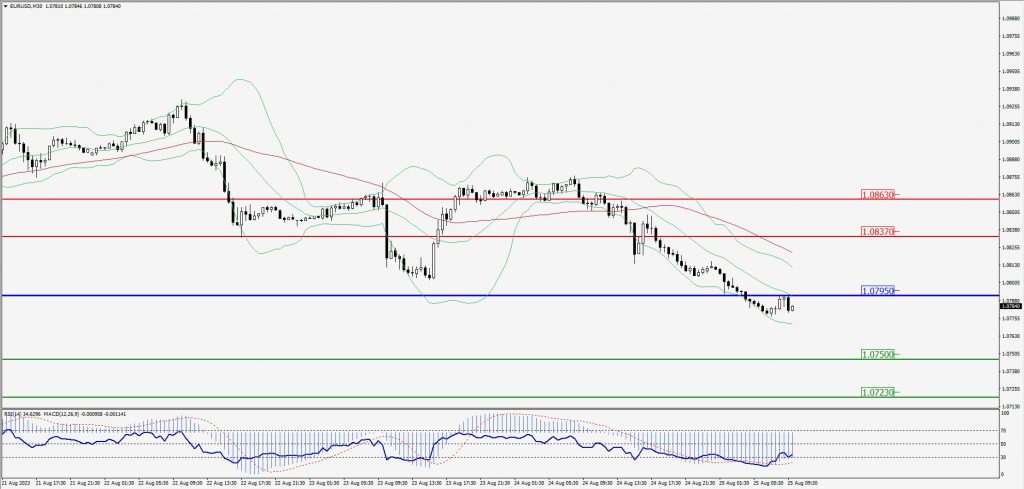
Green Lines Indicate Resistance Levels – Red Lines Indicate Support Levels
Light Blue is a Pivot Point – Black represents the price when the report was produced
GBP/USD Intraday: Trend on the downside
Our pivot point is at 1.25940
Preferable Price Action: Sell positions below pivot with targets at 1.25440 & 1.25150 in extension.
Alternative Price Action: The price above pivot would call for further upside to 1.26360 & 1.26700.
Comment: RSI is below 50 levels and Pairs below its 20MA & 55MA.
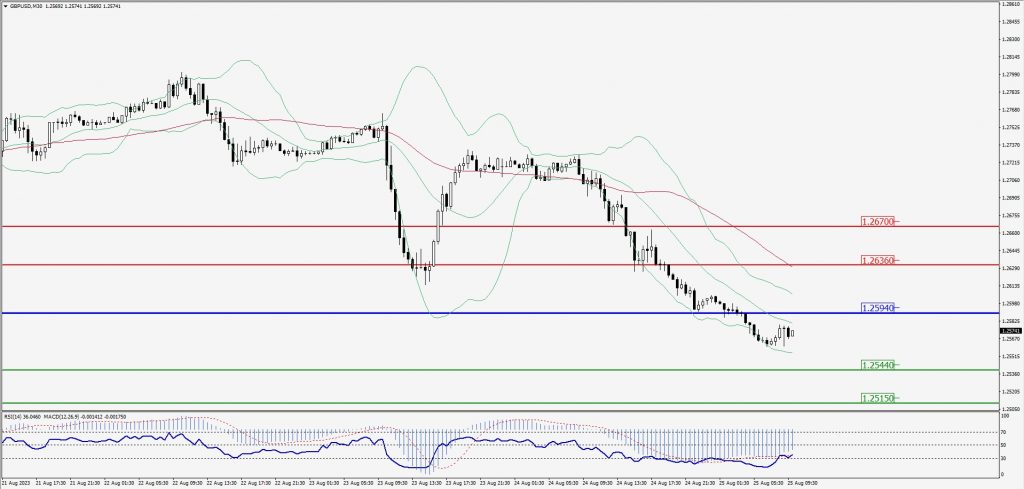
Green Lines Indicate Resistance Levels – Red Lines Indicate Support Levels
Light Blue is a Pivot Point – Black represents the price when the report was produced
USD/JPY Intraday: Trend on the upside
Our pivot point is at 145.940
Preferable Price Action: Buy position above pivot with the target at 146.230 and 146.440 in extension.
Alternative Price Action: The downside breakout of the pivot would call for 145.690 and 145.500.
Comment: MACD is above 50 level and Pairs above its 20MA & 55MA.
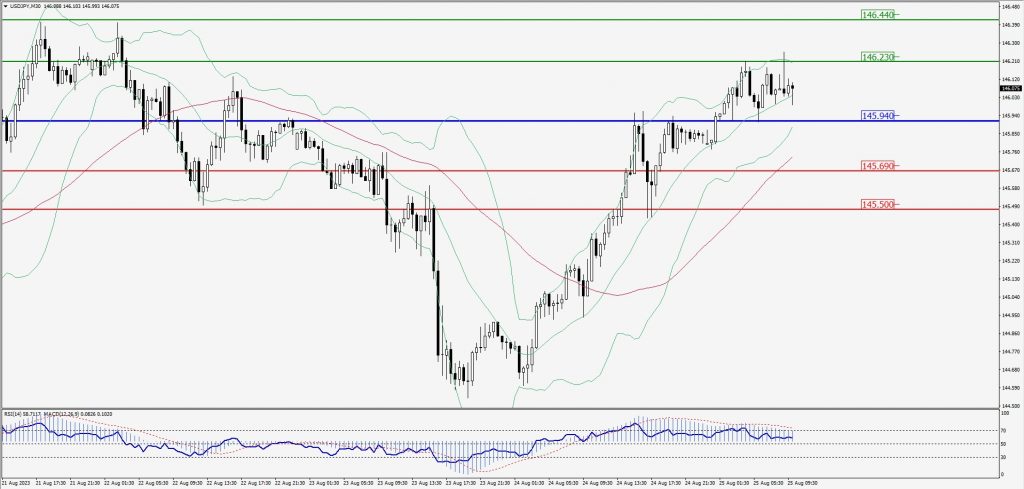
Green Lines Indicate Resistance Levels – Red Lines Indicate Support Levels
Light Blue is a Pivot Point – Black represents the price when the report was produced
AUD/USD Intraday: Support level at 0.64150
Our pivot point is at 0.64150
Preferable Price Action: Buy positions above pivot with targets at 0.64400 & 0.64550 in extension.
Alternative Price Action: Below pivot looks for a further downside with 0.63900 & 0.63730 as targets.
Comment: RSI is above 50 levels and Pairs above 20MA.
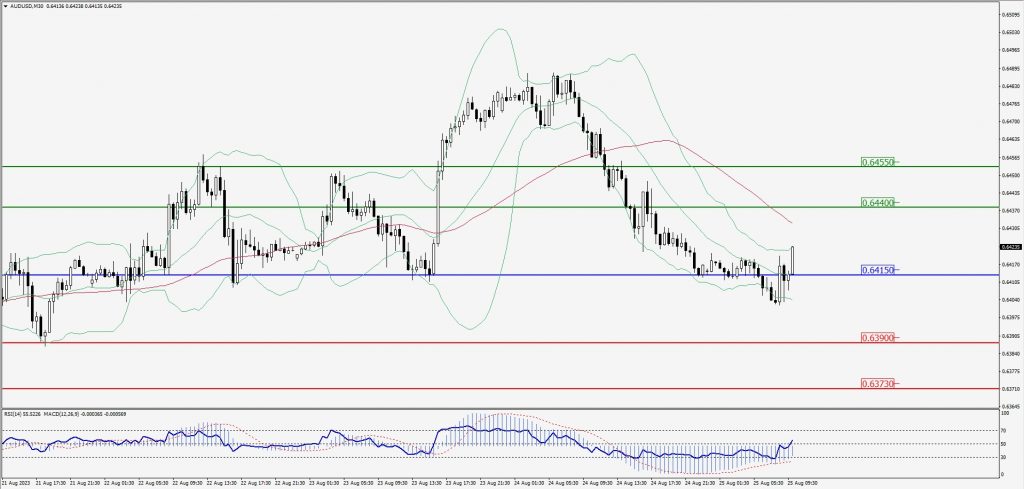
Green Lines Indicate Resistance Levels – Red Lines Indicate Support Levels
Light Blue is a Pivot Point – Black represents the price when the report was produced
CRUDEOIL Intraday: Trend on the upside
Our pivot point is at 79.18
Preferable Price Action: Above pivot buy oil with 79.98 & 80.54 as targets.
Alternative Price Action: Sell crude below pivot with targets at 78.51 and 77.99 in extension.
Comment: MACD is positive territory and Pairs above its 20MA & 55MA.
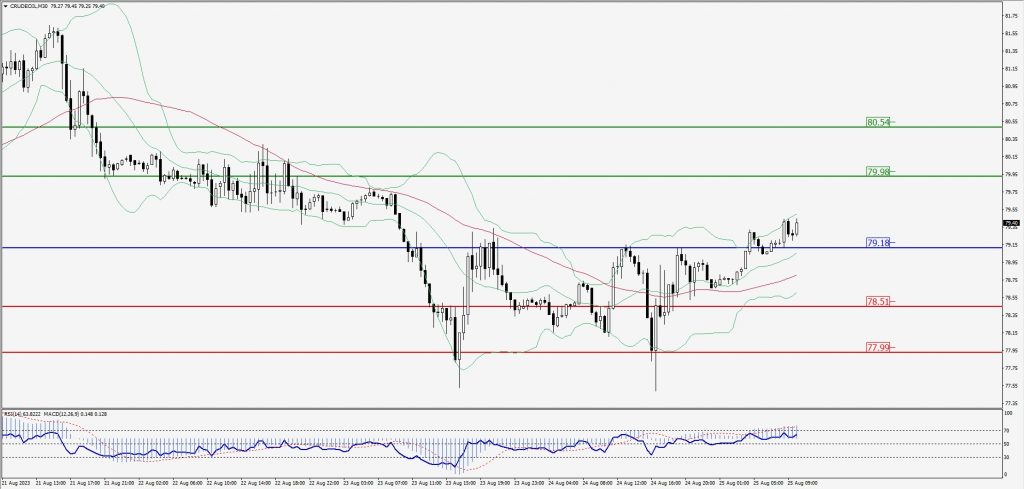
Green Lines Indicate Resistance Levels – Red Lines Indicate Support Levels
Light Blue is a Pivot Point – Black represents the price when the report was produced
XAU/USD Intraday: Trend on the downside
Our pivot point is 1917.70
Preferable Price Action: Further downside to 1910.40 and 1905.90.
Alternative Price Action: If the price gives an upside breakout of a pivot, then the price extends to 1923.90 and 1928.10.
Comment: MACD is below 50 level and Pairs below its 20MA & 55MA.
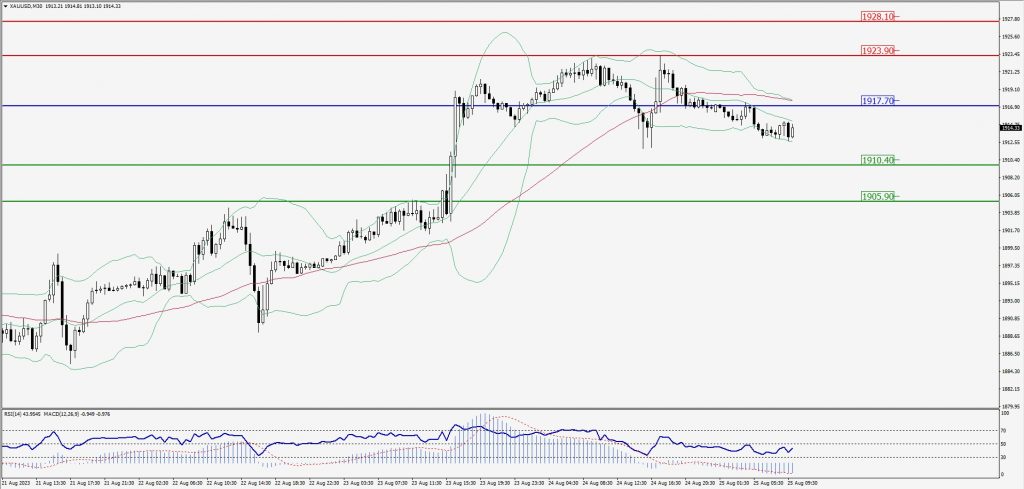
Green Lines Indicate Resistance Levels – Red Lines Indicate Support Levels
Light Blue is a Pivot Point – Black represents the price when the report was produced
Dow Jones Intraday: In a consolidation zone
Our pivot point is 34,239.00
Preferable Price Action: Take sell positions below the pivot with targets at 34,081.00 & 33,987.00.
Alternative Price Action: Above 34,239.00 looks for further upside to 34,361.00 & 34,454.00.
Comment: RSI is at 50 levels and Pairs below 55MA.
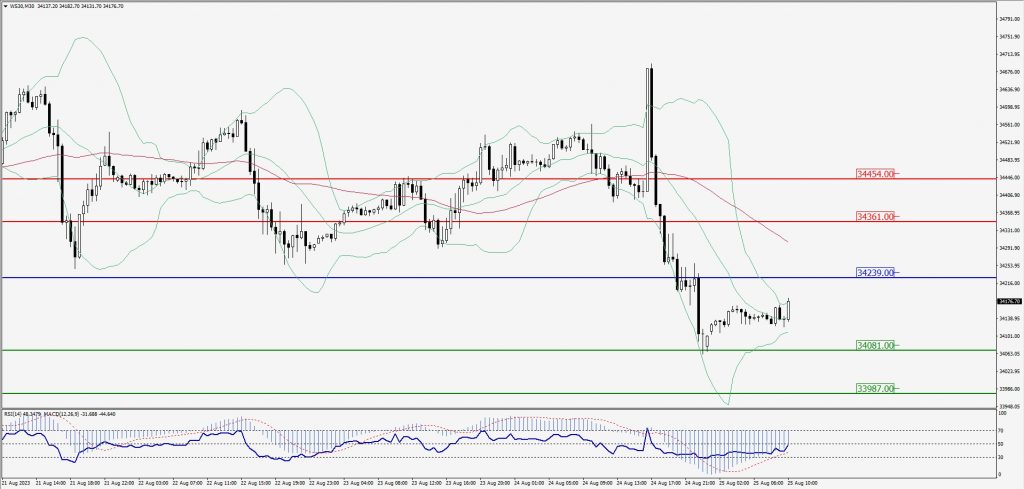
Green Lines Indicate Resistance Levels – Red Lines Indicate Support Levels
Light Blue is a Pivot Point – Black represents the price when the report was produced