Market Wrap: Stocks, Bonds, Commodities
Stock futures are near flat Tuesday night as investors awaited on the latest crop of corporate earnings reports from well-known names including Nvidia.
The Dow Jones Industrial Average fell 174.86 points to 34,288.83, the S&P 500 lose 0.28% to 4,387.55 and the Nasdaq Composite add 8.28 points to 13,505.87.
MSCI’s index of Asia-Pacific stocks outside Japan is advance 0.17% to 611.37 levels. The Australian index was higher by 0.38% to 7,148.40. Japanese Nikkei Index ascend 0.50% today.
European stocks were positive on Wednesday, with the Stoxx Europe 50 Index rose 0.46% to 4,279.07, Germany’s DAX ascend 0.47% to 15,778.95, and France’s CAC advance 0.46% to 7,273.98 and U.K.’s FTSE 100 add 0.79% to 7,327.01.
Benchmark 10-year U.S. Treasury fell as demand for safe assets ascend again, today 10-year bond yields negative 1.47% to 4.2630.
Oil prices steadied on Tuesday as investors remained downbeat on China’s economic malaise hobbling demand from the world’s top crude importer, limiting the impact of supply cuts.
Spot Brent crude oil drop 0.63% to $83.50 per barrel. US West Texas Intermediate crude is down 0.69% to $79.09 a barrel.
The yellow metal gold is advance 0.39% to 1,933.65 dollars per ounce.
Market Wrap: Forex
The U.S. dollar slipped slightly in early European trade Wednesday, easing back from a two-month high ahead of more cues on monetary policy from the Jackson Hole Symposium this week.
Today, the U.S. dollar index measures the Greenback against a trade-weighted basket of six major currencies, which surged 0.23% to 103.717.
The Euro US Dollar (EUR/USD) is a widely traded pair that is up 0.26% today. This left the pair trading around $1.08140.
The Japanese yen was negative against the U.S. dollar on Wednesday. Today USD/JPY is slipped 0.34% to the 145.390 level.
Another commodity-related currency mixed against the U.S dollar, AUD/USD rose 0.09% to 0.64270, and NZD/USD slipped 0.03% to 0.59420 level.
EUR/USD Intraday: Support level at 1.08560
Our pivot point is at 1.08560
Preferable Price Action: Take buy positions above pivot level with targets at 1.09760 & 1.08910 in extension.
Alternative Price Action: Below pivot looks for a further downside to 1.08320 & 1.08180.
Comment: RSI is above 50 levels and Pairs above 20MA.
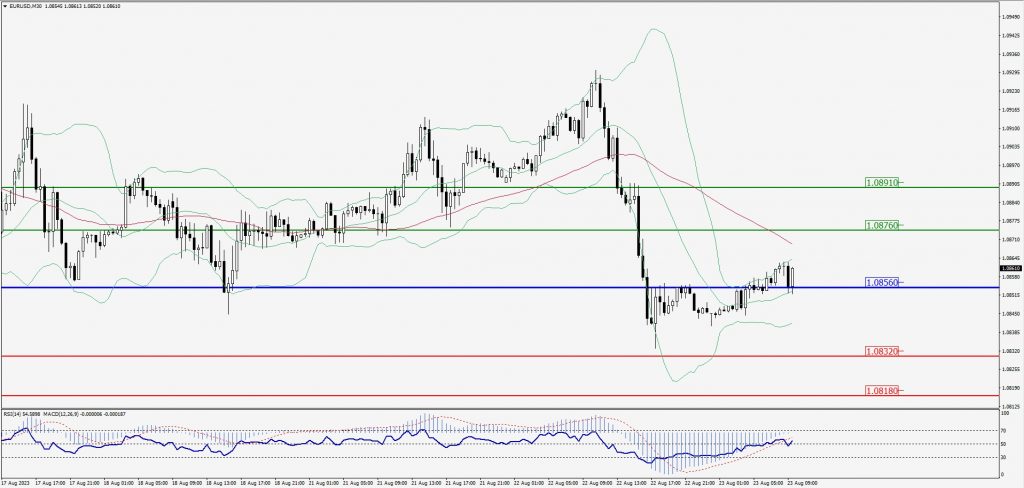
Green Lines Indicate Resistance Levels – Red Lines Indicate Support Levels
Light Blue is a Pivot Point – Black represents the price when the report was produced
GBP/USD Intraday: Trend on the upside
Our pivot point is at 1.27440
Preferable Price Action: Buy positions above pivot with targets at 1.27710 & 1.27930 in extension.
Alternative Price Action: The price below pivot would call for further downside to 1.27180 & 1.27000.
Comment: RSI is above 50 levels and Pairs above 20MA.
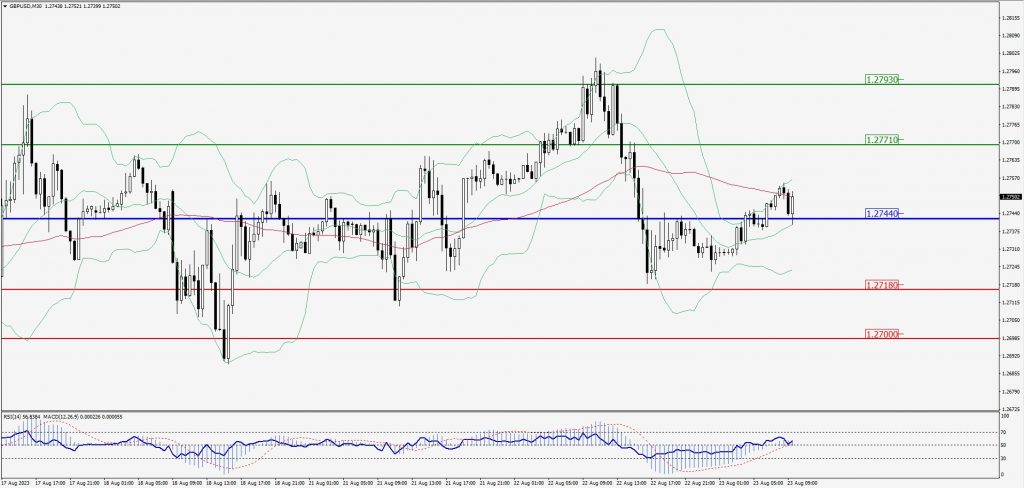
Green Lines Indicate Resistance Levels – Red Lines Indicate Support Levels
Light Blue is a Pivot Point – Black represents the price when the report was produced
USD/JPY Intraday: Resistance level at 145.750
Our pivot point is at 145.750
Preferable Price Action: Sell position below pivot with the target at 145.440 and 145.250 in extension.
Alternative Price Action: The upside breakout of the pivot would call for 146.040 and 146.230.
Comment: MACD is below 50 level and Pairs below 55MA.
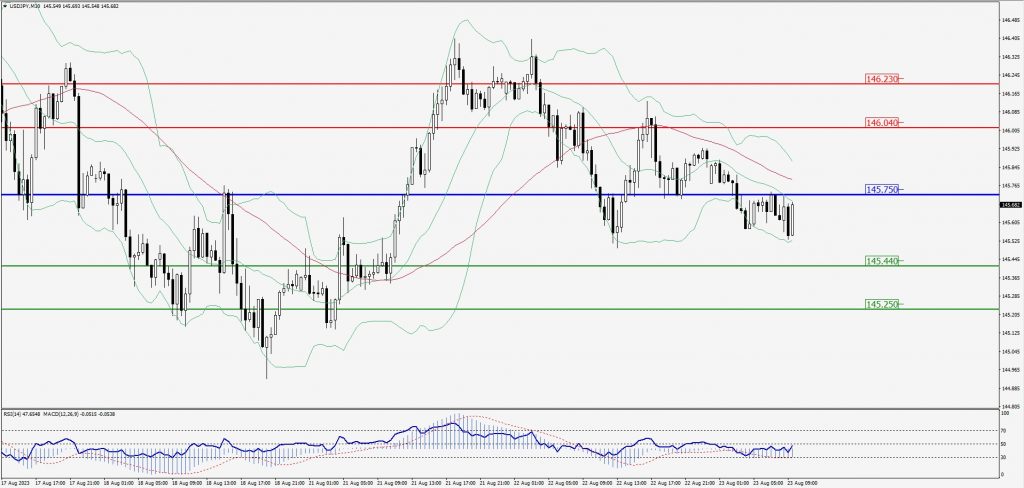
Green Lines Indicate Resistance Levels – Red Lines Indicate Support Levels
Light Blue is a Pivot Point – Black represents the price when the report was produced
AUD/USD Intraday: Trend on the downside
Our pivot point is at 0.64370
Preferable Price Action: Sell positions below pivot with targets at 0.64190 & 0.64070 in extension.
Alternative Price Action: Above pivot looks for a further upside with 0.64520 & 0.64630 as targets.
Comment: RSI is below 50 levels and Pairs below its 20MA & 55MA.
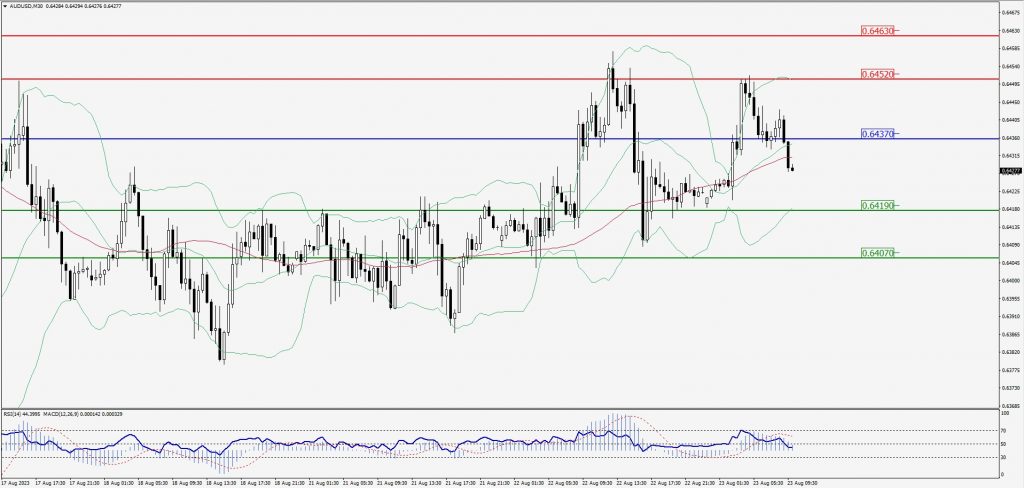
Green Lines Indicate Resistance Levels – Red Lines Indicate Support Levels
Light Blue is a Pivot Point – Black represents the price when the report was produced
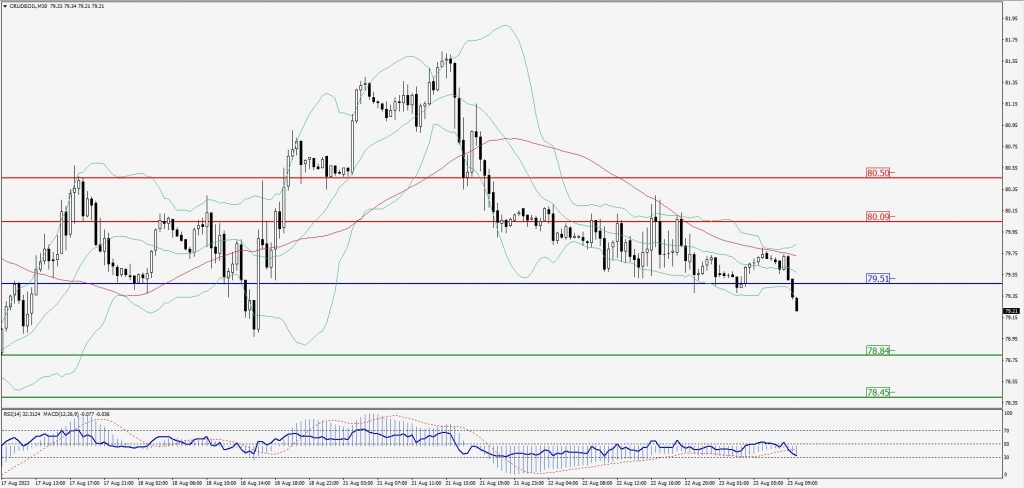
CRUDEOIL Intraday: Major trend on the downside
Our pivot point is at 79.51
Preferable Price Action: Below pivot sell oil with 78.84 & 78.45 as targets.
Alternative Price Action: Buy crude above pivot with targets at 80.09 and 80.50 in extension.
Comment: MACD is negative territory and Pairs below its 20MA & 55MA.
Green Lines Indicate Resistance Levels – Red Lines Indicate Support Levels
Light Blue is a Pivot Point – Black represents the price when the report was produced
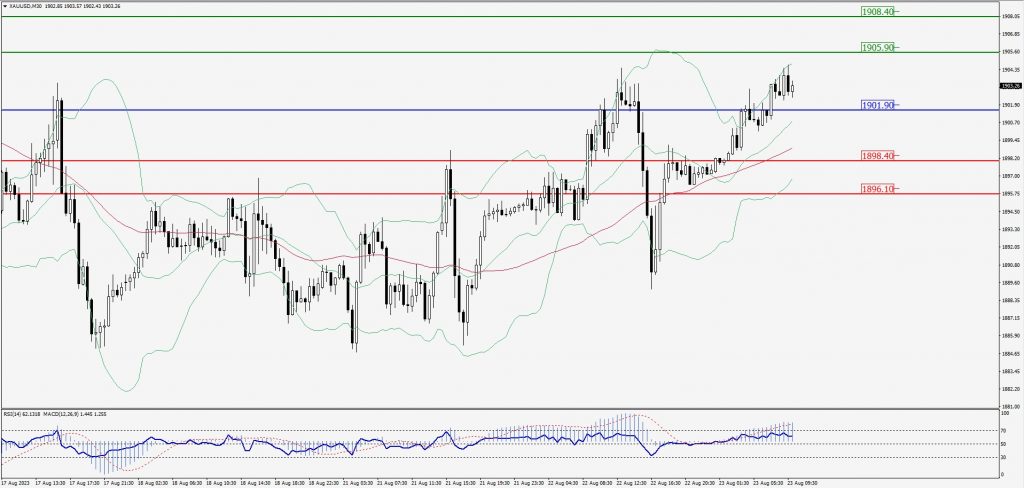
XAU/USD Intraday: Trend on the upside
Our pivot point is 1901.90
Preferable Price Action: Further upside to 1905.90 and 1908.40.
Alternative Price Action: If the price gives a downside breakout of a pivot, then the price extends to 1898.40 and 1896.10.
Comment: MACD is above 50 level and Pairs above its 20MA & 55MA.
Green Lines Indicate Resistance Levels – Red Lines Indicate Support Levels
Light Blue is a Pivot Point – Black represents the price when the report was produced
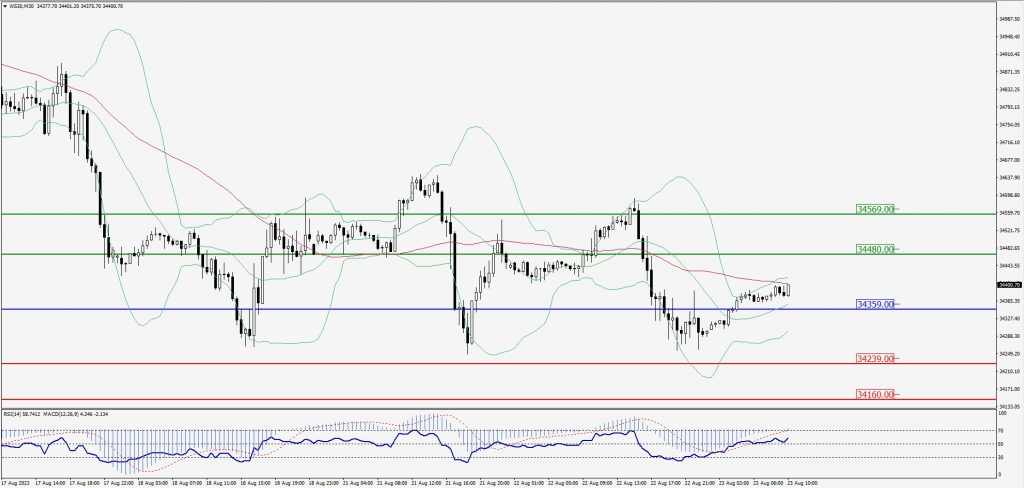
Dow Jones Intraday: Trend on the upside
Our pivot point is 34,359.00
Preferable Price Action: Take buy positions above the pivot with targets at 34,480.00 & 34,569.00.
Alternative Price Action: Below 34,359.00 looks for further downside to 34,239.00 & 34,160.00.
Comment: RSI is above 50 levels and Pairs above 20MA.
Green Lines Indicate Resistance Levels – Red Lines Indicate Support Levels
Light Blue is a Pivot Point – Black represents the price when the report was produced